| Param | Original file | Final file |
|---|---|---|
| Filename | modeM0/AS1A14_066T07_9000006522_54691cztM0_level2.fits | modeM0/AS1A14_066T07_9000006522_54691cztM0_level2_quad_clean.evt |
| Size (bytes) | 450,501,120 | 86,544,000 |
| Size | 429.6 MB | 82.5 MB |
| Events in quadrant A | 3,183,196 | 585,598 |
| Events in quadrant B | 3,111,925 | 621,491 |
| Events in quadrant C | 3,074,526 | 562,034 |
| Events in quadrant D | 6,852,059 | 443,394 |
| Mode M9 | |||
|---|---|---|---|
| Quadrant | BADHDUFLAG | Total packets | Discarded packets |
| A | 0 | 12 | 0 |
| B | 0 | 12 | 0 |
| C | 0 | 12 | 0 |
| D | 0 | 12 | 0 |
| Mode M0 | |||
|---|---|---|---|
| Quadrant | BADHDUFLAG | Total packets | Discarded packets |
| A | 0 | 13578 | 1 |
| B | 0 | 13436 | 1 |
| C | 0 | 13239 | 1 |
| D | 0 | 24497 | 1 |
| Mode SS | |||
|---|---|---|---|
| Quadrant | BADHDUFLAG | Total packets | Discarded packets |
| A | 0 | 118 | 0 |
| B | 0 | 118 | 0 |
| C | 0 | 118 | 0 |
| D | 0 | 118 | 0 |
| Quadrant | Total seconds | Saturated seconds | Saturation percentage |
|---|---|---|---|
| A | 5843 | 129 | 2.207770% |
| B | 5843 | 159 | 2.721205% |
| C | 5843 | 89 | 1.523190% |
| D | 5842 | 1130 | 19.342691% |
Noise dominated data is calculated using 1-second bins in cleaned event files. If a bin has >2000 counts, and if more than 50% of those come from <1% of pixels, then it is considered to be noise-dominated and hence unusable.
| Quadrant | # 1 sec bins | Bins with >0 counts | Bins with >2000 counts | High rate bins dominated by noise | Noise dominated (total time) | Noise dominated (detector-on time) | Marked lightcurve |
|---|---|---|---|---|---|---|---|
| A | 7023 | 5844 | 57 | 57 | 0.81% | 0.98% |  |
| B | 7023 | 5844 | 62 | 62 | 0.88% | 1.06% | 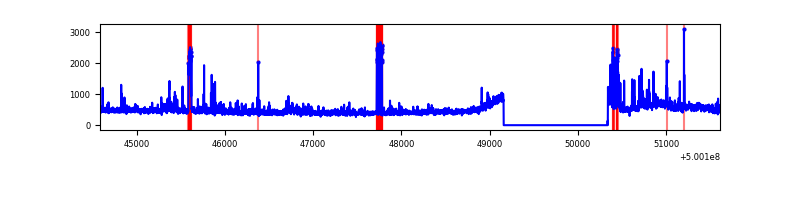 |
| C | 7023 | 5844 | 43 | 43 | 0.61% | 0.74% | 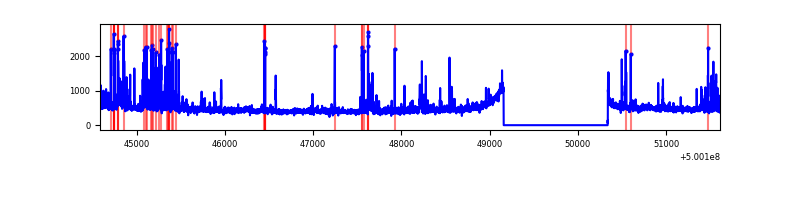 |
| D | 7022 | 5843 | 1101 | 1101 | 15.68% | 18.84% | 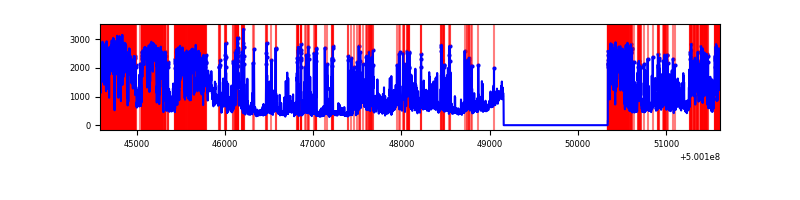 |
Top three noisy pixels from each quadrant. If the there are fewer than three noisy pixels in the level2.evt file, extra rows are filled as -1
| Pixel properties | Quadrant properties | ||||||
|---|---|---|---|---|---|---|---|
| Quadrant | DetID | PixID | Counts | Sigma | Mean | Median | Sigma |
| A | 3 | 14 | 170633 | 1050.36 | 653 | 639 | 161.8 |
| A | 11 | 3 | 170439 | 1049.16 | 653 | 639 | 161.8 |
| A | 0 | 8 | 102491 | 629.33 | 653 | 639 | 161.8 |
| B | 2 | 249 | 234497 | 1686.53 | 646 | 623 | 138.7 |
| B | 7 | 0 | 115982 | 831.89 | 646 | 623 | 138.7 |
| B | 1 | 207 | 93914 | 672.75 | 646 | 623 | 138.7 |
| C | 6 | 223 | 185416 | 1055.54 | 639 | 632 | 175.1 |
| C | 14 | 254 | 161632 | 919.68 | 639 | 632 | 175.1 |
| C | 1 | 16 | 75818 | 429.48 | 639 | 632 | 175.1 |
| D | 11 | 129 | 2138986 | 12802.74 | 581 | 555 | 167.0 |
| D | 11 | 176 | 909139 | 5439.67 | 581 | 555 | 167.0 |
| D | 2 | 172 | 873019 | 5223.42 | 581 | 555 | 167.0 |
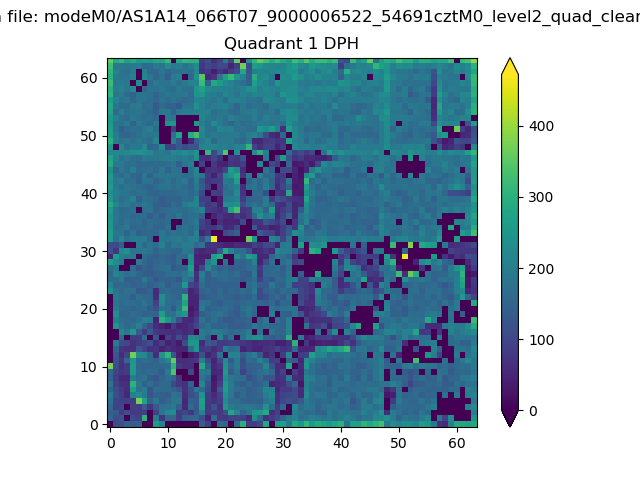
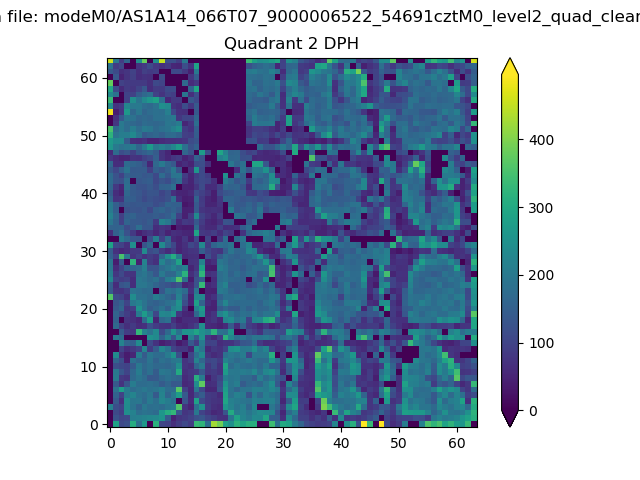
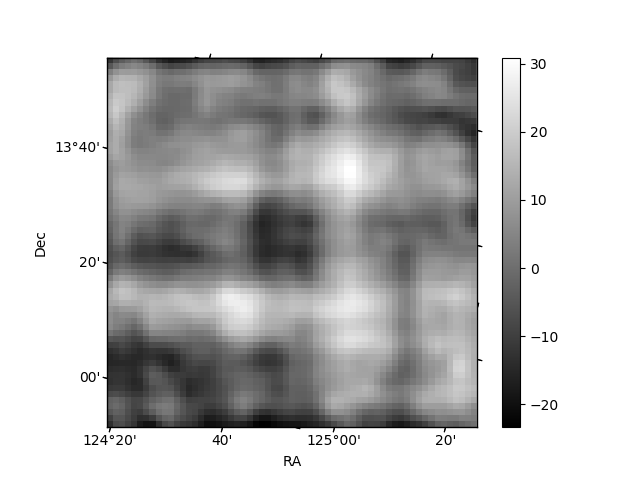
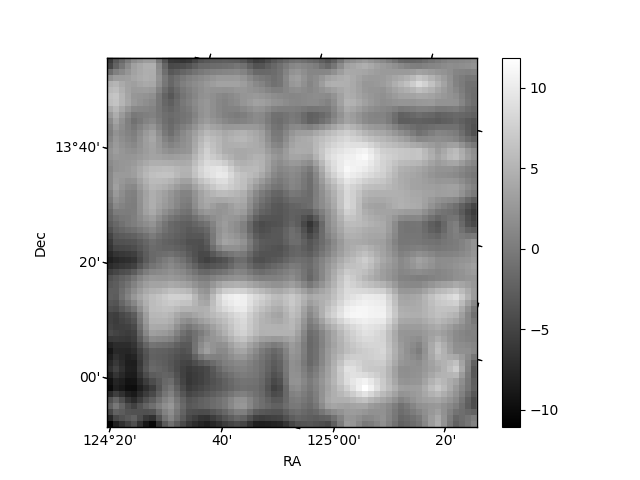
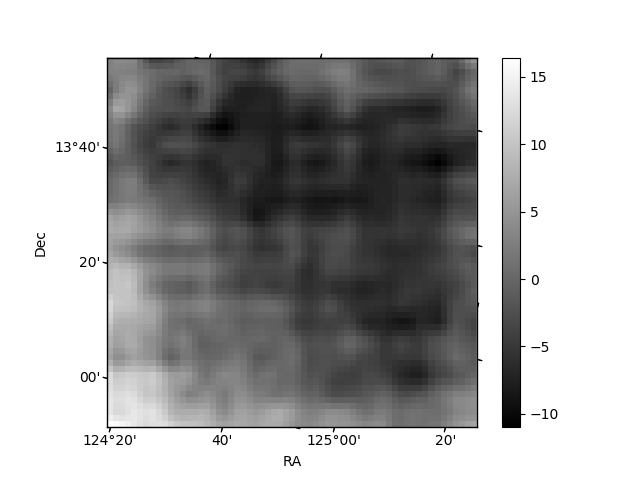
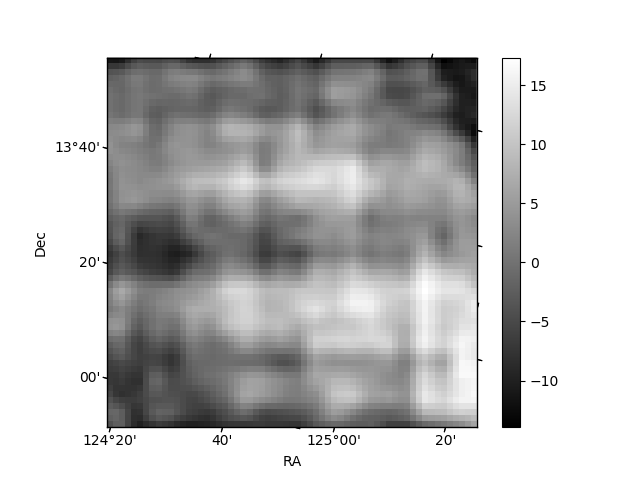
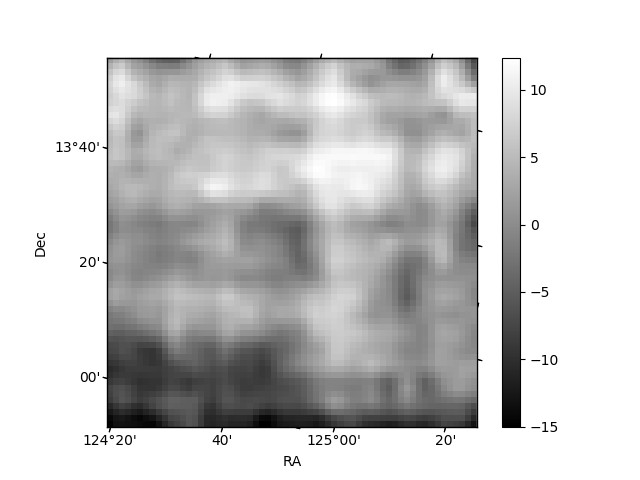
Histogram calculated using DETX and DETY for each event in the final _common_clean file
| Quadrant A | 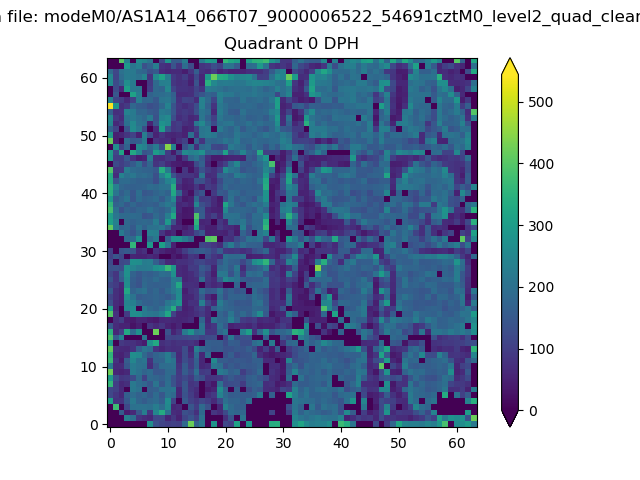 |
 |
Quadrant B |
|---|---|---|---|
| Quadrant D | 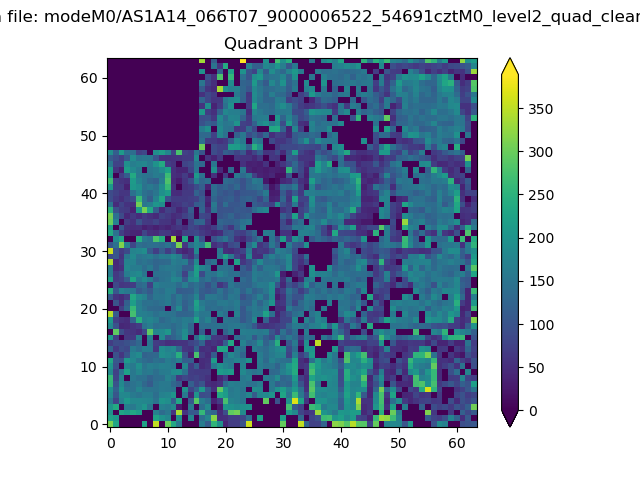 |
 |
Quadrant C |
| Plot type | Count rate plots | Images |
|---|---|---|
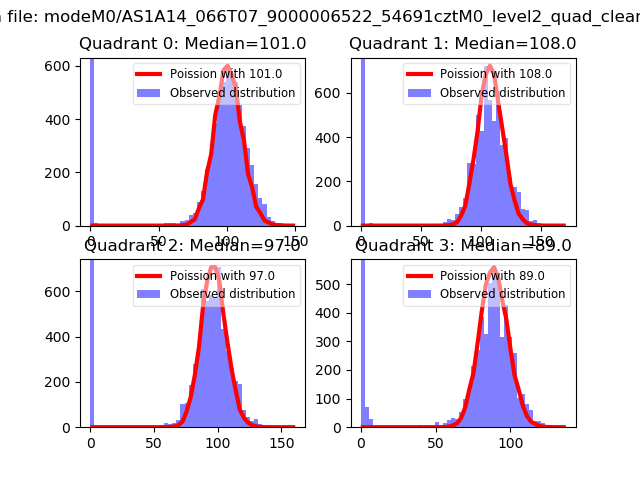
| Comparison with Poisson distribution Blue bars denote a histogram of data divided into 1 sec bins. Red curve is a Poisson curve with rate = median count rate of data. |
 |
 |
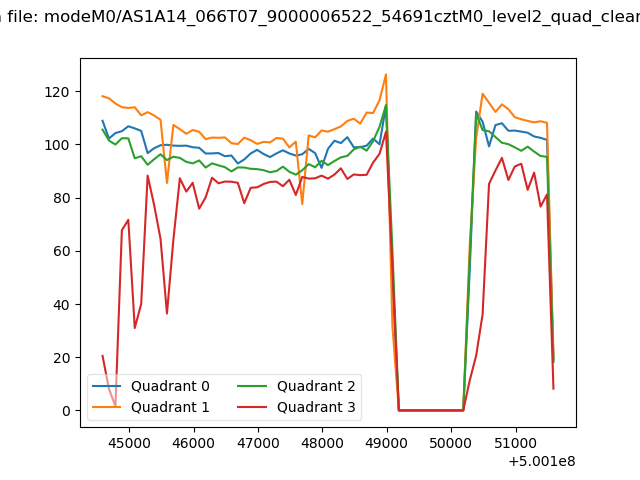
| Quadrant-wise count rates Data is divided into 100 sec bins |
 |
|
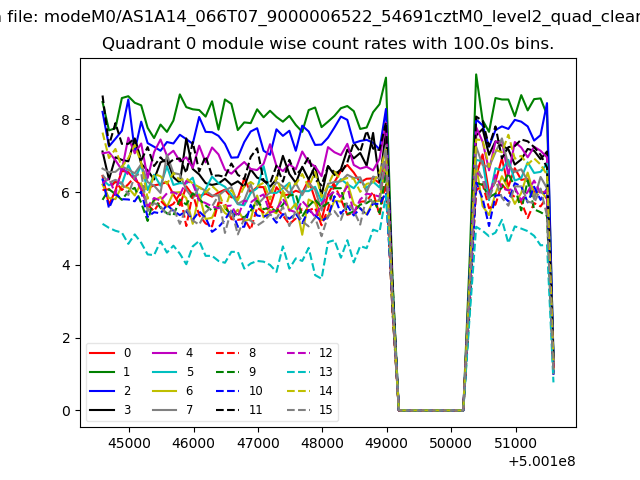
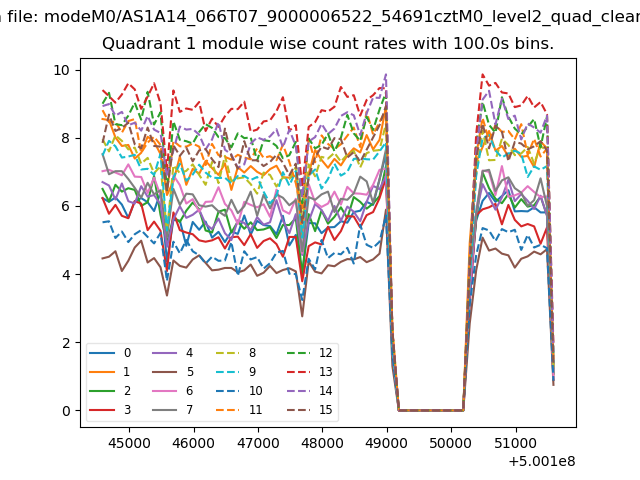
| Module-wise count rates for Quadrant A Data is divided into 100 sec bins |
 |
 |
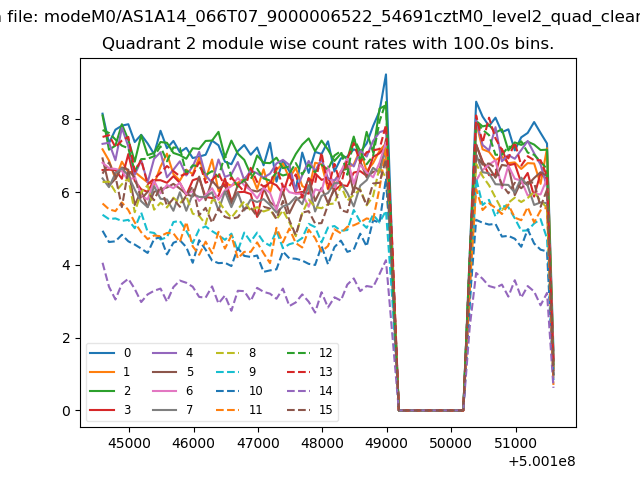
| Module-wise count rates for Quadrant B Data is divided into 100 sec bins |
 |
 |
| Module-wise count rates for Quadrant C Data is divided into 100 sec bins |
 |
 |
| Module-wise count rates for Quadrant D Data is divided into 100 sec bins |
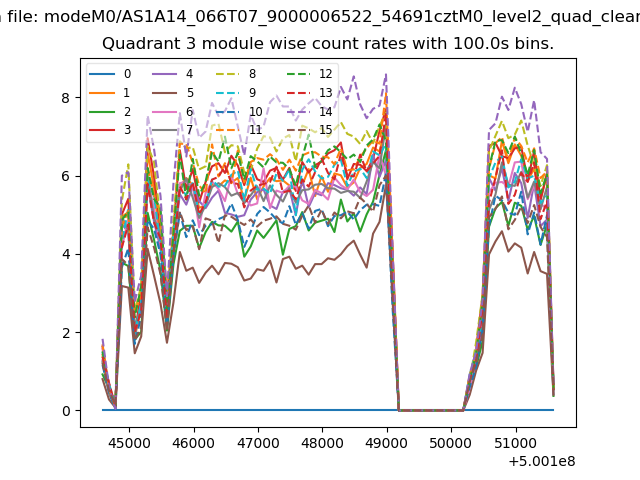 |
 |
| Parameter | Plot |
|---|---|
| CZT HV Monitor |  |
| D_VDD | 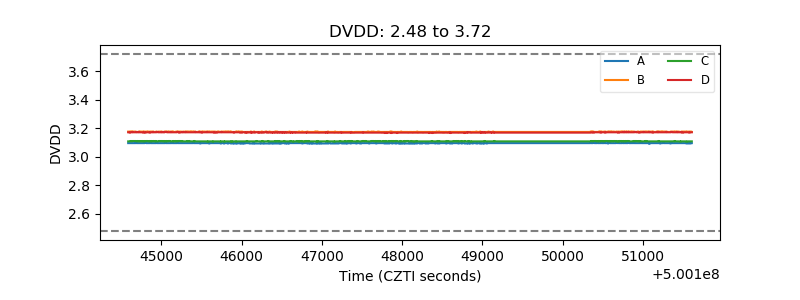 |
| Temperature 1 | 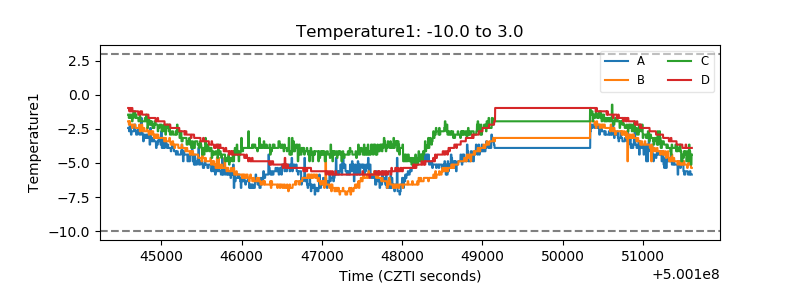 |
| Veto HV Monitor | 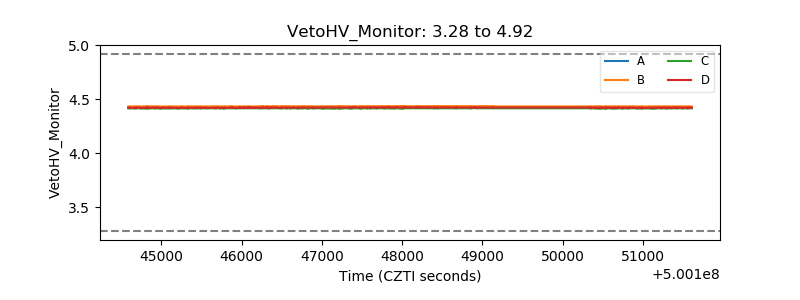 |
| Veto LLD | 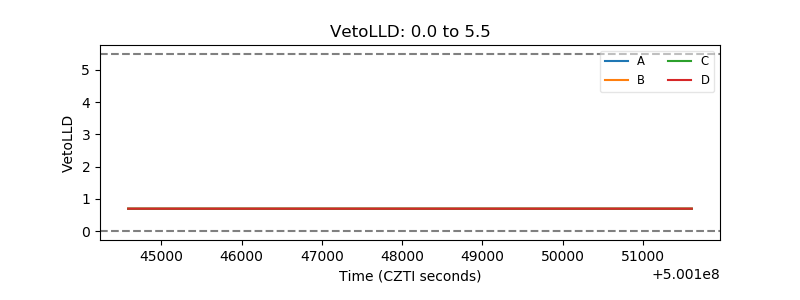 |
| Alpha Counter | 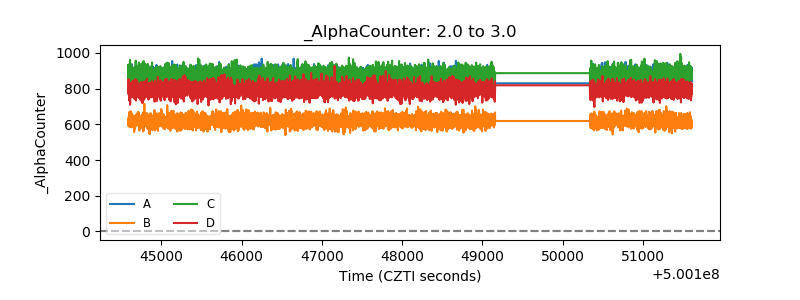 |
| _CPM_Rate | 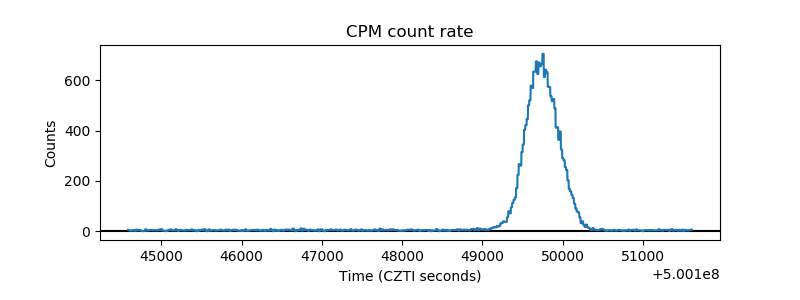 |
| CZT Counter | 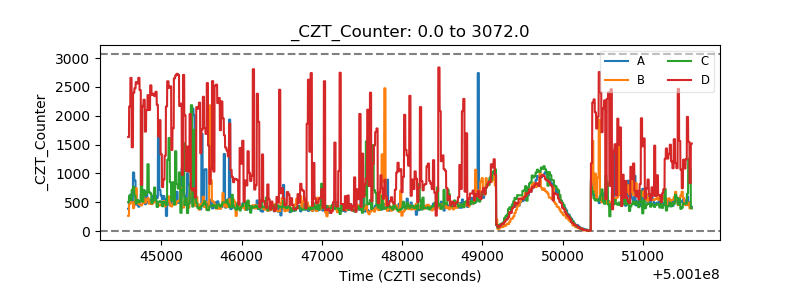 |
| +2.5 Volts monitor |  |
| +5 Volts monitor |  |
| _ROLL_ROT | 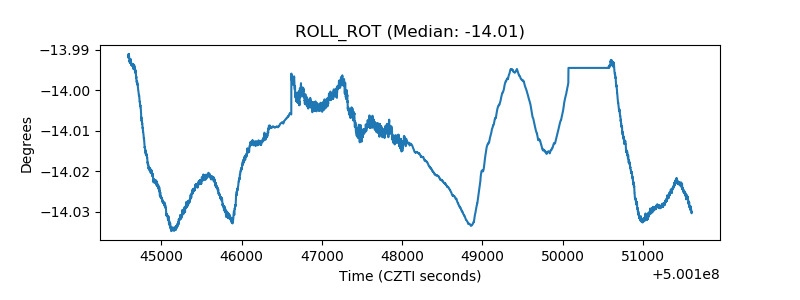 |
| _Roll_DEC | 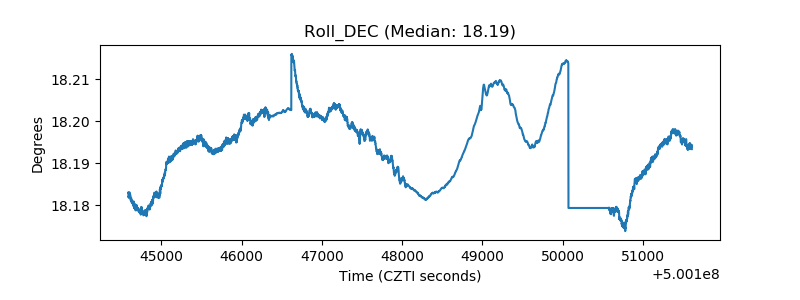 |
| _Roll_RA | 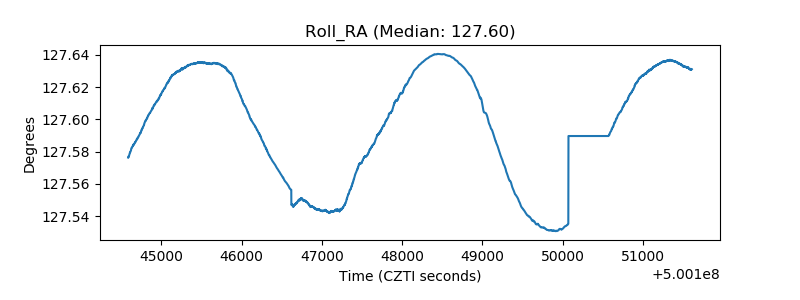 |
| Veto Counter | 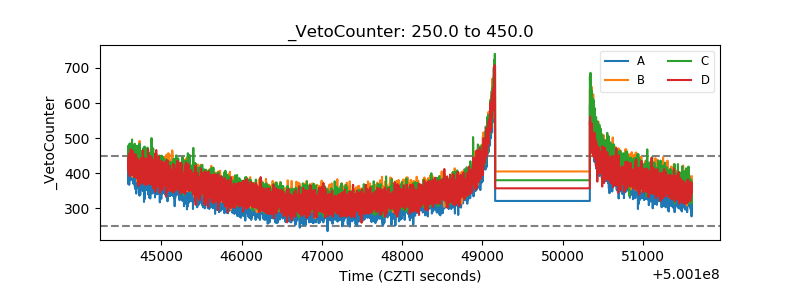 |