| Param | Original file | Final file |
|---|---|---|
| Filename | modeM0/AS1A14_066T07_9000006522_54692cztM0_level2.fits | modeM0/AS1A14_066T07_9000006522_54692cztM0_level2_quad_clean.evt |
| Size (bytes) | 541,140,480 | 90,201,600 |
| Size | 516.1 MB | 86.0 MB |
| Events in quadrant A | 4,259,061 | 610,403 |
| Events in quadrant B | 3,283,414 | 655,747 |
| Events in quadrant C | 3,176,292 | 590,130 |
| Events in quadrant D | 8,824,647 | 436,382 |
| Mode M9 | |||
|---|---|---|---|
| Quadrant | BADHDUFLAG | Total packets | Discarded packets |
| A | 0 | 11 | 0 |
| B | 0 | 11 | 0 |
| C | 0 | 11 | 0 |
| D | 0 | 11 | 0 |
| Mode M0 | |||
|---|---|---|---|
| Quadrant | BADHDUFLAG | Total packets | Discarded packets |
| A | 0 | 16872 | 1 |
| B | 0 | 14253 | 1 |
| C | 0 | 14040 | 1 |
| D | 0 | 30628 | 1 |
| Mode SS | |||
|---|---|---|---|
| Quadrant | BADHDUFLAG | Total packets | Discarded packets |
| A | 0 | 128 | 0 |
| B | 0 | 128 | 0 |
| C | 0 | 128 | 0 |
| D | 0 | 128 | 0 |
| Quadrant | Total seconds | Saturated seconds | Saturation percentage |
|---|---|---|---|
| A | 6282 | 203 | 3.231455% |
| B | 6283 | 132 | 2.100907% |
| C | 6283 | 81 | 1.289193% |
| D | 6283 | 1722 | 27.407290% |
Noise dominated data is calculated using 1-second bins in cleaned event files. If a bin has >2000 counts, and if more than 50% of those come from <1% of pixels, then it is considered to be noise-dominated and hence unusable.
| Quadrant | # 1 sec bins | Bins with >0 counts | Bins with >2000 counts | High rate bins dominated by noise | Noise dominated (total time) | Noise dominated (detector-on time) | Marked lightcurve |
|---|---|---|---|---|---|---|---|
| A | 7372 | 6283 | 111 | 111 | 1.51% | 1.77% | 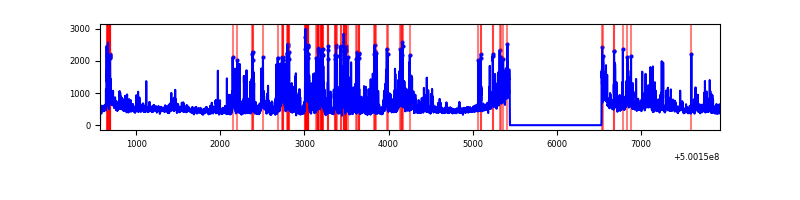 |
| B | 7373 | 6284 | 59 | 59 | 0.80% | 0.94% | 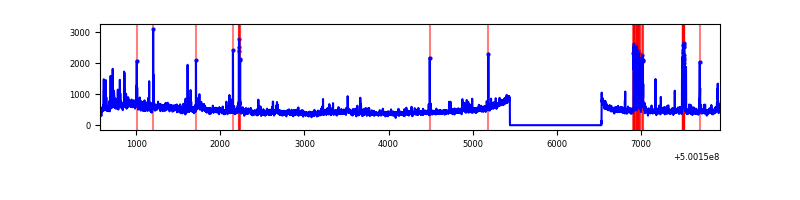 |
| C | 7373 | 6284 | 60 | 60 | 0.81% | 0.95% | 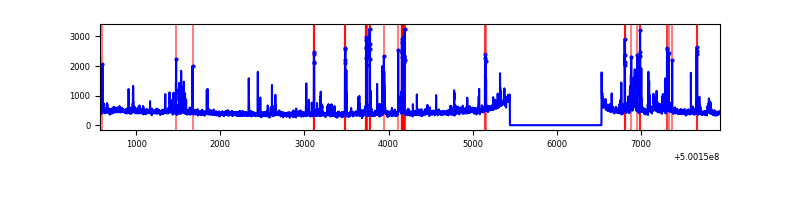 |
| D | 7373 | 6284 | 1774 | 1774 | 24.06% | 28.23% | 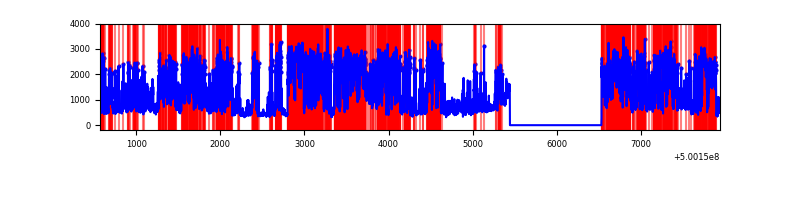 |
Top three noisy pixels from each quadrant. If the there are fewer than three noisy pixels in the level2.evt file, extra rows are filled as -1
| Pixel properties | Quadrant properties | ||||||
|---|---|---|---|---|---|---|---|
| Quadrant | DetID | PixID | Counts | Sigma | Mean | Median | Sigma |
| A | 7 | 190 | 1108323 | 6517.29 | 682 | 666 | 170.0 |
| A | 3 | 14 | 162429 | 951.79 | 682 | 666 | 170.0 |
| A | 11 | 3 | 156710 | 918.14 | 682 | 666 | 170.0 |
| B | 2 | 249 | 199638 | 1355.81 | 682 | 657 | 146.8 |
| B | 7 | 0 | 199280 | 1353.37 | 682 | 657 | 146.8 |
| B | 10 | 247 | 69118 | 466.48 | 682 | 657 | 146.8 |
| C | 4 | 5 | 149596 | 801.14 | 672 | 666 | 185.9 |
| C | 6 | 223 | 85056 | 453.96 | 672 | 666 | 185.9 |
| C | 1 | 16 | 79505 | 424.1 | 672 | 666 | 185.9 |
| D | 11 | 129 | 4464638 | 25560.35 | 602 | 575 | 174.6 |
| D | 2 | 172 | 792360 | 4533.61 | 602 | 575 | 174.6 |
| D | 11 | 176 | 428619 | 2450.9 | 602 | 575 | 174.6 |
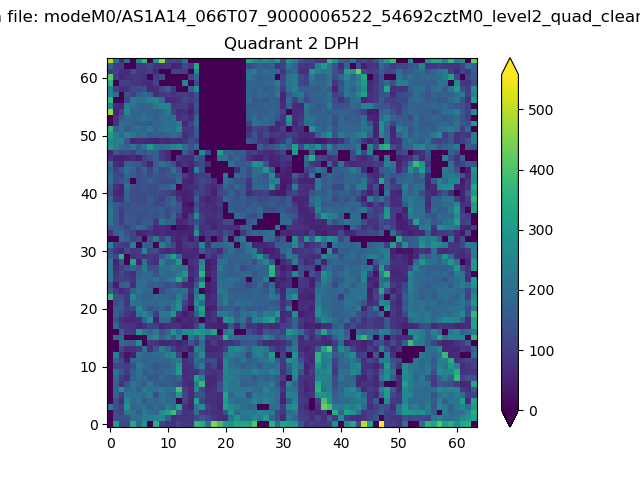
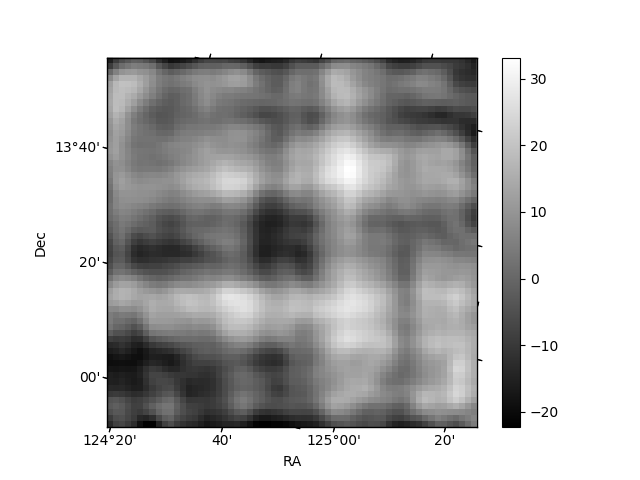
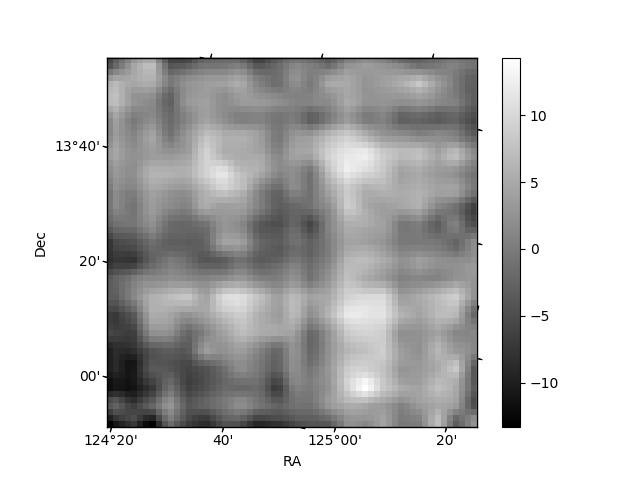
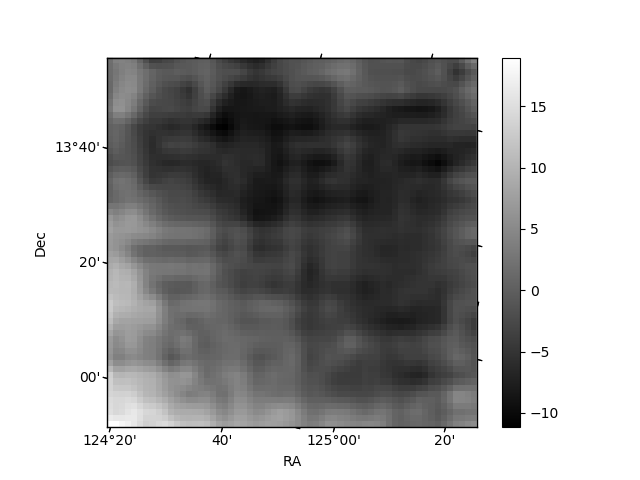
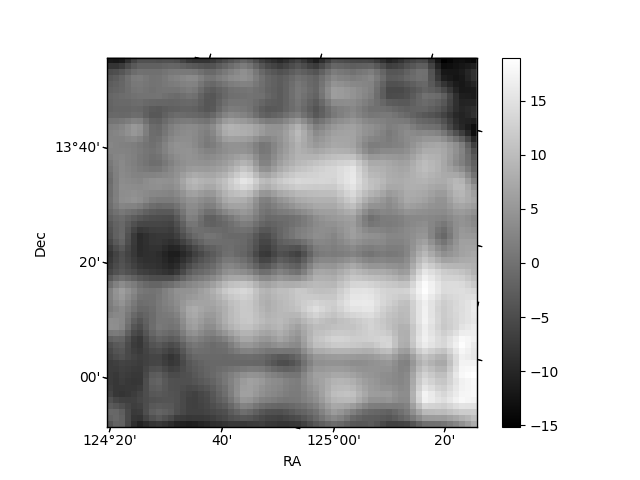
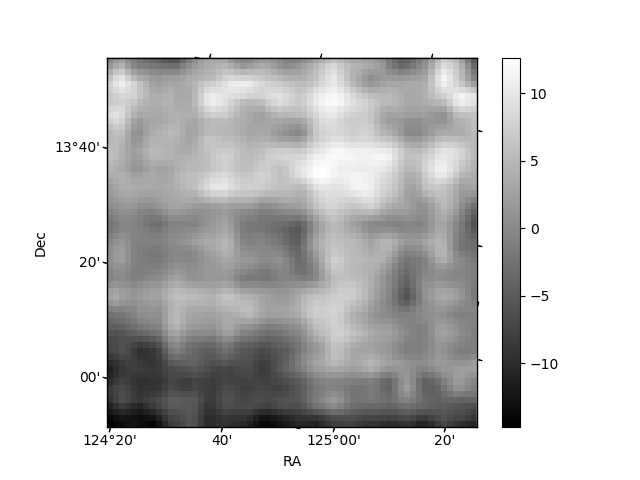
Histogram calculated using DETX and DETY for each event in the final _common_clean file
| Quadrant A | 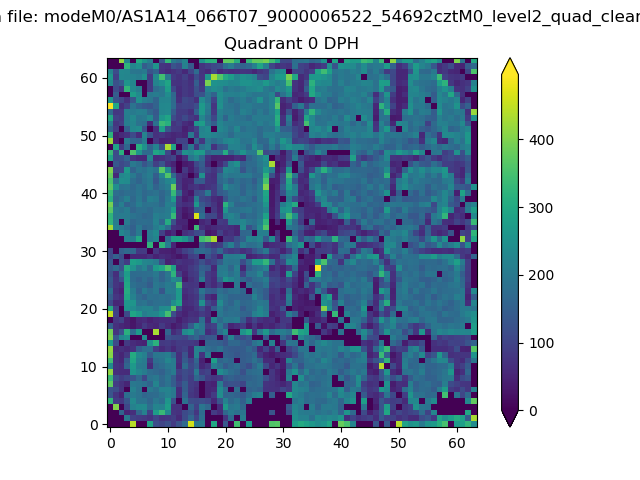 |
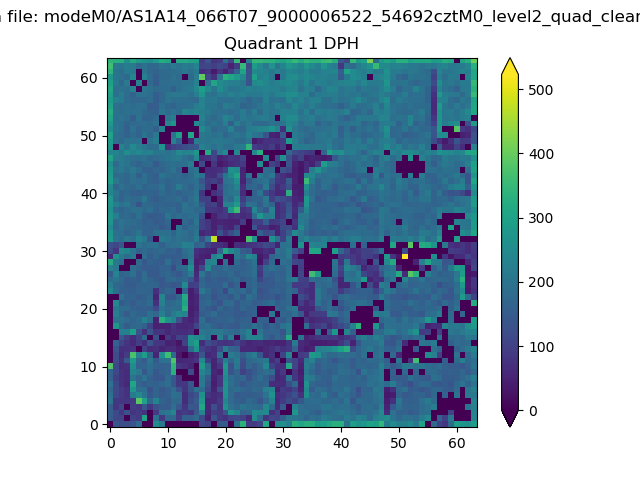 |
Quadrant B |
|---|---|---|---|
| Quadrant D | 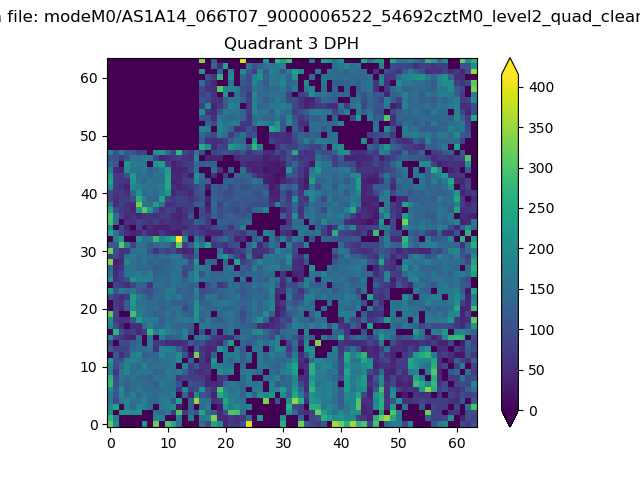 |
 |
Quadrant C |
| Plot type | Count rate plots | Images |
|---|---|---|
| Comparison with Poisson distribution Blue bars denote a histogram of data divided into 1 sec bins. Red curve is a Poisson curve with rate = median count rate of data. |
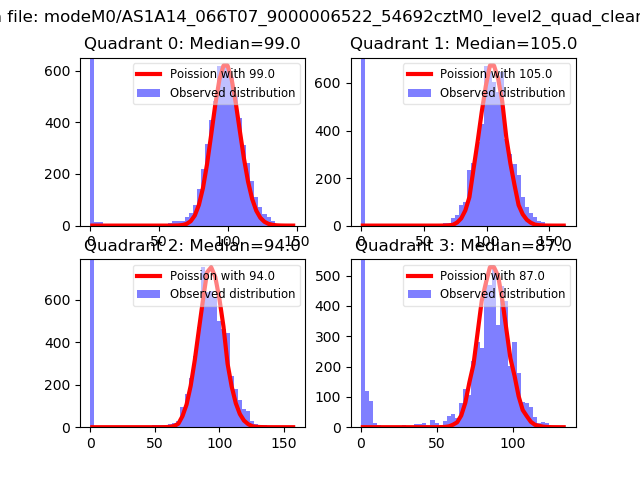 |
 |
| Quadrant-wise count rates Data is divided into 100 sec bins |
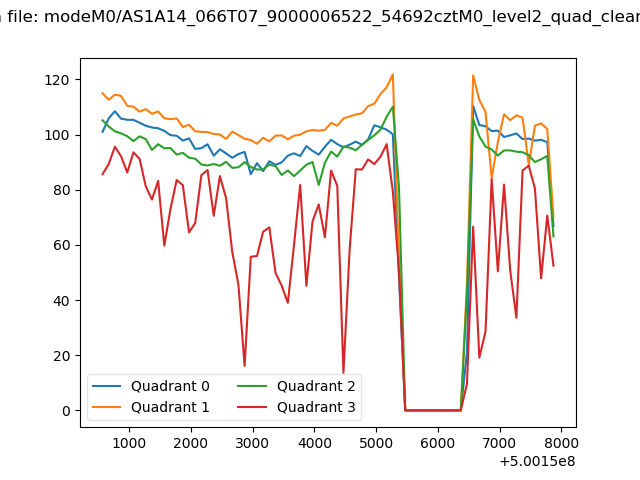 |
|
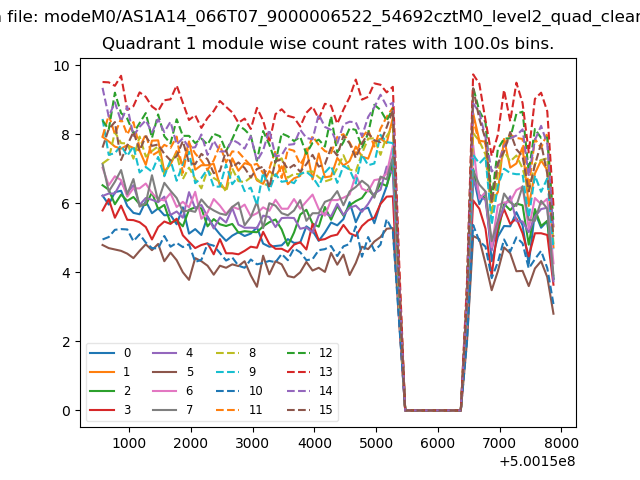
| Module-wise count rates for Quadrant A Data is divided into 100 sec bins |
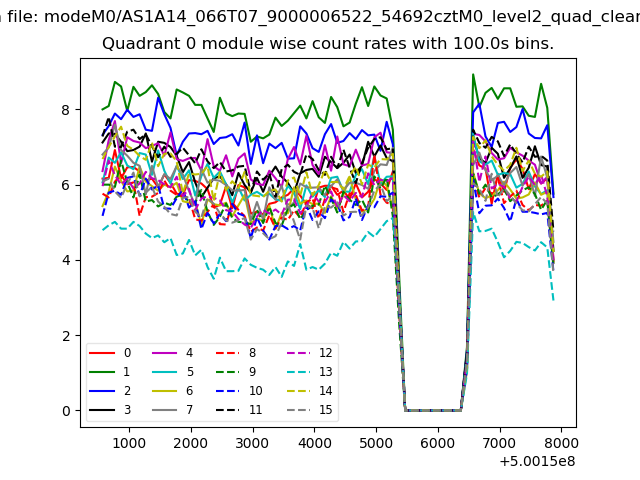 |
 |
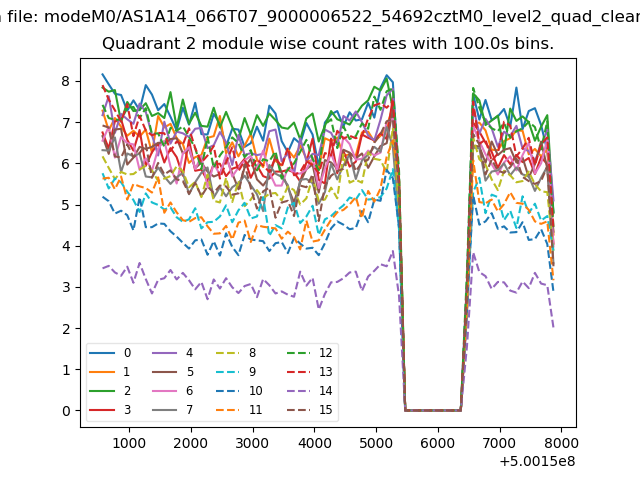
| Module-wise count rates for Quadrant B Data is divided into 100 sec bins |
 |
 |
| Module-wise count rates for Quadrant C Data is divided into 100 sec bins |
 |
 |
| Module-wise count rates for Quadrant D Data is divided into 100 sec bins |
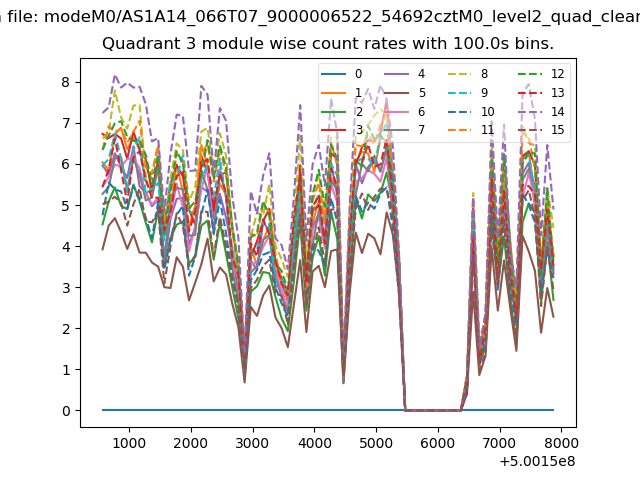 |
 |
| Parameter | Plot |
|---|---|
| CZT HV Monitor | 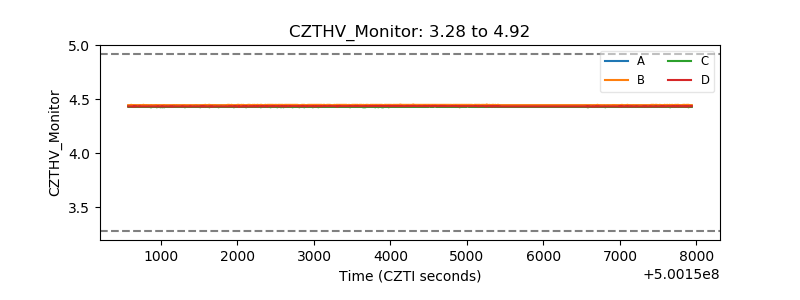 |
| D_VDD | 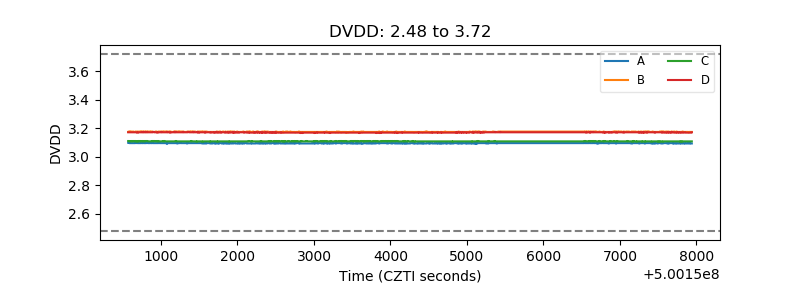 |
| Temperature 1 | 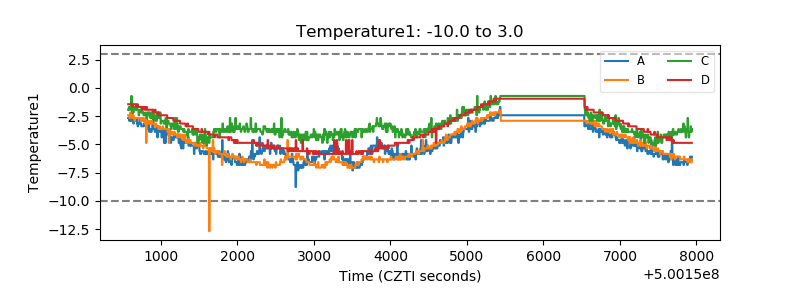 |
| Veto HV Monitor | 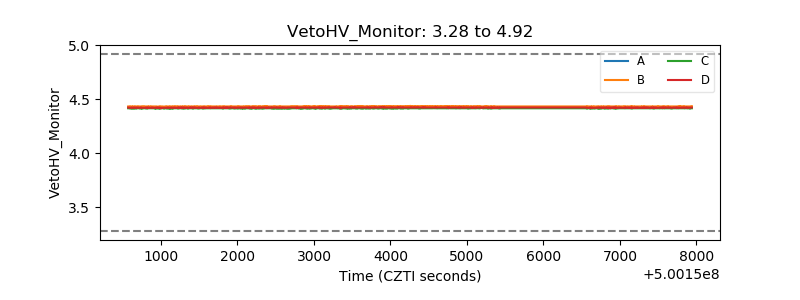 |
| Veto LLD | 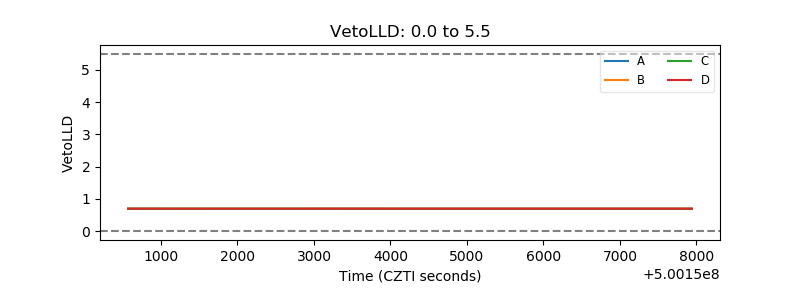 |
| Alpha Counter | 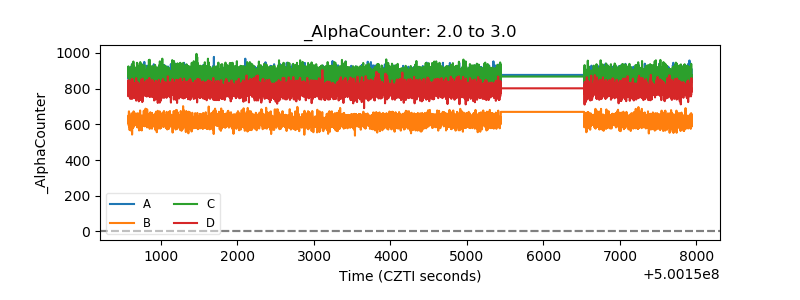 |
| _CPM_Rate | 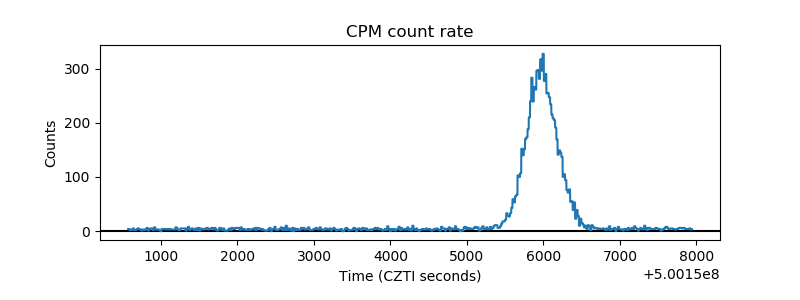 |
| CZT Counter | 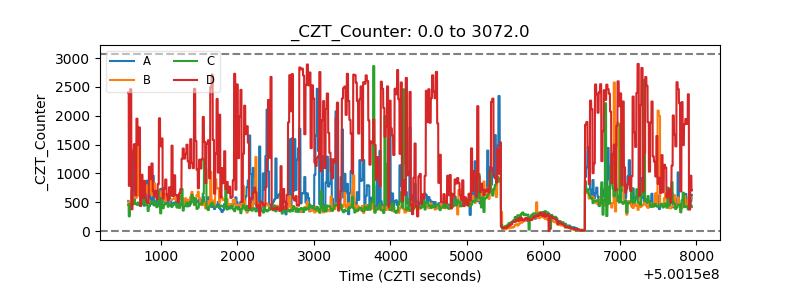 |
| +2.5 Volts monitor |  |
| +5 Volts monitor |  |
| _ROLL_ROT | 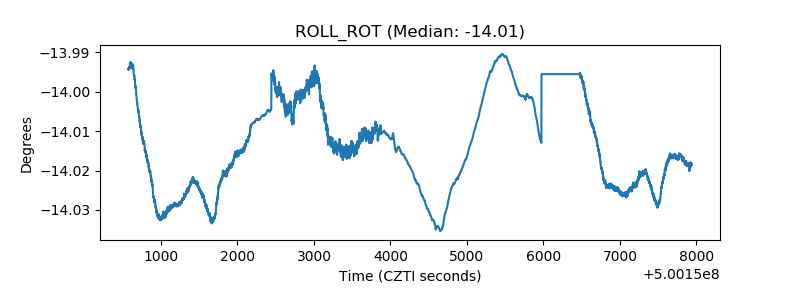 |
| _Roll_DEC | 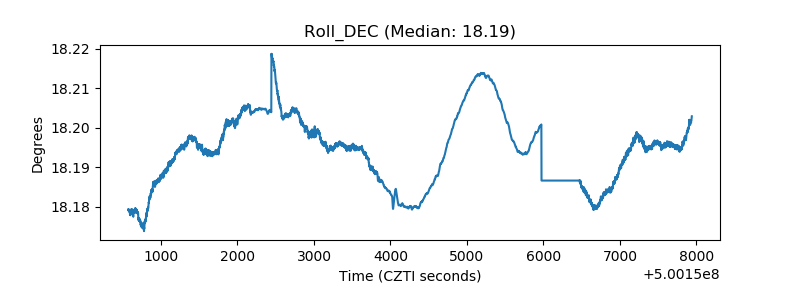 |
| _Roll_RA | 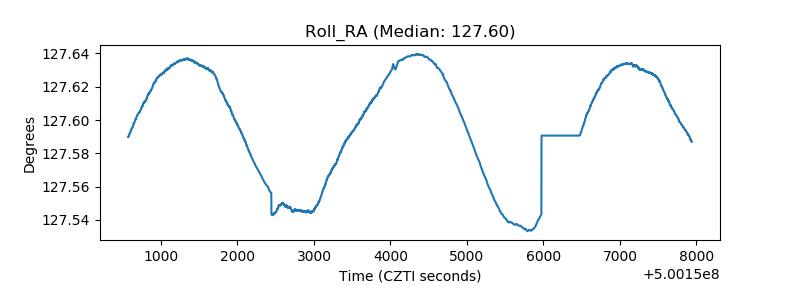 |
| Veto Counter | 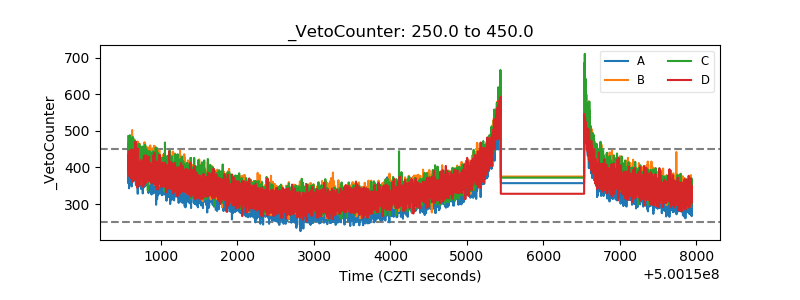 |