| Param | Original file | Final file |
|---|---|---|
| Filename | modeM0/AS1A14_066T07_9000006522_54693cztM0_level2.fits | modeM0/AS1A14_066T07_9000006522_54693cztM0_level2_quad_clean.evt |
| Size (bytes) | 612,849,600 | 94,173,120 |
| Size | 584.5 MB | 89.8 MB |
| Events in quadrant A | 4,442,001 | 650,754 |
| Events in quadrant B | 3,900,695 | 694,808 |
| Events in quadrant C | 3,856,461 | 613,485 |
| Events in quadrant D | 9,953,505 | 414,182 |
| Mode M9 | |||
|---|---|---|---|
| Quadrant | BADHDUFLAG | Total packets | Discarded packets |
| A | 0 | 8 | 0 |
| B | 0 | 9 | 0 |
| C | 0 | 9 | 0 |
| D | 0 | 9 | 0 |
| Mode M0 | |||
|---|---|---|---|
| Quadrant | BADHDUFLAG | Total packets | Discarded packets |
| A | 0 | 17938 | 2 |
| B | 0 | 16569 | 4 |
| C | 0 | 16541 | 2 |
| D | 0 | 34371 | 2 |
| Mode SS | |||
|---|---|---|---|
| Quadrant | BADHDUFLAG | Total packets | Discarded packets |
| A | 0 | 138 | 0 |
| B | 0 | 138 | 0 |
| C | 0 | 138 | 0 |
| D | 0 | 138 | 0 |
| Quadrant | Total seconds | Saturated seconds | Saturation percentage |
|---|---|---|---|
| A | 6867 | 234 | 3.407602% |
| B | 6866 | 214 | 3.116807% |
| C | 6866 | 223 | 3.247888% |
| D | 6866 | 2350 | 34.226624% |
Noise dominated data is calculated using 1-second bins in cleaned event files. If a bin has >2000 counts, and if more than 50% of those come from <1% of pixels, then it is considered to be noise-dominated and hence unusable.
| Quadrant | # 1 sec bins | Bins with >0 counts | Bins with >2000 counts | High rate bins dominated by noise | Noise dominated (total time) | Noise dominated (detector-on time) | Marked lightcurve |
|---|---|---|---|---|---|---|---|
| A | 7642 | 6868 | 57 | 57 | 0.75% | 0.83% | 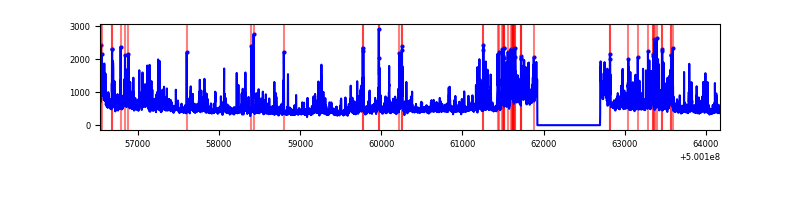 |
| B | 7641 | 6867 | 105 | 105 | 1.37% | 1.53% | 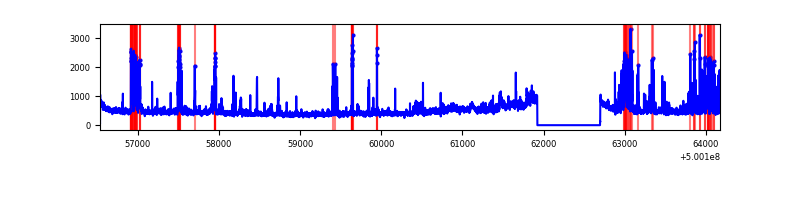 |
| C | 7641 | 6867 | 188 | 188 | 2.46% | 2.74% | 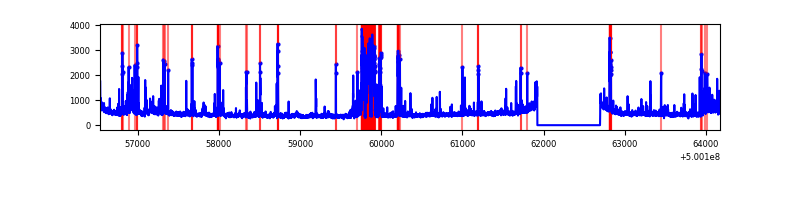 |
| D | 7641 | 6867 | 2175 | 2175 | 28.46% | 31.67% | 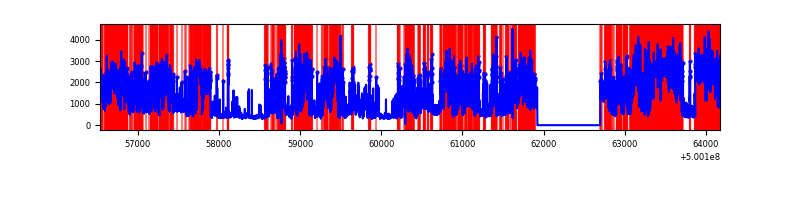 |
Top three noisy pixels from each quadrant. If the there are fewer than three noisy pixels in the level2.evt file, extra rows are filled as -1
| Pixel properties | Quadrant properties | ||||||
|---|---|---|---|---|---|---|---|
| Quadrant | DetID | PixID | Counts | Sigma | Mean | Median | Sigma |
| A | 7 | 190 | 1034878 | 5654.81 | 735 | 716 | 182.9 |
| A | 3 | 14 | 285056 | 1554.78 | 735 | 716 | 182.9 |
| A | 11 | 3 | 111132 | 603.76 | 735 | 716 | 182.9 |
| B | 2 | 249 | 570321 | 3651.35 | 731 | 705 | 156.0 |
| B | 7 | 0 | 196979 | 1258.15 | 731 | 705 | 156.0 |
| B | 10 | 247 | 67330 | 427.08 | 731 | 705 | 156.0 |
| C | 4 | 5 | 448806 | 2274.01 | 715 | 707 | 197.1 |
| C | 13 | 3 | 184055 | 930.45 | 715 | 707 | 197.1 |
| C | 6 | 223 | 116009 | 585.13 | 715 | 707 | 197.1 |
| D | 11 | 129 | 5924269 | 34450.24 | 594 | 567 | 171.9 |
| D | 11 | 176 | 625365 | 3633.61 | 594 | 567 | 171.9 |
| D | 2 | 172 | 254360 | 1475.97 | 594 | 567 | 171.9 |
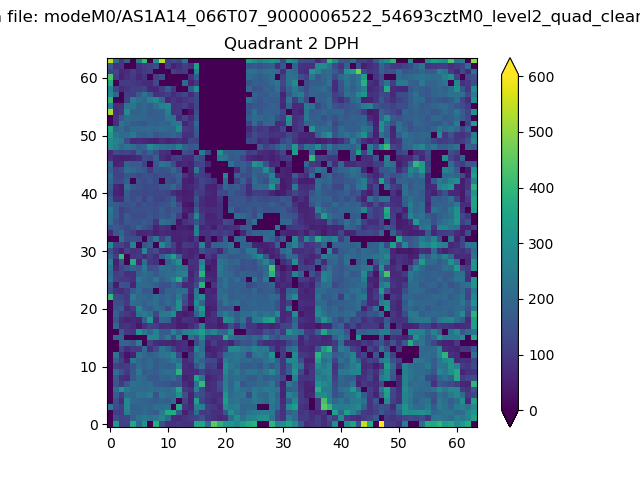
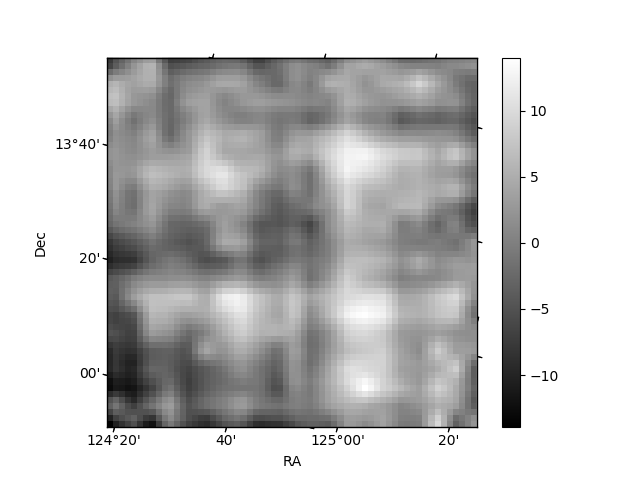
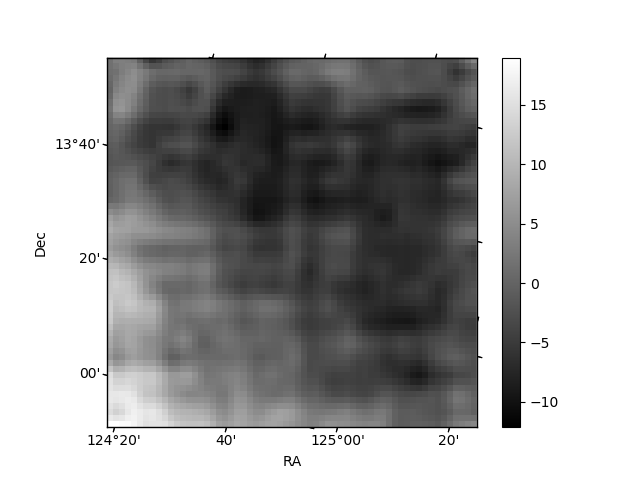
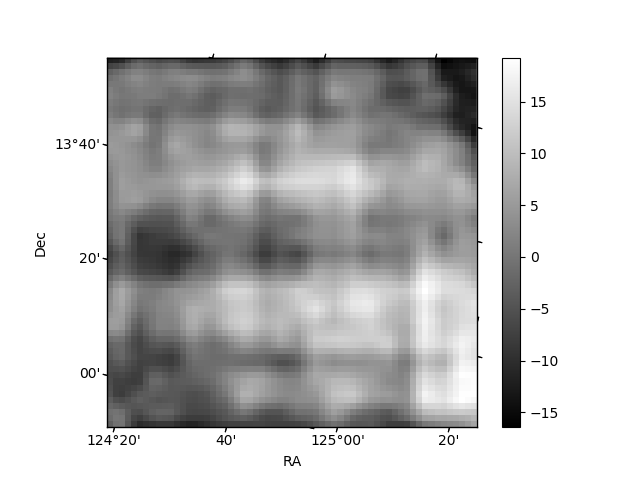
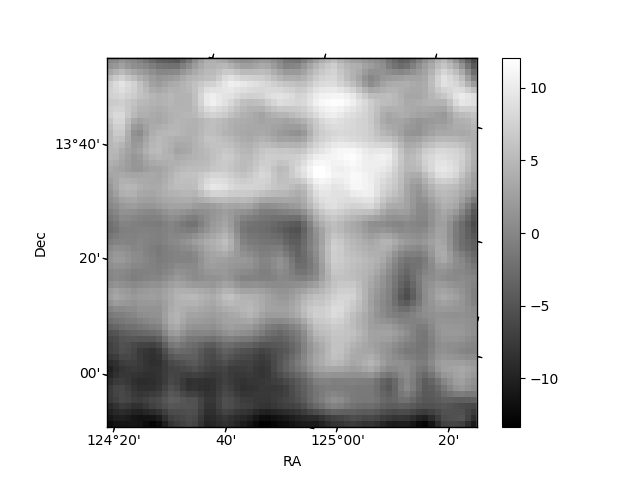
Histogram calculated using DETX and DETY for each event in the final _common_clean file
| Quadrant A | 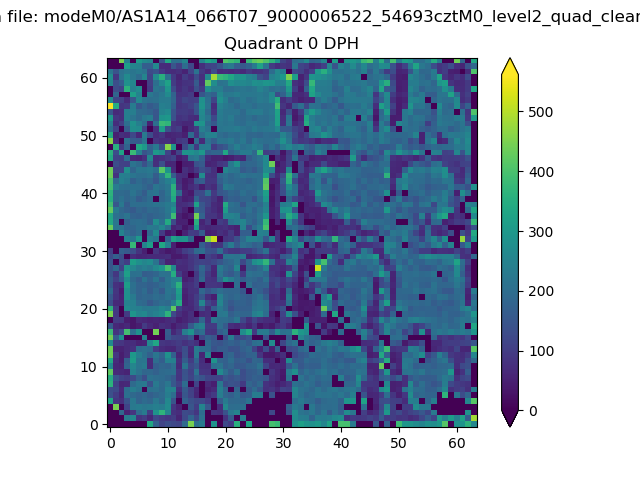 |
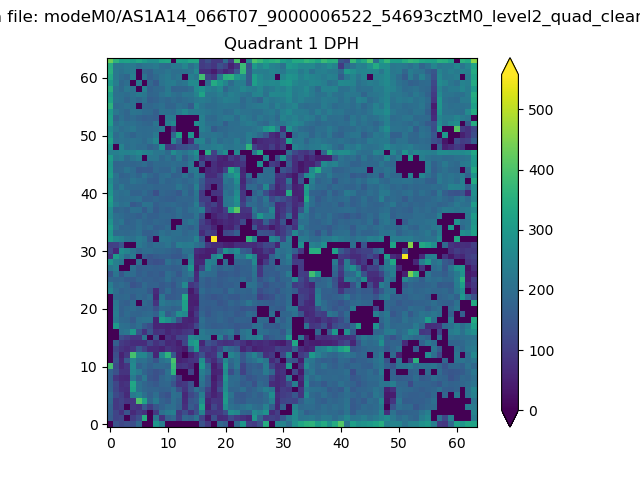 |
Quadrant B |
|---|---|---|---|
| Quadrant D | 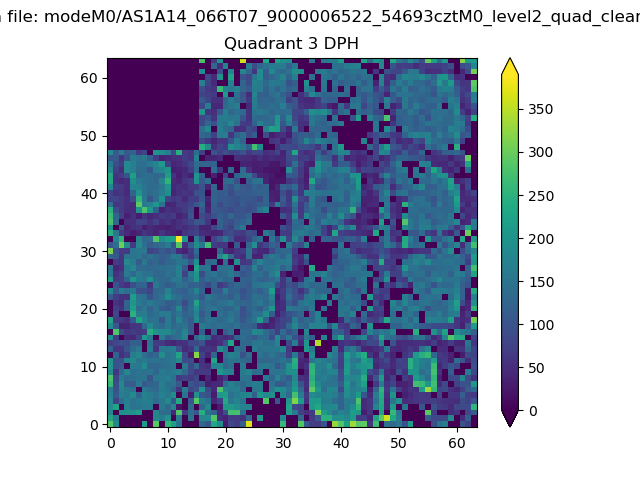 |
 |
Quadrant C |
| Plot type | Count rate plots | Images |
|---|---|---|
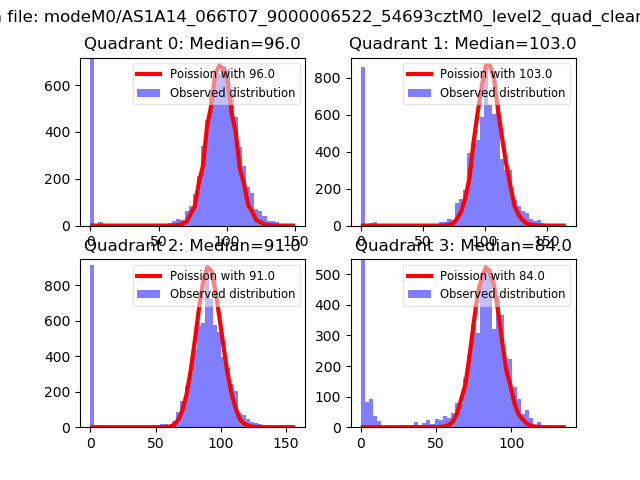
| Comparison with Poisson distribution Blue bars denote a histogram of data divided into 1 sec bins. Red curve is a Poisson curve with rate = median count rate of data. |
 |
 |
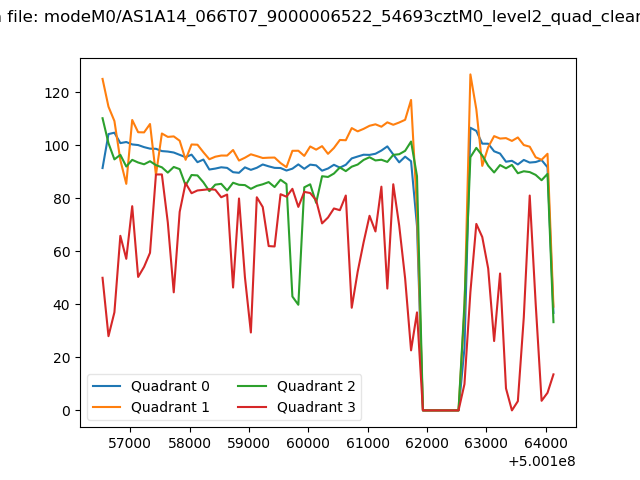
| Quadrant-wise count rates Data is divided into 100 sec bins |
 |
|
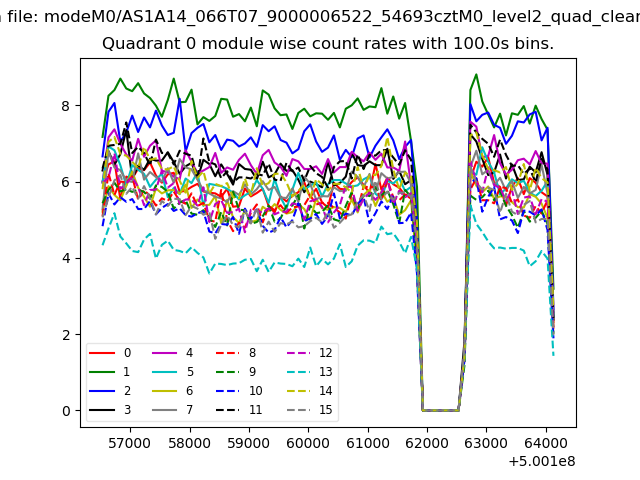
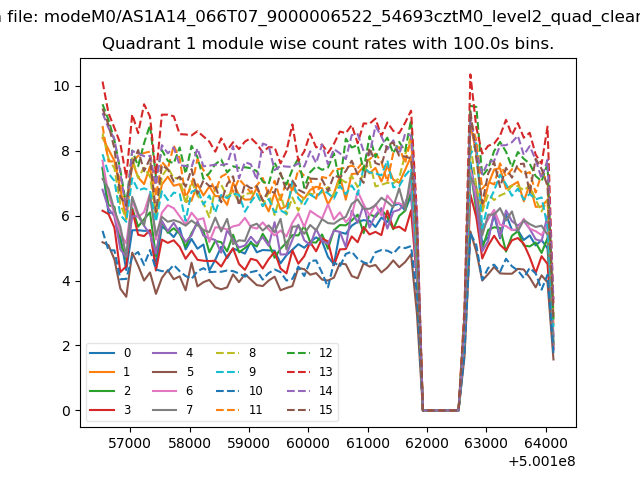
| Module-wise count rates for Quadrant A Data is divided into 100 sec bins |
 |
 |
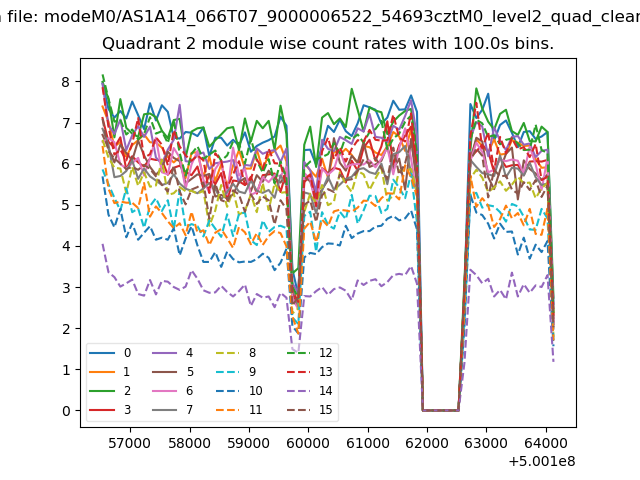
| Module-wise count rates for Quadrant B Data is divided into 100 sec bins |
 |
 |
| Module-wise count rates for Quadrant C Data is divided into 100 sec bins |
 |
 |
| Module-wise count rates for Quadrant D Data is divided into 100 sec bins |
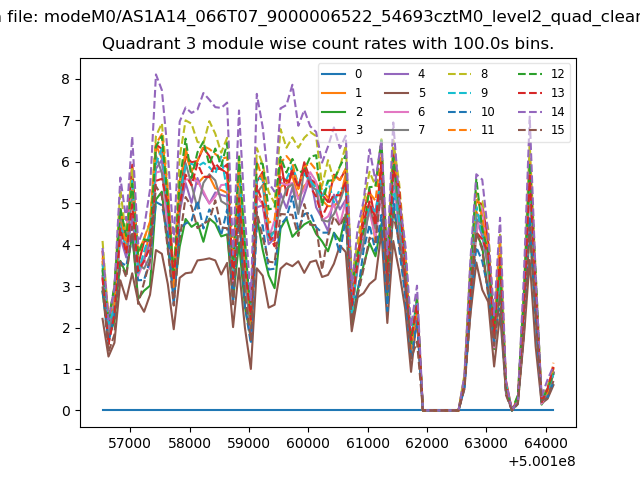 |
 |
| Parameter | Plot |
|---|---|
| CZT HV Monitor | 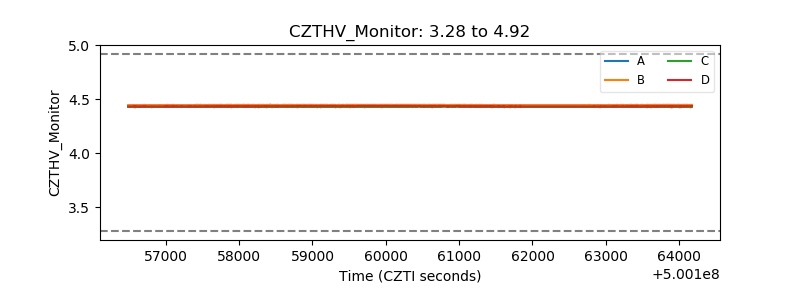 |
| D_VDD | 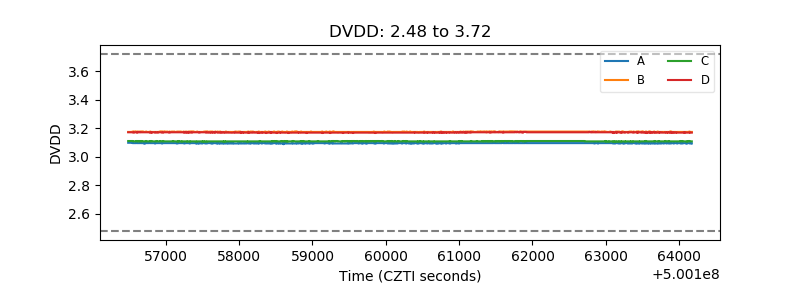 |
| Temperature 1 | 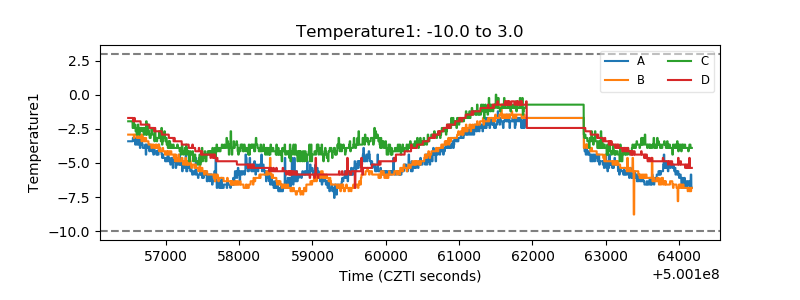 |
| Veto HV Monitor | 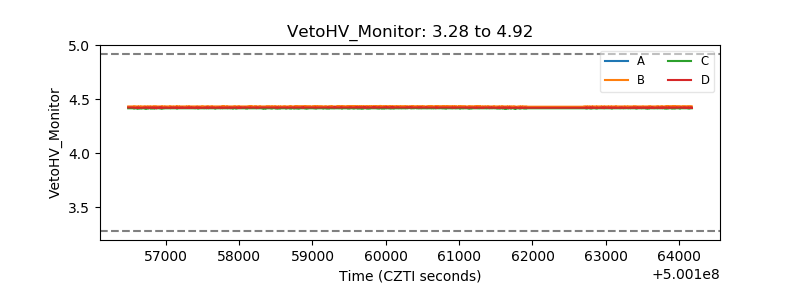 |
| Veto LLD | 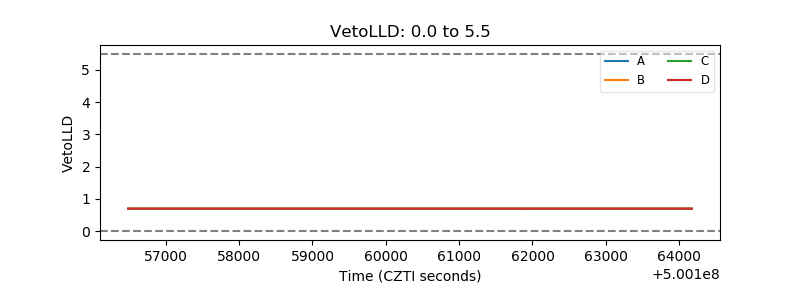 |
| Alpha Counter | 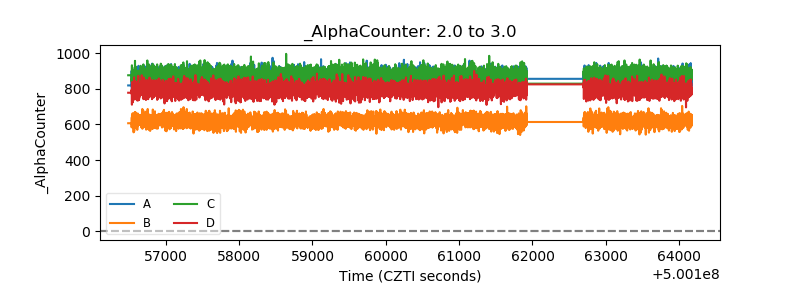 |
| _CPM_Rate | 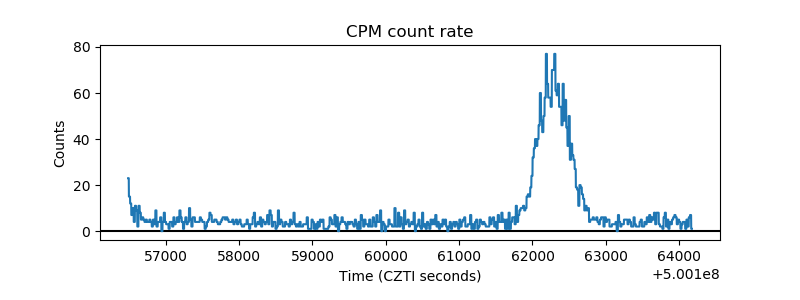 |
| CZT Counter | 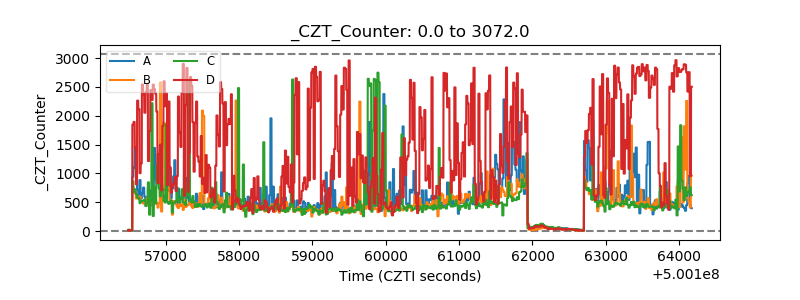 |
| +2.5 Volts monitor | 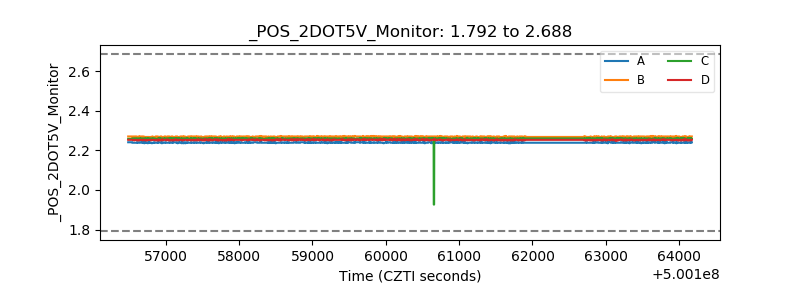 |
| +5 Volts monitor | 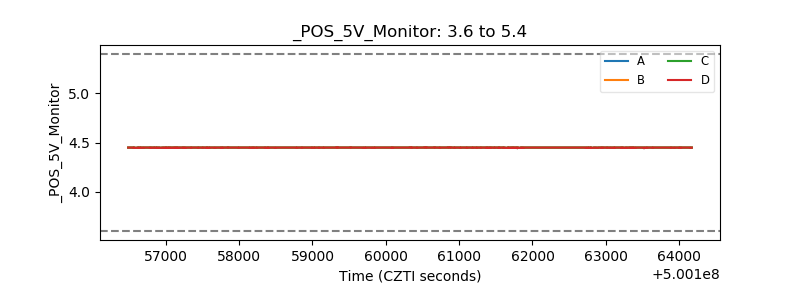 |
| _ROLL_ROT | 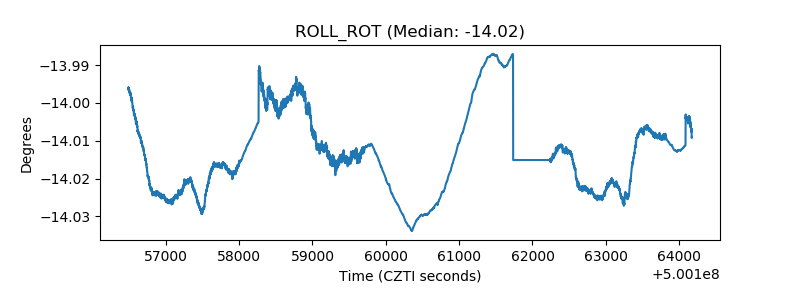 |
| _Roll_DEC | 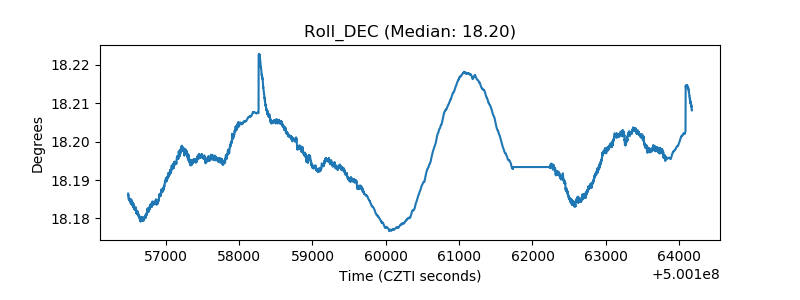 |
| _Roll_RA | 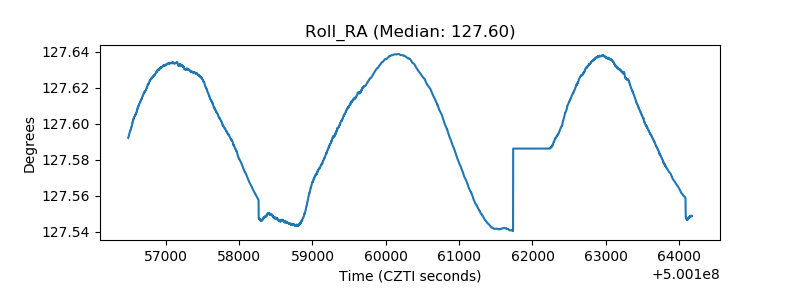 |
| Veto Counter | 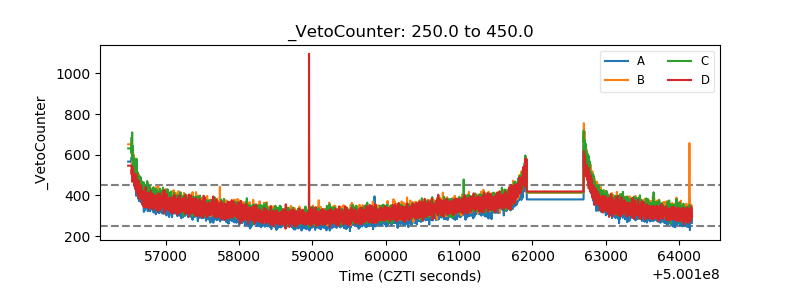 |