| Param | Original file | Final file |
|---|---|---|
| Filename | modeM0/AS1A14_066T07_9000006522_54694cztM0_level2.fits | modeM0/AS1A14_066T07_9000006522_54694cztM0_level2_quad_clean.evt |
| Size (bytes) | 731,638,080 | 103,345,920 |
| Size | 697.7 MB | 98.6 MB |
| Events in quadrant A | 4,990,939 | 731,298 |
| Events in quadrant B | 5,111,011 | 757,586 |
| Events in quadrant C | 3,970,226 | 700,053 |
| Events in quadrant D | 12,412,787 | 403,854 |
| Mode M9 | |||
|---|---|---|---|
| Quadrant | BADHDUFLAG | Total packets | Discarded packets |
| A | 0 | 4 | 0 |
| B | 0 | 5 | 0 |
| C | 0 | 5 | 0 |
| D | 0 | 5 | 0 |
| Mode M0 | |||
|---|---|---|---|
| Quadrant | BADHDUFLAG | Total packets | Discarded packets |
| A | 0 | 20319 | 1 |
| B | 0 | 20544 | 1 |
| C | 0 | 17639 | 3 |
| D | 0 | 42174 | 1 |
| Mode SS | |||
|---|---|---|---|
| Quadrant | BADHDUFLAG | Total packets | Discarded packets |
| A | 0 | 154 | 0 |
| B | 0 | 154 | 0 |
| C | 0 | 154 | 0 |
| D | 0 | 154 | 0 |
| Quadrant | Total seconds | Saturated seconds | Saturation percentage |
|---|---|---|---|
| A | 7711 | 234 | 3.034626% |
| B | 7711 | 484 | 6.276748% |
| C | 7710 | 104 | 1.348898% |
| D | 7710 | 3247 | 42.114137% |
Noise dominated data is calculated using 1-second bins in cleaned event files. If a bin has >2000 counts, and if more than 50% of those come from <1% of pixels, then it is considered to be noise-dominated and hence unusable.
| Quadrant | # 1 sec bins | Bins with >0 counts | Bins with >2000 counts | High rate bins dominated by noise | Noise dominated (total time) | Noise dominated (detector-on time) | Marked lightcurve |
|---|---|---|---|---|---|---|---|
| A | 7711 | 7711 | 100 | 100 | 1.30% | 1.30% | 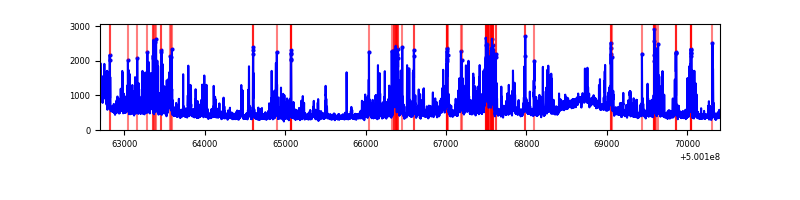 |
| B | 7711 | 7711 | 191 | 191 | 2.48% | 2.48% | 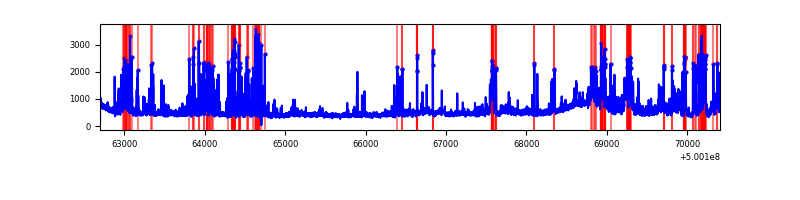 |
| C | 7710 | 7710 | 64 | 64 | 0.83% | 0.83% | 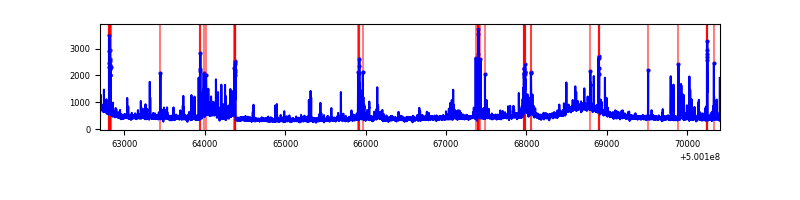 |
| D | 7710 | 7710 | 2965 | 2965 | 38.46% | 38.46% | 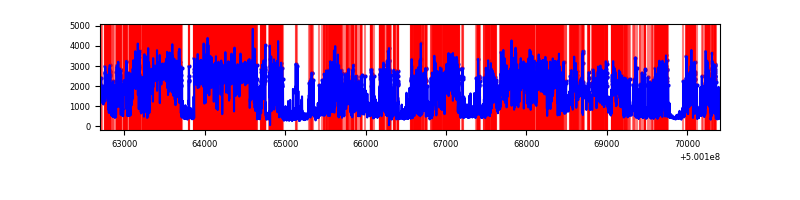 |
Top three noisy pixels from each quadrant. If the there are fewer than three noisy pixels in the level2.evt file, extra rows are filled as -1
| Pixel properties | Quadrant properties | ||||||
|---|---|---|---|---|---|---|---|
| Quadrant | DetID | PixID | Counts | Sigma | Mean | Median | Sigma |
| A | 7 | 190 | 1342019 | 6338.87 | 853 | 829 | 211.6 |
| A | 3 | 14 | 148891 | 699.79 | 853 | 829 | 211.6 |
| A | 4 | 3 | 61709 | 287.74 | 853 | 829 | 211.6 |
| B | 2 | 249 | 1314433 | 7255.62 | 839 | 809 | 181.0 |
| B | 7 | 0 | 139462 | 765.83 | 839 | 809 | 181.0 |
| B | 0 | 213 | 129034 | 708.23 | 839 | 809 | 181.0 |
| C | 13 | 3 | 269745 | 1161.75 | 836 | 830 | 231.5 |
| C | 14 | 254 | 92676 | 396.79 | 836 | 830 | 231.5 |
| C | 15 | 158 | 88935 | 380.62 | 836 | 830 | 231.5 |
| D | 11 | 129 | 8536280 | 45415.29 | 655 | 626 | 187.9 |
| D | 2 | 172 | 519989 | 2763.35 | 655 | 626 | 187.9 |
| D | 15 | 94 | 224614 | 1191.76 | 655 | 626 | 187.9 |
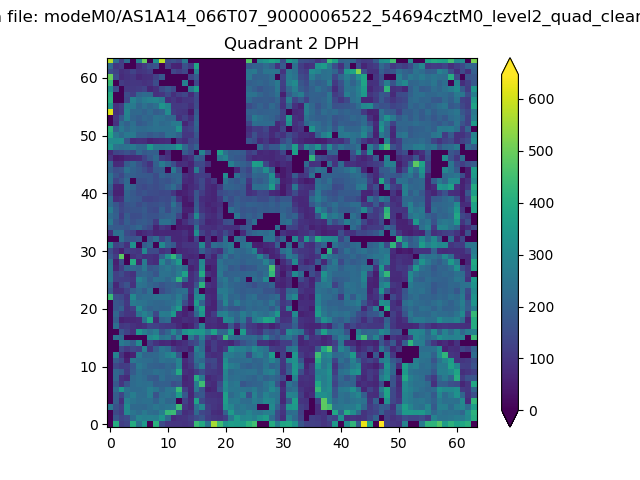
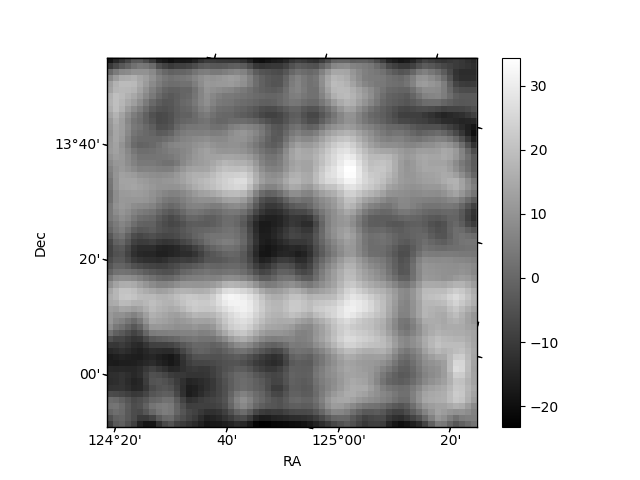
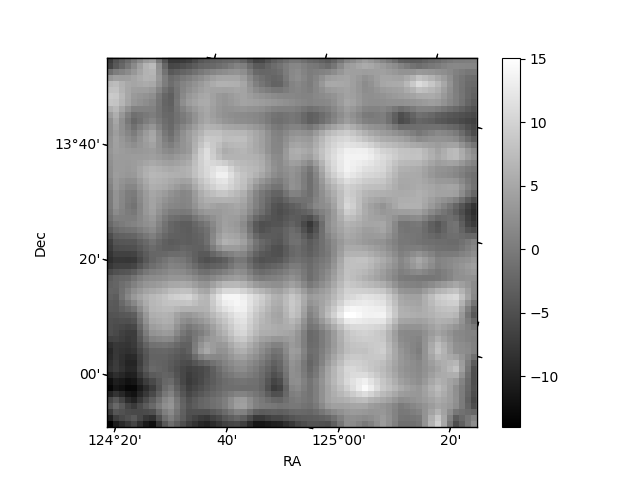
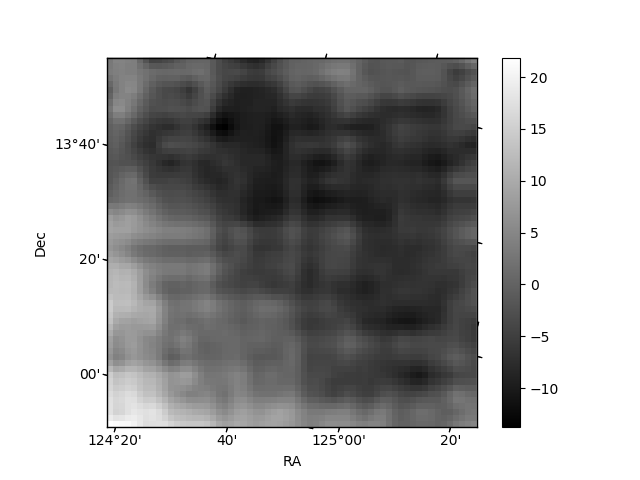
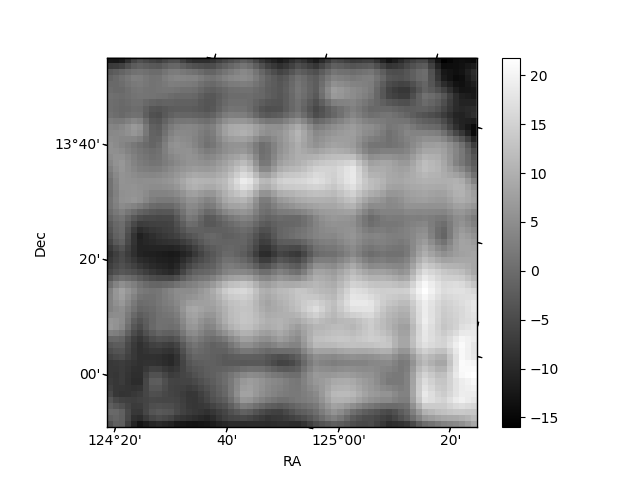
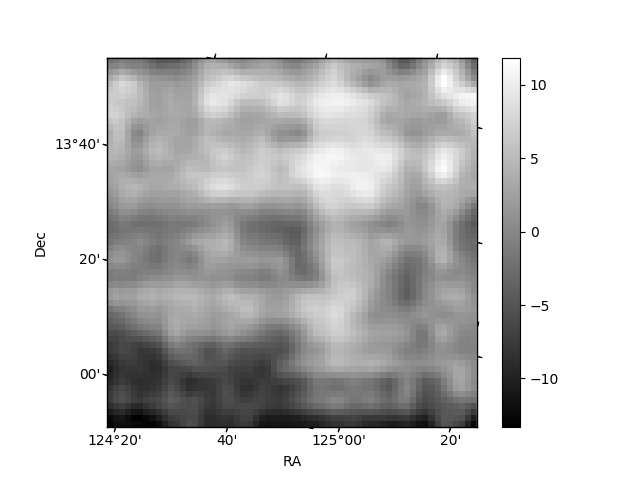
Histogram calculated using DETX and DETY for each event in the final _common_clean file
| Quadrant A | 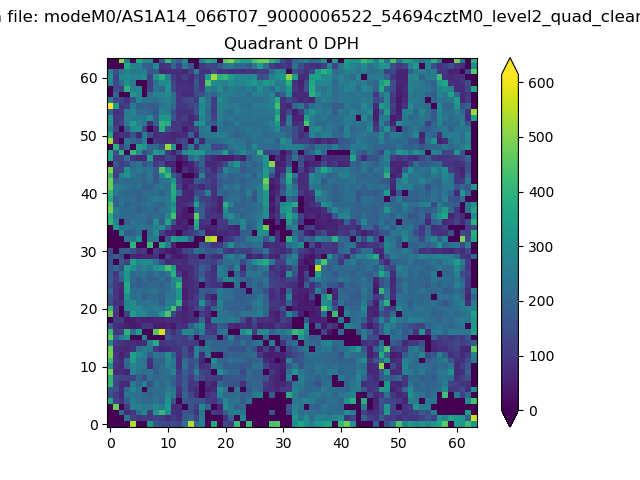 |
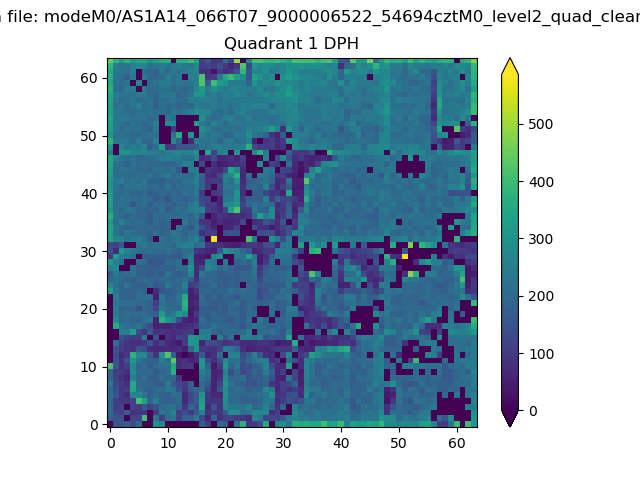 |
Quadrant B |
|---|---|---|---|
| Quadrant D | 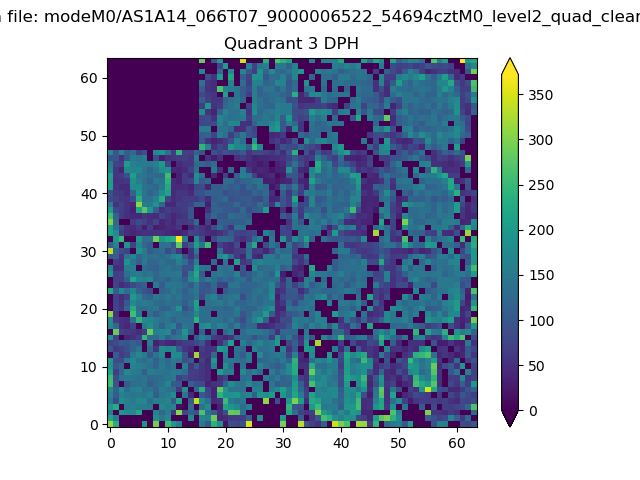 |
 |
Quadrant C |
| Plot type | Count rate plots | Images |
|---|---|---|
| Comparison with Poisson distribution Blue bars denote a histogram of data divided into 1 sec bins. Red curve is a Poisson curve with rate = median count rate of data. |
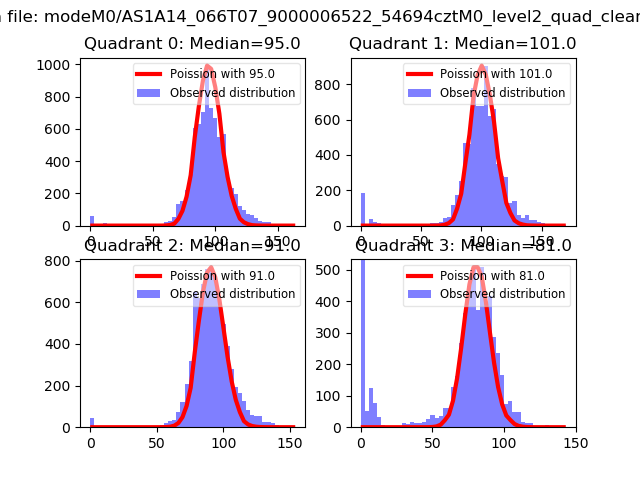 |
 |
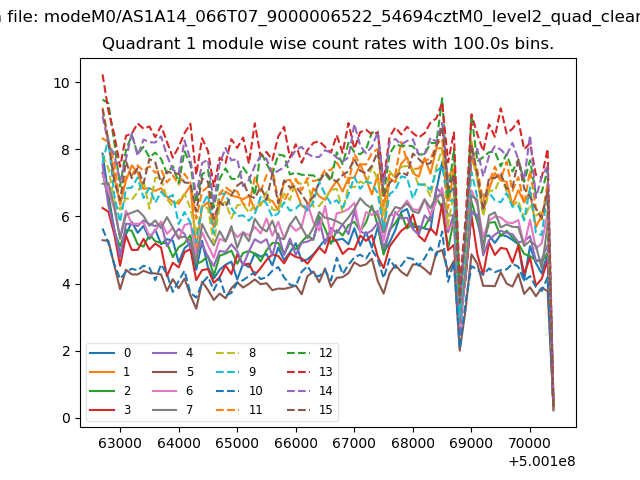
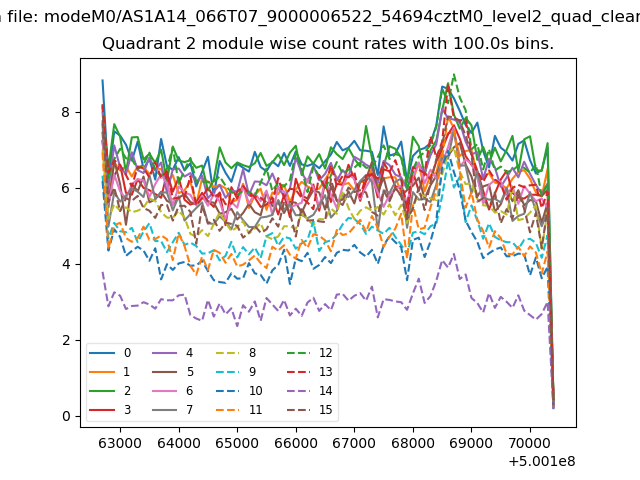
| Quadrant-wise count rates Data is divided into 100 sec bins |
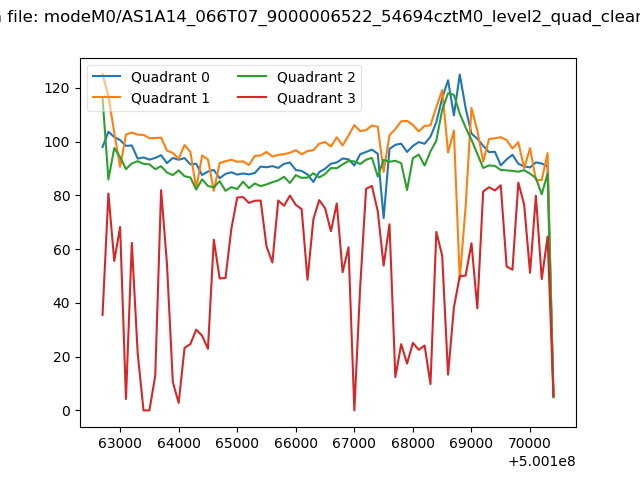 |
|
| Module-wise count rates for Quadrant A Data is divided into 100 sec bins |
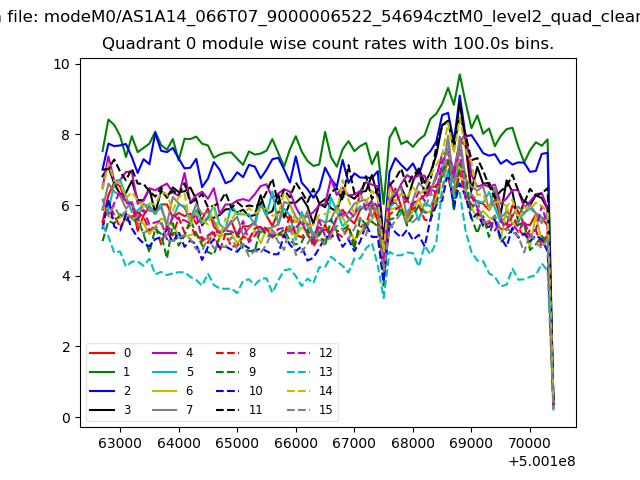 |
 |
| Module-wise count rates for Quadrant B Data is divided into 100 sec bins |
 |
 |
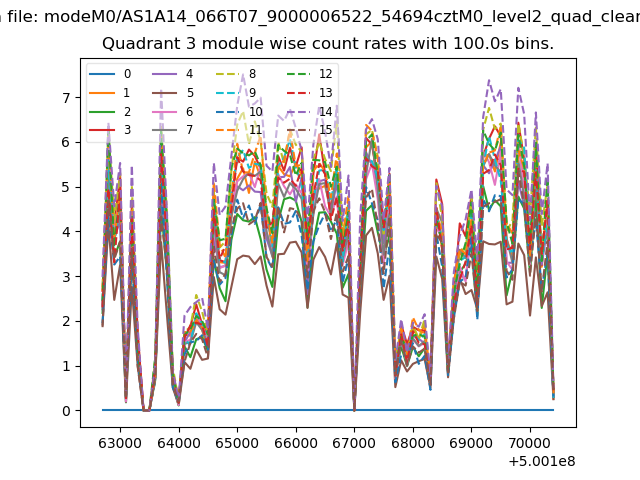
| Module-wise count rates for Quadrant C Data is divided into 100 sec bins |
 |
 |
| Module-wise count rates for Quadrant D Data is divided into 100 sec bins |
 |
 |
| Parameter | Plot |
|---|---|
| CZT HV Monitor | 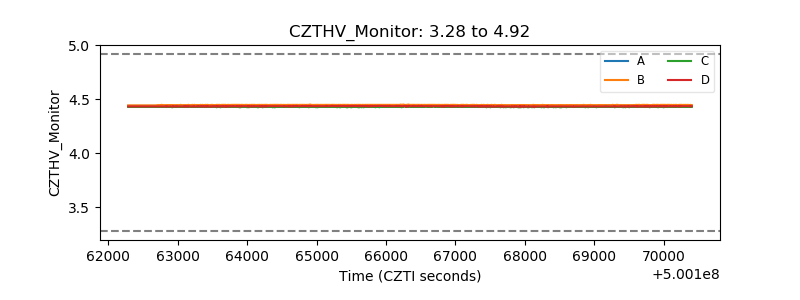 |
| D_VDD | 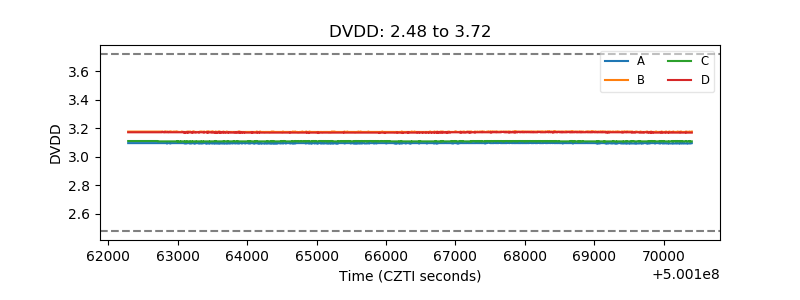 |
| Temperature 1 | 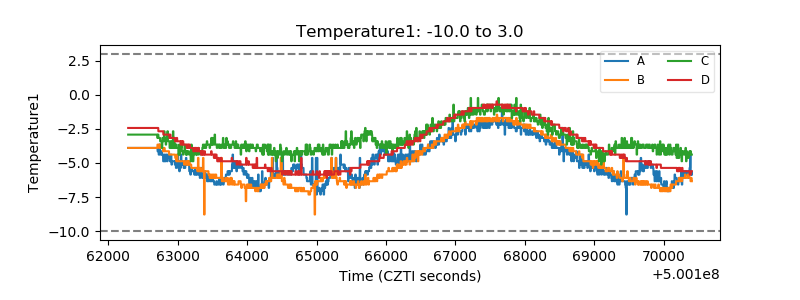 |
| Veto HV Monitor | 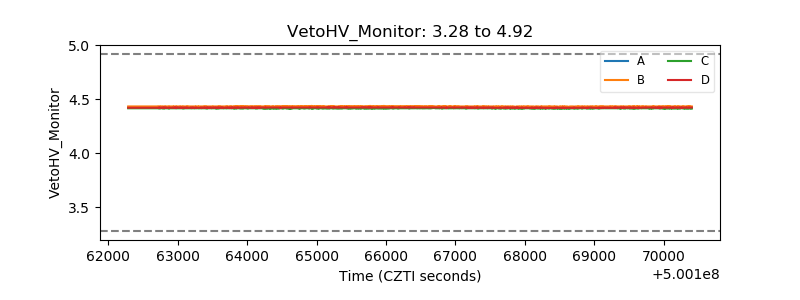 |
| Veto LLD | 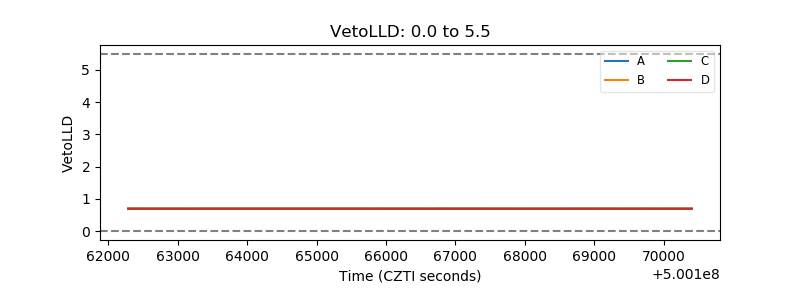 |
| Alpha Counter | 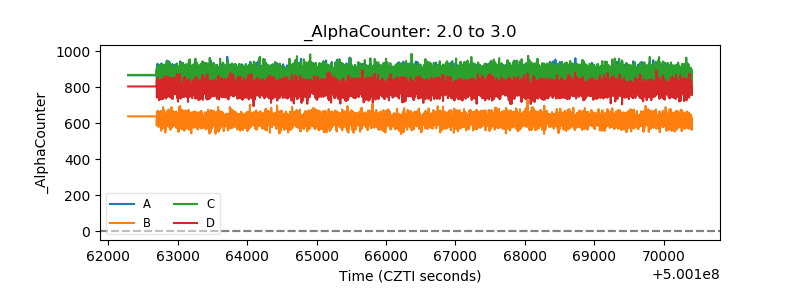 |
| _CPM_Rate | 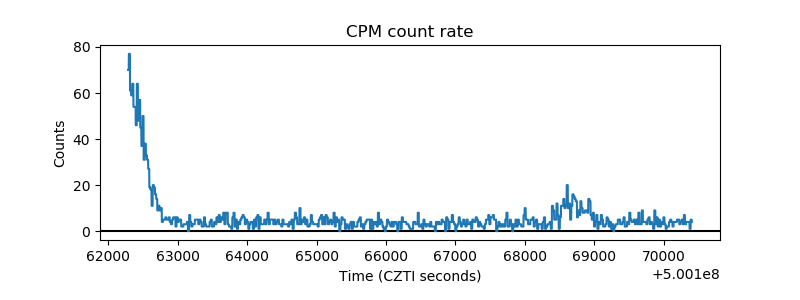 |
| CZT Counter | 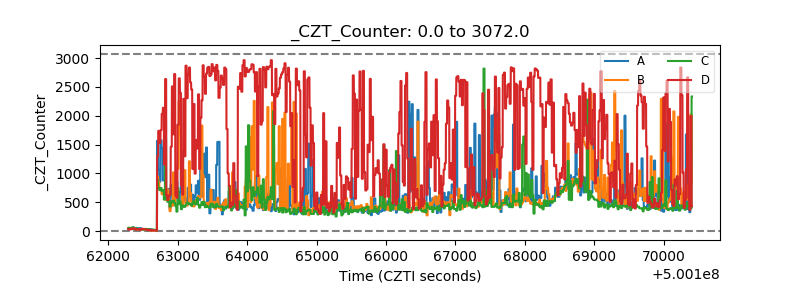 |
| +2.5 Volts monitor |  |
| +5 Volts monitor | 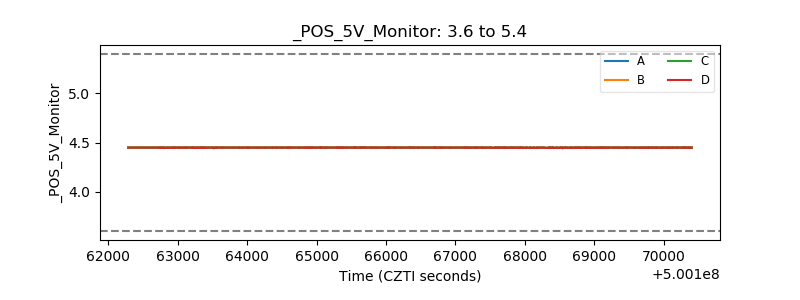 |
| _ROLL_ROT | 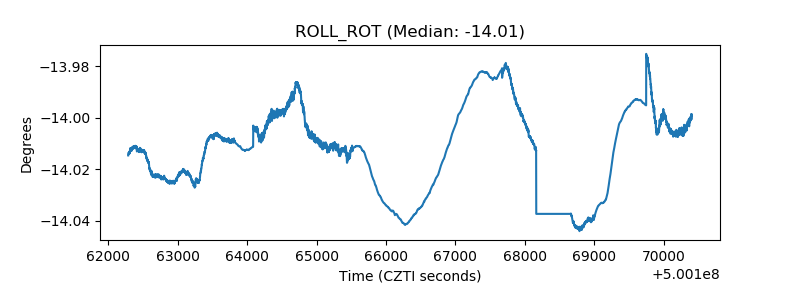 |
| _Roll_DEC | 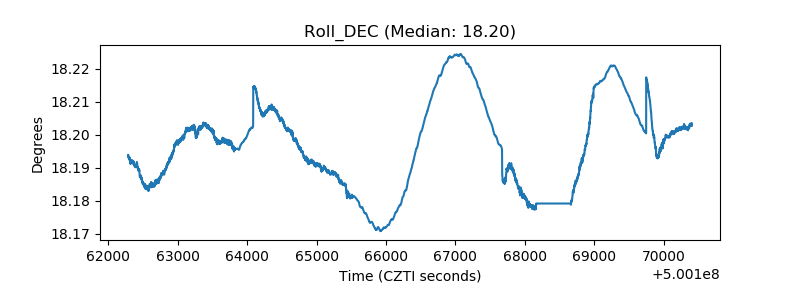 |
| _Roll_RA | 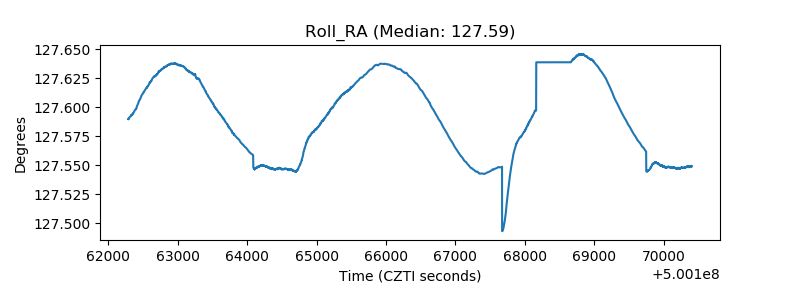 |
| Veto Counter | 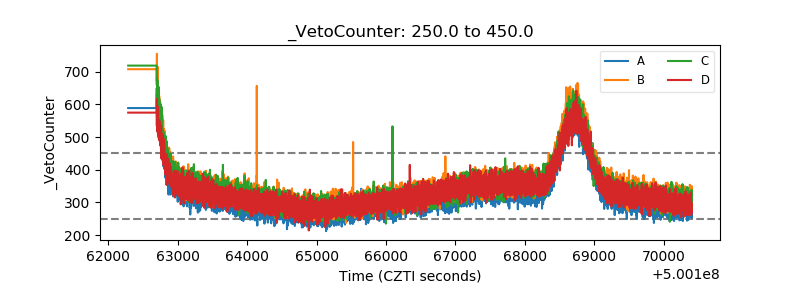 |