| Param | Original file | Final file |
|---|---|---|
| Filename | modeM0/AS1A14_066T07_9000006522_54695cztM0_level2.fits | modeM0/AS1A14_066T07_9000006522_54695cztM0_level2_quad_clean.evt |
| Size (bytes) | 747,480,960 | 98,979,840 |
| Size | 712.9 MB | 94.4 MB |
| Events in quadrant A | 5,252,411 | 656,497 |
| Events in quadrant B | 7,436,540 | 685,059 |
| Events in quadrant C | 4,355,015 | 615,206 |
| Events in quadrant D | 9,977,893 | 458,984 |
| Mode M0 | |||
|---|---|---|---|
| Quadrant | BADHDUFLAG | Total packets | Discarded packets |
| A | 0 | 21826 | 0 |
| B | 0 | 27808 | 0 |
| C | 0 | 19144 | 0 |
| D | 0 | 35524 | 0 |
| Mode SS | |||
|---|---|---|---|
| Quadrant | BADHDUFLAG | Total packets | Discarded packets |
| A | 0 | 168 | 0 |
| B | 0 | 168 | 0 |
| C | 0 | 168 | 0 |
| D | 0 | 168 | 0 |
| Quadrant | Total seconds | Saturated seconds | Saturation percentage |
|---|---|---|---|
| A | 8355 | 413 | 4.943148% |
| B | 8356 | 907 | 10.854476% |
| C | 8356 | 141 | 1.687410% |
| D | 8356 | 1967 | 23.539971% |
Noise dominated data is calculated using 1-second bins in cleaned event files. If a bin has >2000 counts, and if more than 50% of those come from <1% of pixels, then it is considered to be noise-dominated and hence unusable.
| Quadrant | # 1 sec bins | Bins with >0 counts | Bins with >2000 counts | High rate bins dominated by noise | Noise dominated (total time) | Noise dominated (detector-on time) | Marked lightcurve |
|---|---|---|---|---|---|---|---|
| A | 8630 | 8630 | 294 | 294 | 3.41% | 3.41% | 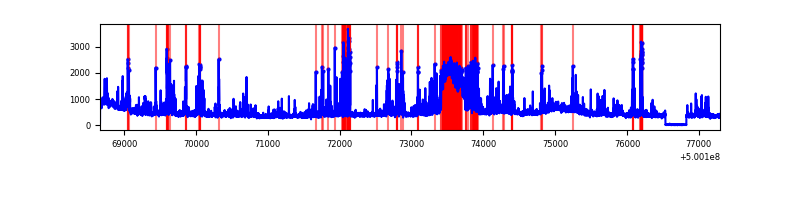 |
| B | 8631 | 8631 | 671 | 671 | 7.77% | 7.77% | 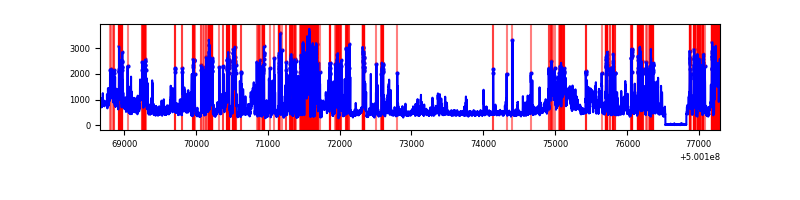 |
| C | 8631 | 8628 | 98 | 98 | 1.14% | 1.14% | 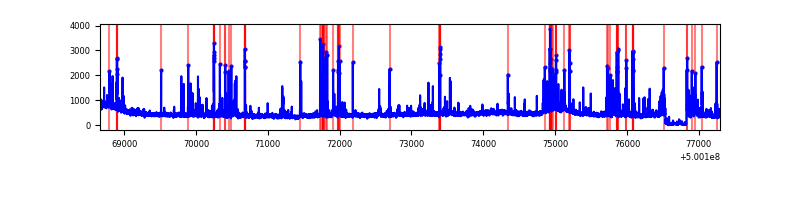 |
| D | 8631 | 8585 | 1726 | 1726 | 20.00% | 20.10% | 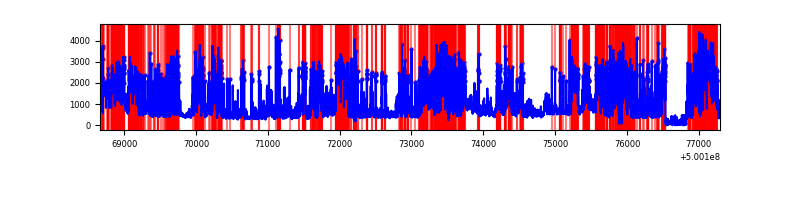 |
Top three noisy pixels from each quadrant. If the there are fewer than three noisy pixels in the level2.evt file, extra rows are filled as -1
| Pixel properties | Quadrant properties | ||||||
|---|---|---|---|---|---|---|---|
| Quadrant | DetID | PixID | Counts | Sigma | Mean | Median | Sigma |
| A | 7 | 190 | 814259 | 3662.19 | 893 | 870 | 222.1 |
| A | 7 | 14 | 501268 | 2252.98 | 893 | 870 | 222.1 |
| A | 11 | 3 | 341806 | 1535.02 | 893 | 870 | 222.1 |
| B | 2 | 249 | 3701078 | 19849.51 | 869 | 837 | 186.4 |
| B | 0 | 213 | 114394 | 609.16 | 869 | 837 | 186.4 |
| B | 7 | 0 | 68914 | 365.19 | 869 | 837 | 186.4 |
| C | 12 | 249 | 266525 | 1100.32 | 876 | 871 | 241.4 |
| C | 6 | 223 | 144165 | 593.52 | 876 | 871 | 241.4 |
| C | 15 | 157 | 139859 | 575.68 | 876 | 871 | 241.4 |
| D | 11 | 129 | 5545364 | 24575.63 | 782 | 748 | 225.6 |
| D | 11 | 176 | 593770 | 2628.47 | 782 | 748 | 225.6 |
| D | 15 | 94 | 249334 | 1101.82 | 782 | 748 | 225.6 |
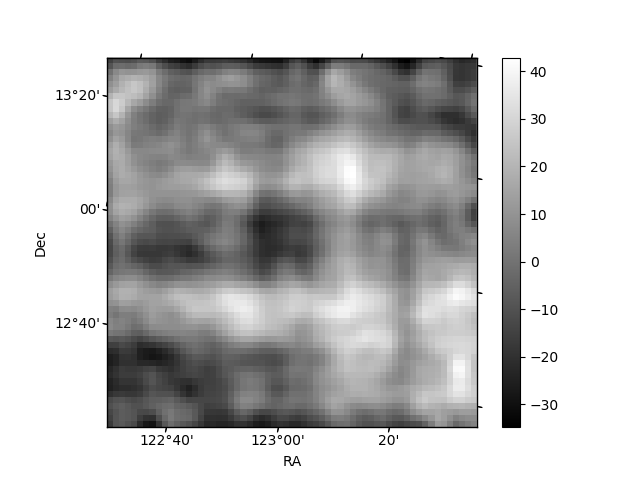
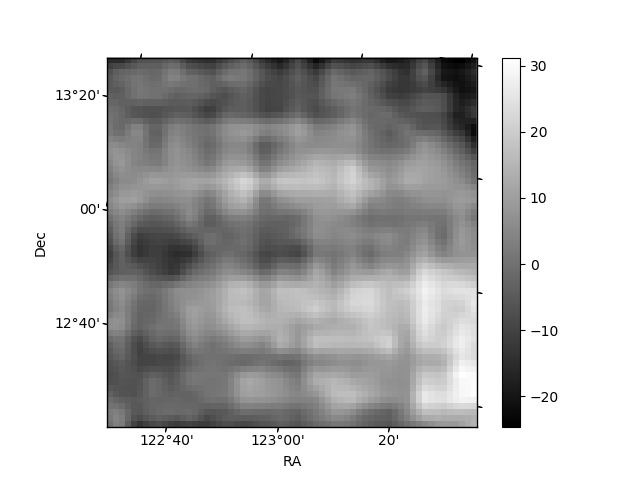
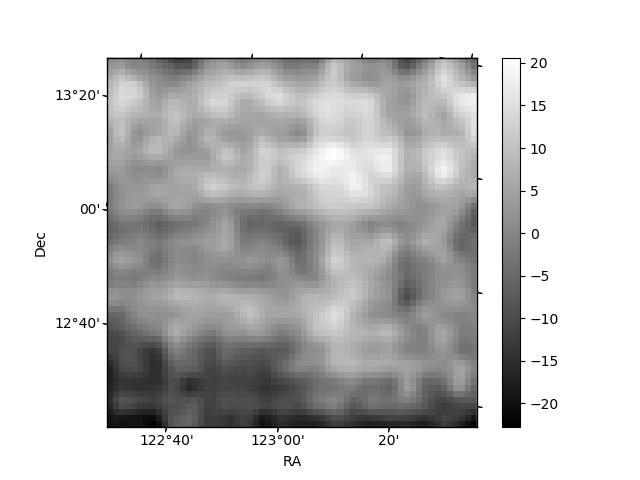
Histogram calculated using DETX and DETY for each event in the final _common_clean file
| Quadrant A | 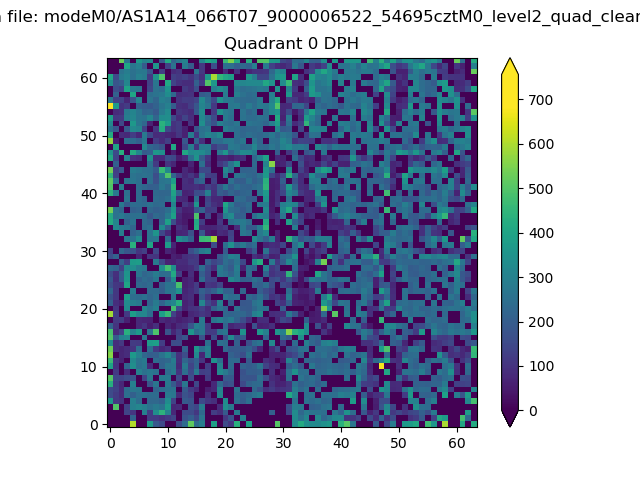 |
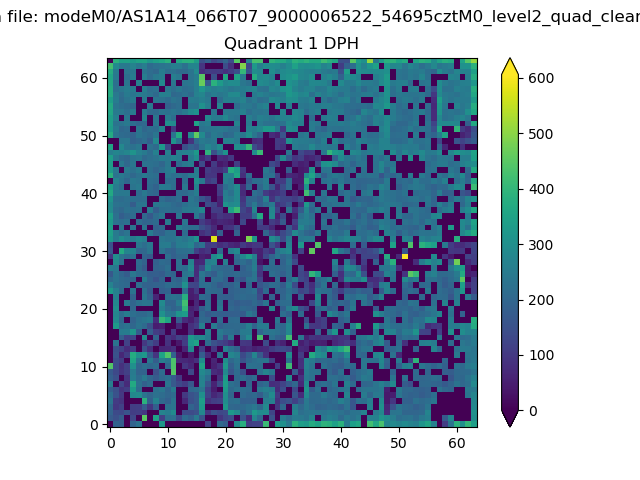 |
Quadrant B |
|---|---|---|---|
| Quadrant D | 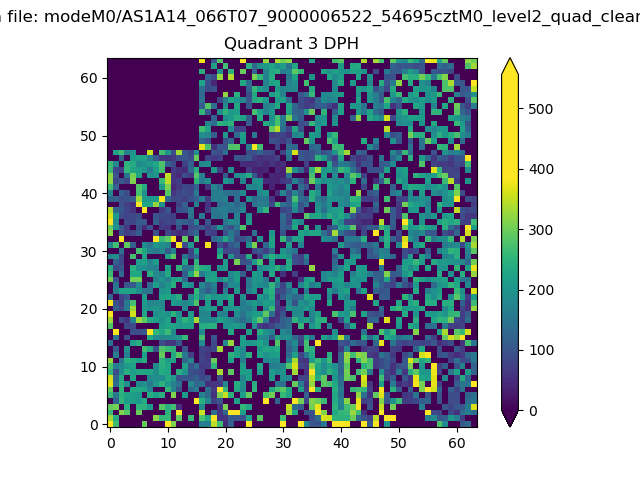 |
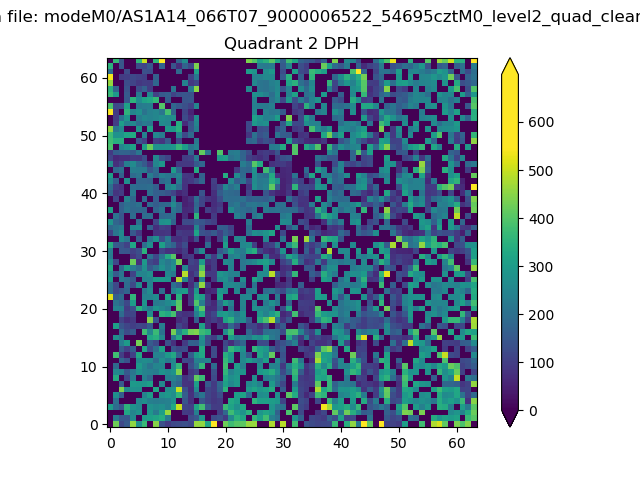 |
Quadrant C |
| Plot type | Count rate plots | Images |
|---|---|---|
| Comparison with Poisson distribution Blue bars denote a histogram of data divided into 1 sec bins. Red curve is a Poisson curve with rate = median count rate of data. |
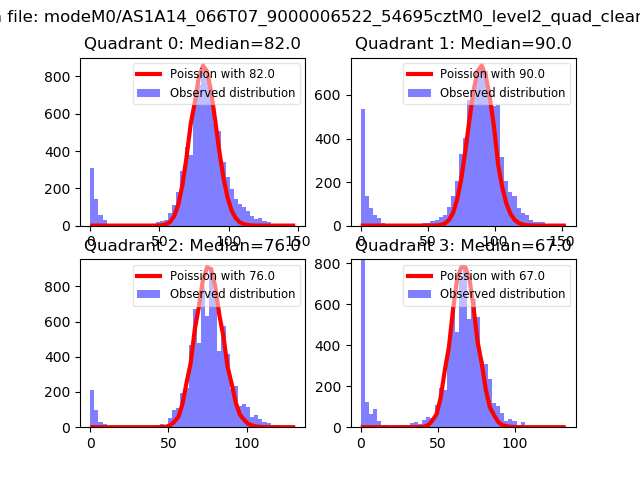 |
 |
| Quadrant-wise count rates Data is divided into 100 sec bins |
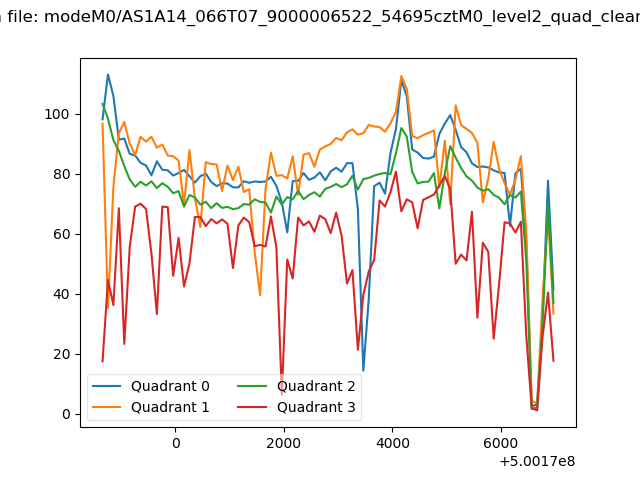 |
|
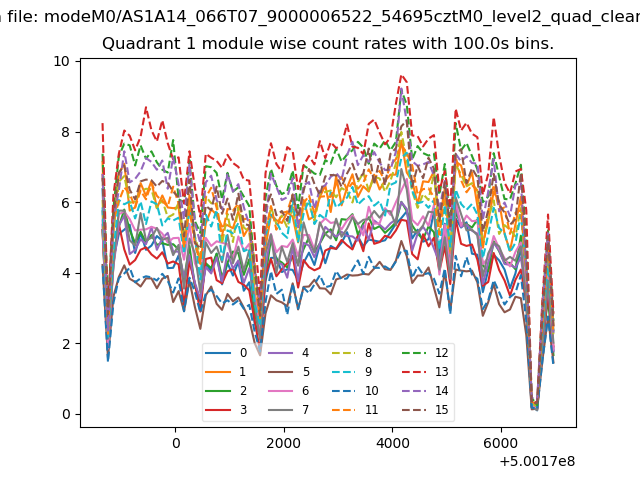
| Module-wise count rates for Quadrant A Data is divided into 100 sec bins |
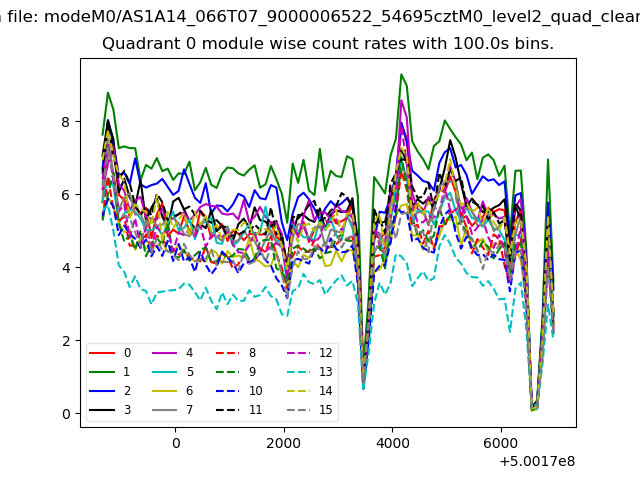 |
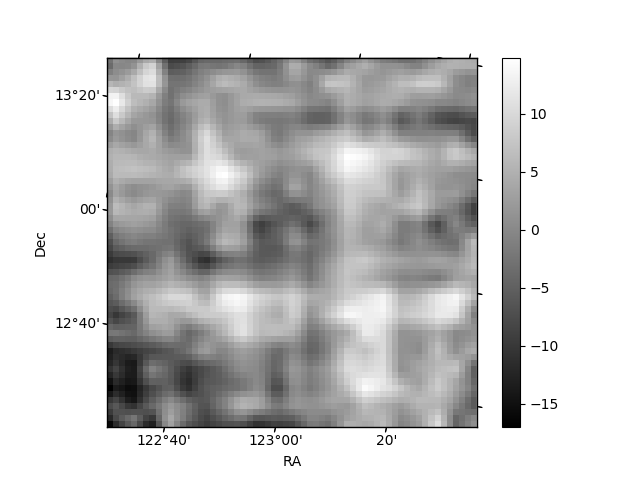 |
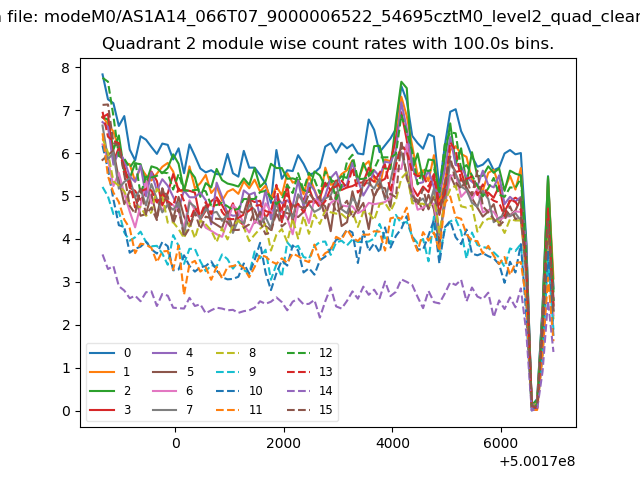
| Module-wise count rates for Quadrant B Data is divided into 100 sec bins |
 |
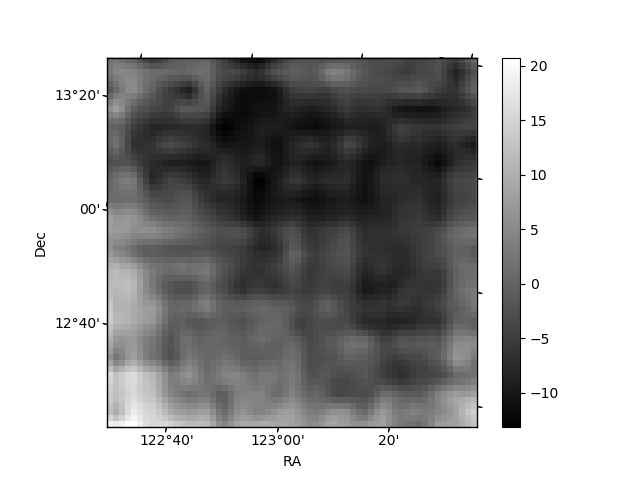 |
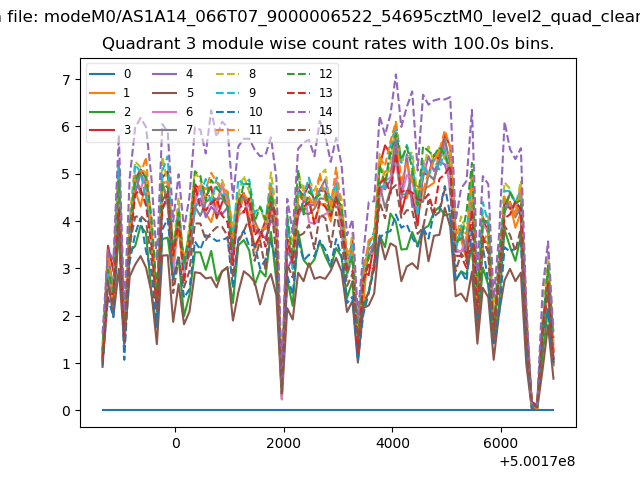
| Module-wise count rates for Quadrant C Data is divided into 100 sec bins |
 |
 |
| Module-wise count rates for Quadrant D Data is divided into 100 sec bins |
 |
 |
| Parameter | Plot |
|---|---|
| CZT HV Monitor | 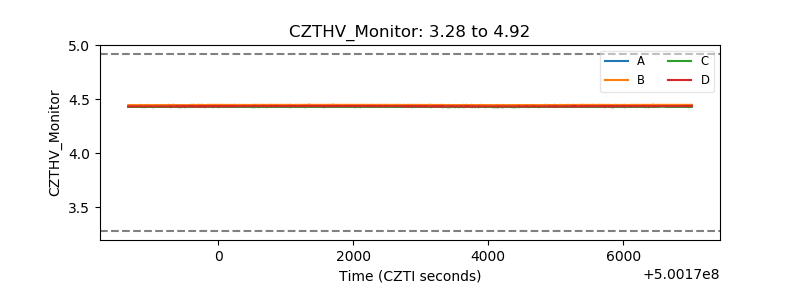 |
| D_VDD | 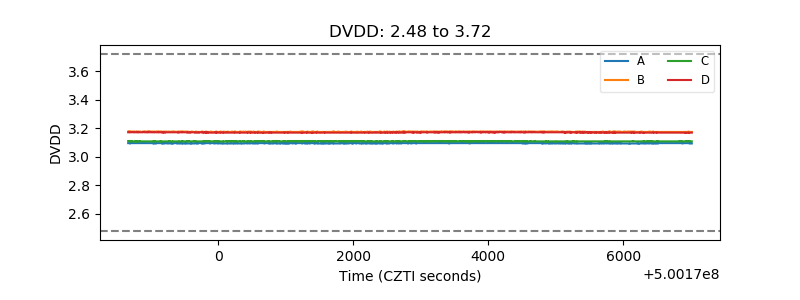 |
| Temperature 1 | 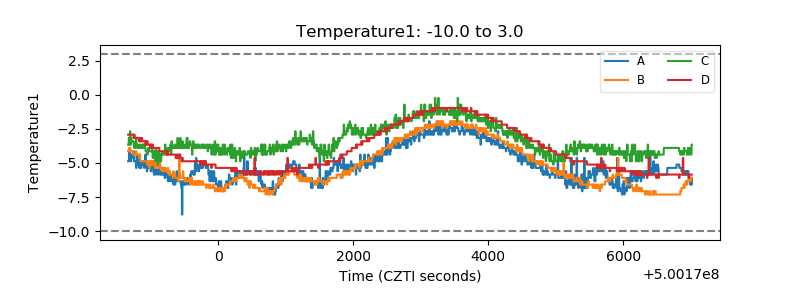 |
| Veto HV Monitor | 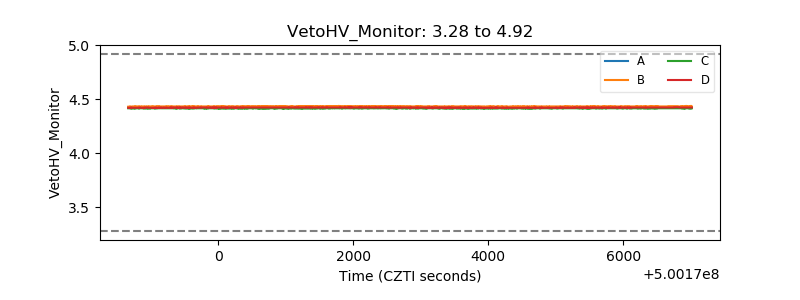 |
| Veto LLD | 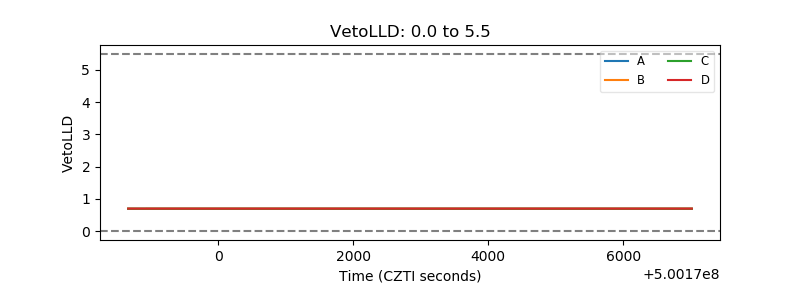 |
| Alpha Counter | 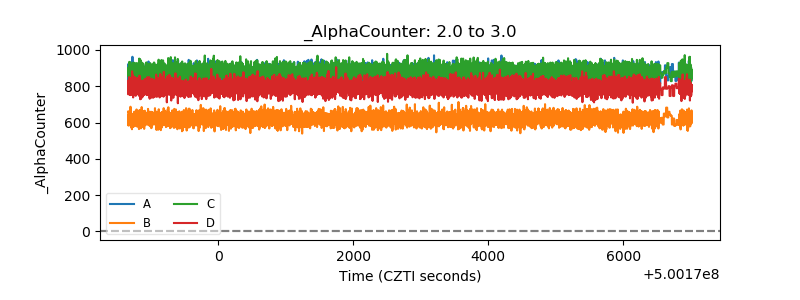 |
| _CPM_Rate | 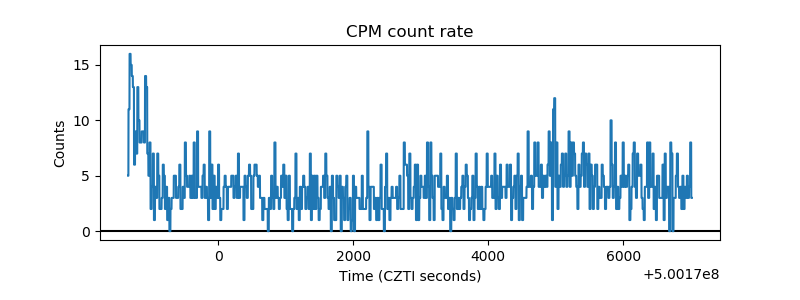 |
| CZT Counter | 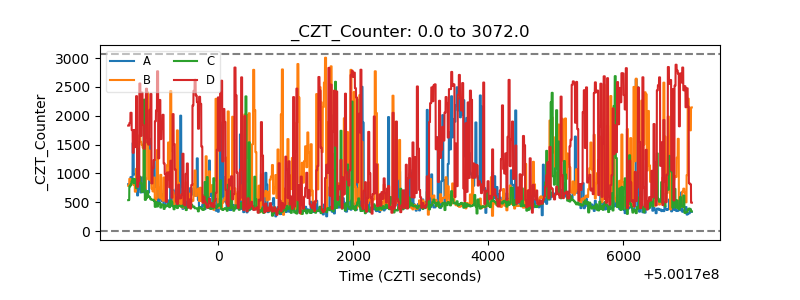 |
| +2.5 Volts monitor |  |
| +5 Volts monitor |  |
| _ROLL_ROT | 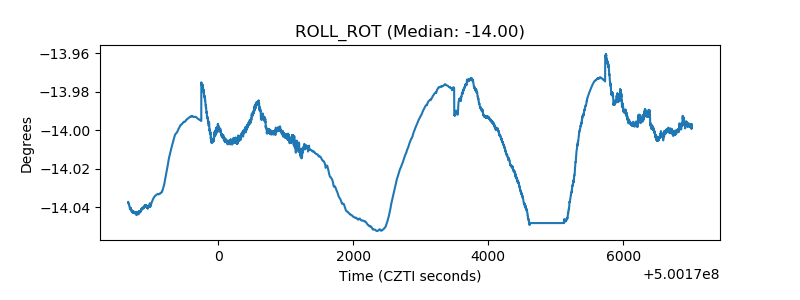 |
| _Roll_DEC | 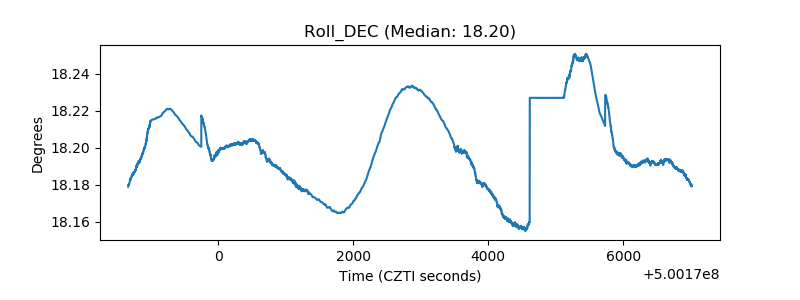 |
| _Roll_RA | 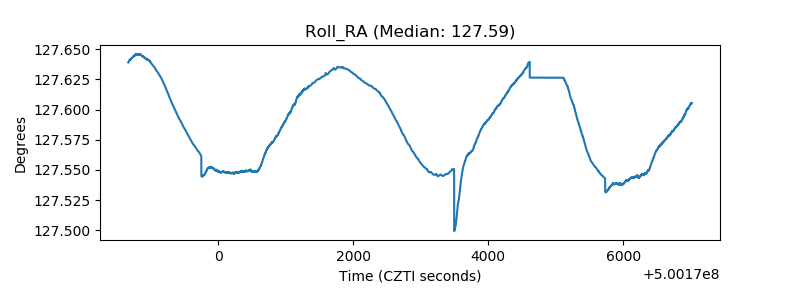 |
| Veto Counter | 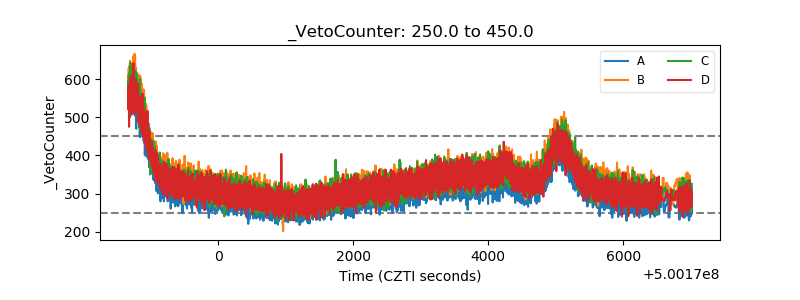 |