| Param | Original file | Final file |
|---|---|---|
| Filename | modeM0/AS1A14_066T07_9000006522_54699cztM0_level2.fits | modeM0/AS1A14_066T07_9000006522_54699cztM0_level2_quad_clean.evt |
| Size (bytes) | 2,045,989,440 | 353,102,400 |
| Size | 1.9 GB | 336.7 MB |
| Events in quadrant A | 14,677,810 | 2,371,063 |
| Events in quadrant B | 22,064,765 | 2,375,955 |
| Events in quadrant C | 14,286,693 | 2,227,644 |
| Events in quadrant D | 22,705,539 | 1,934,018 |
| Mode M9 | |||
|---|---|---|---|
| Quadrant | BADHDUFLAG | Total packets | Discarded packets |
| A | 0 | 9 | 0 |
| B | 0 | 9 | 0 |
| C | 0 | 9 | 0 |
| D | 0 | 9 | 0 |
| Mode M0 | |||
|---|---|---|---|
| Quadrant | BADHDUFLAG | Total packets | Discarded packets |
| A | 0 | 61990 | 3 |
| B | 0 | 83505 | 2 |
| C | 0 | 61439 | 2 |
| D | 0 | 86206 | 2 |
| Mode SS | |||
|---|---|---|---|
| Quadrant | BADHDUFLAG | Total packets | Discarded packets |
| A | 0 | 522 | 0 |
| B | 0 | 522 | 0 |
| C | 0 | 522 | 0 |
| D | 0 | 522 | 0 |
| Quadrant | Total seconds | Saturated seconds | Saturation percentage |
|---|---|---|---|
| A | 25914 | 479 | 1.848422% |
| B | 25914 | 2393 | 9.234391% |
| C | 25914 | 550 | 2.122405% |
| D | 25914 | 3140 | 12.117002% |
Noise dominated data is calculated using 1-second bins in cleaned event files. If a bin has >2000 counts, and if more than 50% of those come from <1% of pixels, then it is considered to be noise-dominated and hence unusable.
| Quadrant | # 1 sec bins | Bins with >0 counts | Bins with >2000 counts | High rate bins dominated by noise | Noise dominated (total time) | Noise dominated (detector-on time) | Marked lightcurve |
|---|---|---|---|---|---|---|---|
| A | 27039 | 26193 | 209 | 209 | 0.77% | 0.80% | 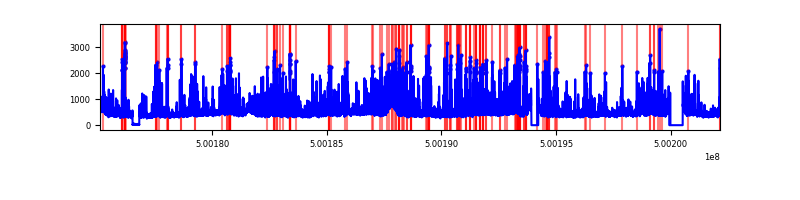 |
| B | 27039 | 26193 | 1645 | 1645 | 6.08% | 6.28% | 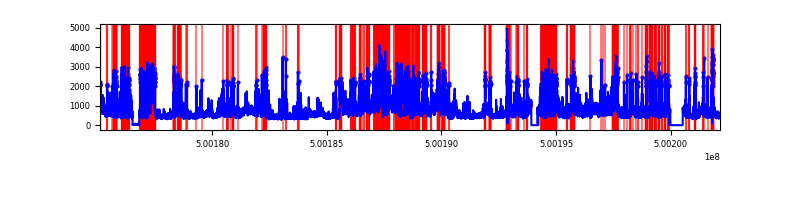 |
| C | 27039 | 26190 | 338 | 338 | 1.25% | 1.29% | 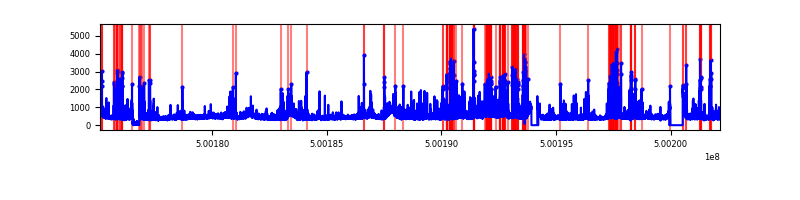 |
| D | 27039 | 26147 | 2856 | 2856 | 10.56% | 10.92% | 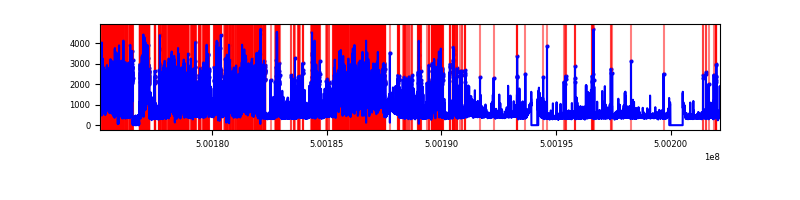 |
Top three noisy pixels from each quadrant. If the there are fewer than three noisy pixels in the level2.evt file, extra rows are filled as -1
| Pixel properties | Quadrant properties | ||||||
|---|---|---|---|---|---|---|---|
| Quadrant | DetID | PixID | Counts | Sigma | Mean | Median | Sigma |
| A | 7 | 190 | 2272619 | 3359.89 | 2728 | 2661 | 675.6 |
| A | 11 | 3 | 839242 | 1238.27 | 2728 | 2661 | 675.6 |
| A | 3 | 14 | 501849 | 738.88 | 2728 | 2661 | 675.6 |
| B | 2 | 249 | 8642264 | 15296.71 | 2631 | 2534 | 564.8 |
| B | 7 | 0 | 2347391 | 4151.59 | 2631 | 2534 | 564.8 |
| B | 0 | 213 | 414156 | 728.78 | 2631 | 2534 | 564.8 |
| C | 15 | 157 | 1578333 | 2188.52 | 2637 | 2620 | 720.0 |
| C | 6 | 223 | 574694 | 794.56 | 2637 | 2620 | 720.0 |
| C | 14 | 254 | 363728 | 501.55 | 2637 | 2620 | 720.0 |
| D | 11 | 129 | 7723490 | 10676.89 | 2535 | 2420 | 723.2 |
| D | 2 | 62 | 1713279 | 2365.82 | 2535 | 2420 | 723.2 |
| D | 3 | 12 | 1168186 | 1612.05 | 2535 | 2420 | 723.2 |
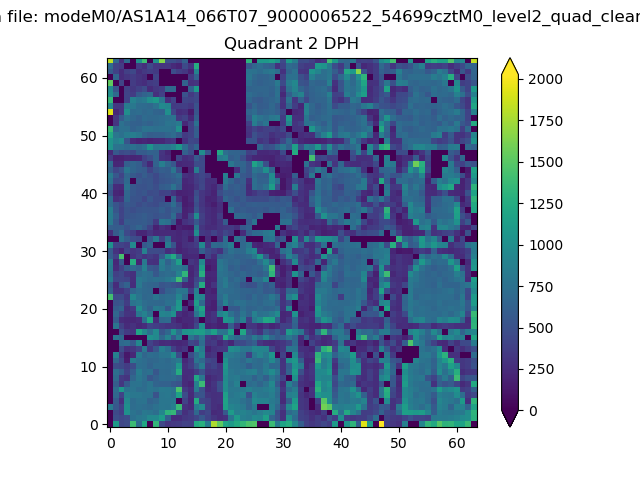
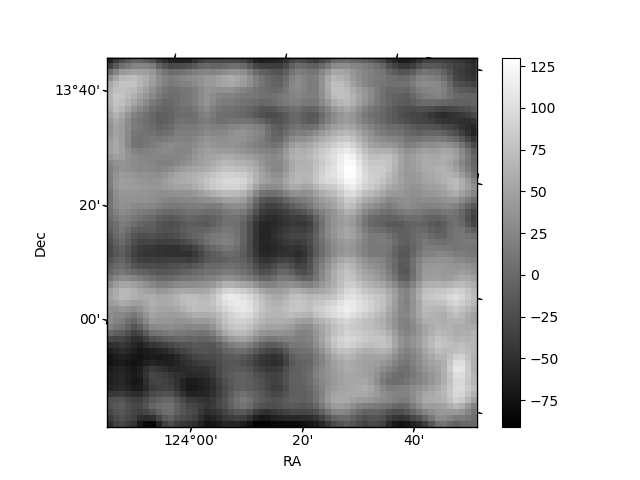
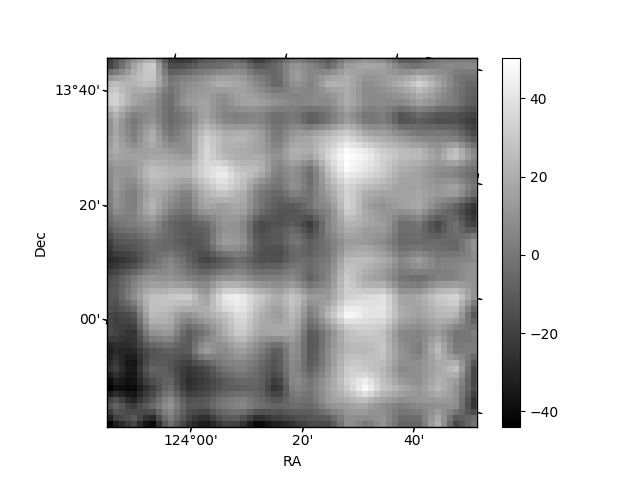
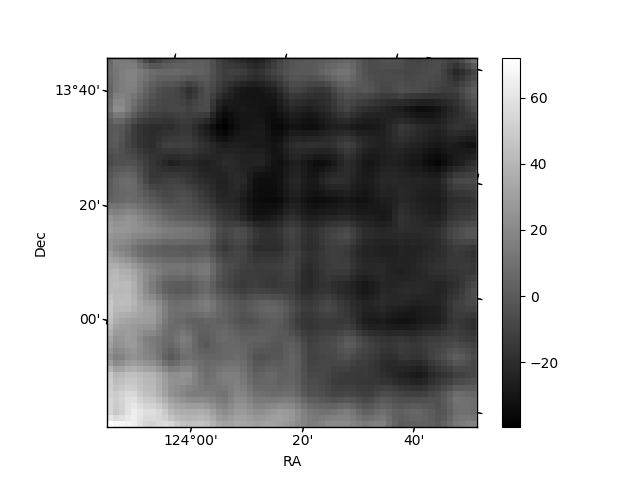
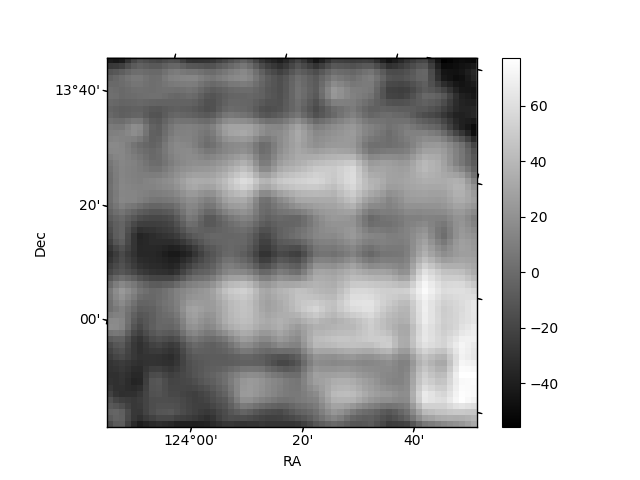
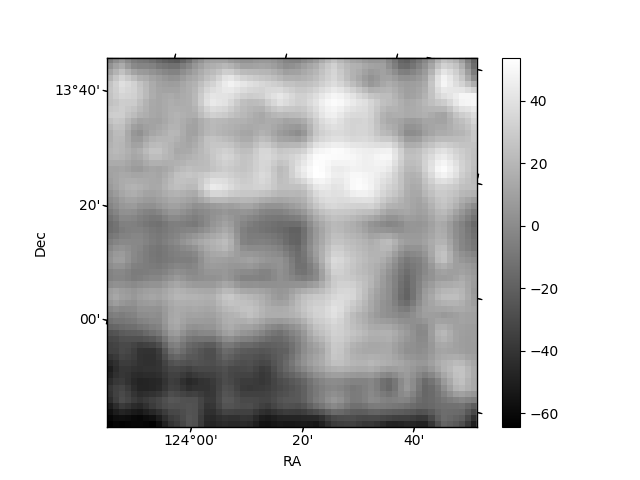
Histogram calculated using DETX and DETY for each event in the final _common_clean file
| Quadrant A | 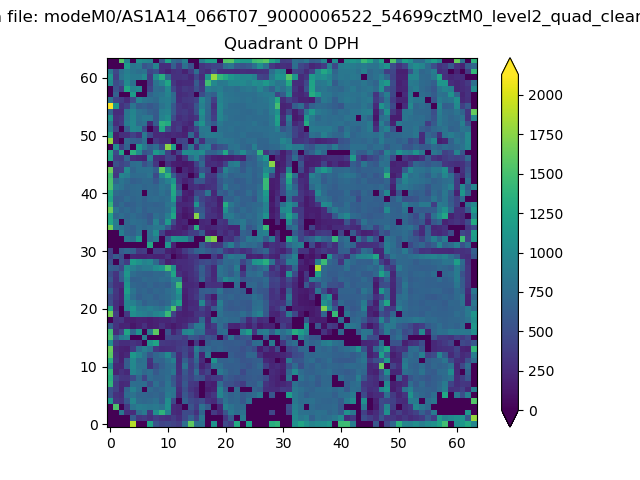 |
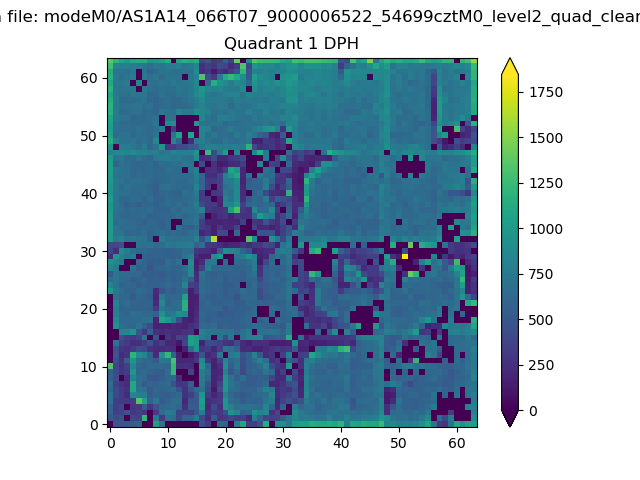 |
Quadrant B |
|---|---|---|---|
| Quadrant D | 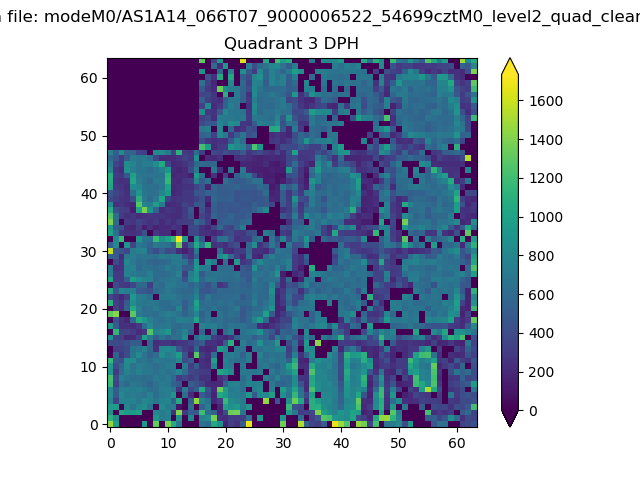 |
 |
Quadrant C |
| Plot type | Count rate plots | Images |
|---|---|---|
| Comparison with Poisson distribution Blue bars denote a histogram of data divided into 1 sec bins. Red curve is a Poisson curve with rate = median count rate of data. |
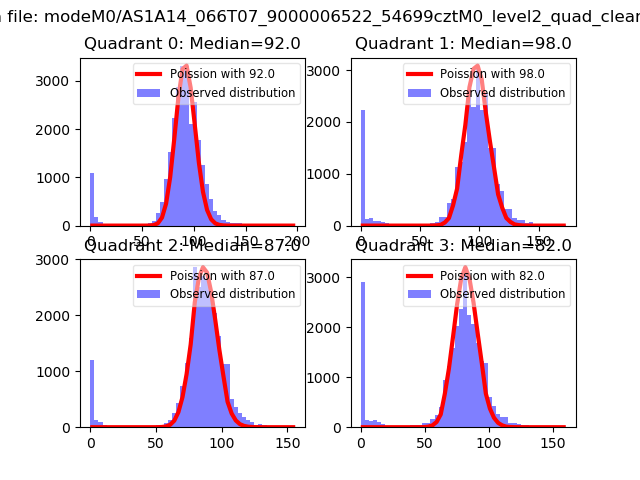 |
 |
| Quadrant-wise count rates Data is divided into 100 sec bins |
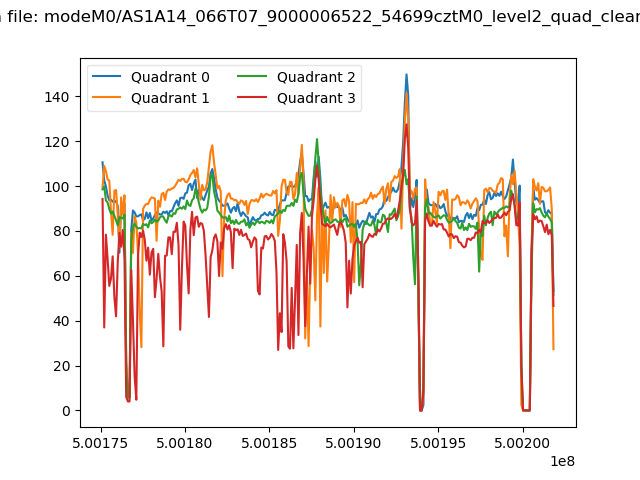 |
|
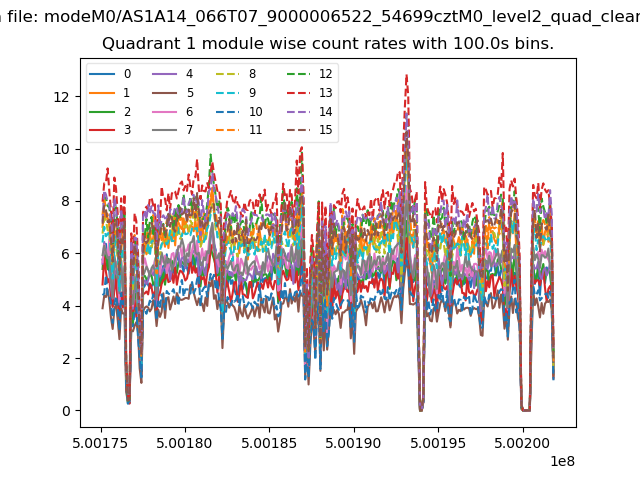
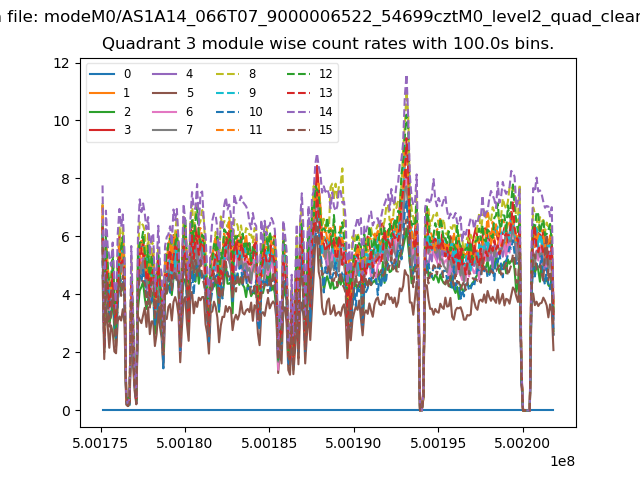
| Module-wise count rates for Quadrant A Data is divided into 100 sec bins |
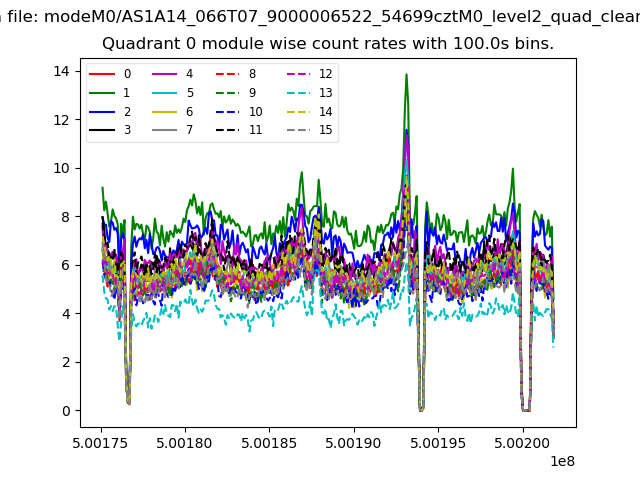 |
 |
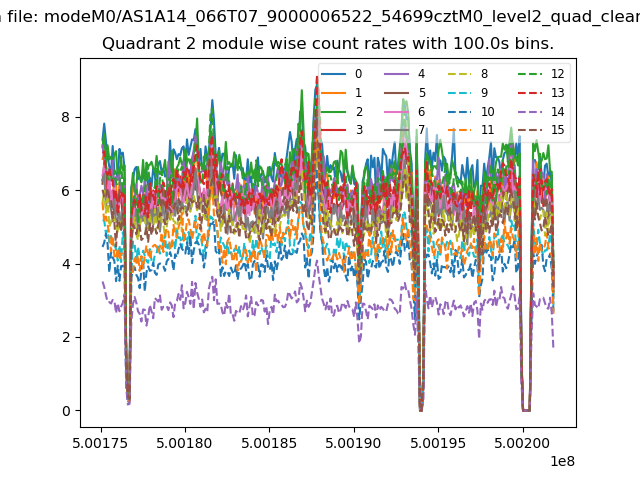
| Module-wise count rates for Quadrant B Data is divided into 100 sec bins |
 |
 |
| Module-wise count rates for Quadrant C Data is divided into 100 sec bins |
 |
 |
| Module-wise count rates for Quadrant D Data is divided into 100 sec bins |
 |
 |
| Parameter | Plot |
|---|---|
| CZT HV Monitor | 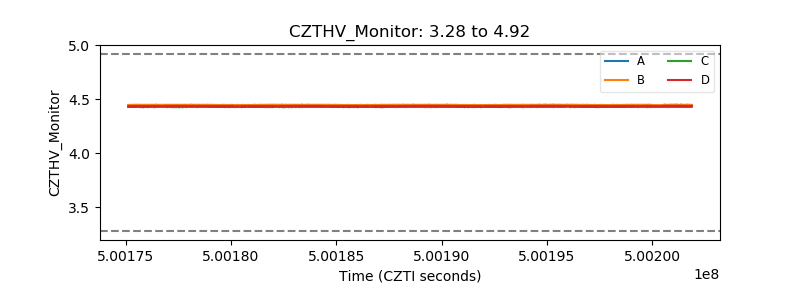 |
| D_VDD | 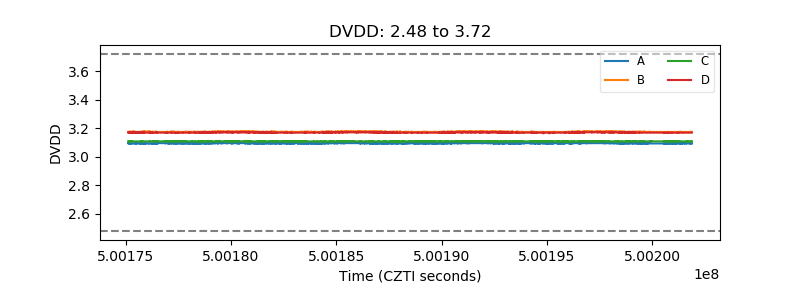 |
| Temperature 1 | 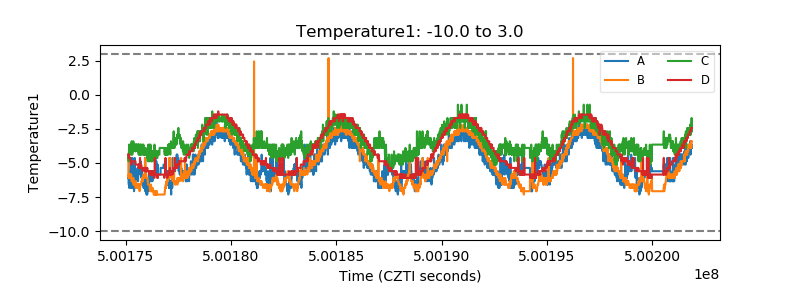 |
| Veto HV Monitor | 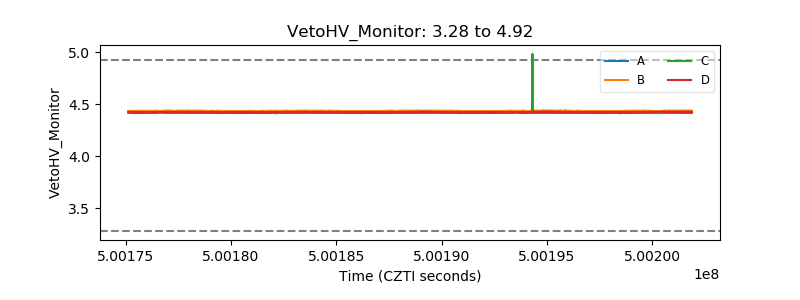 |
| Veto LLD | 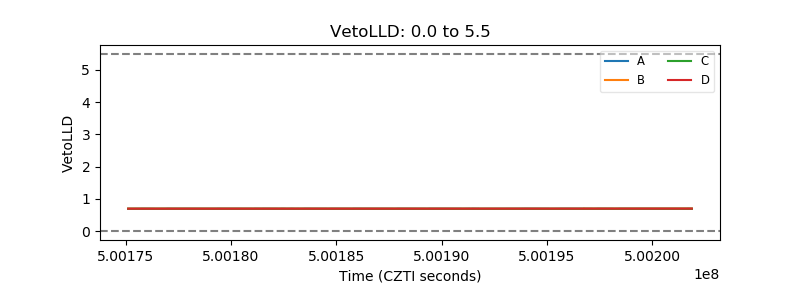 |
| Alpha Counter | 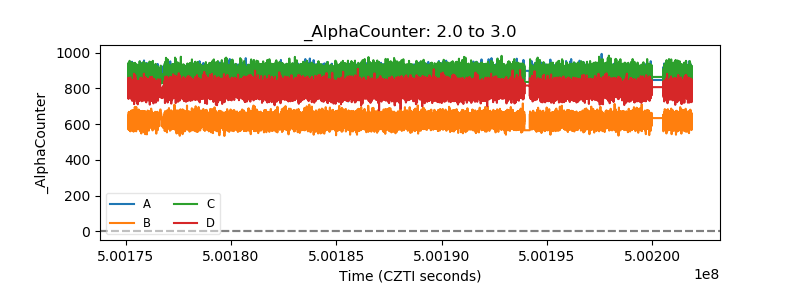 |
| _CPM_Rate | 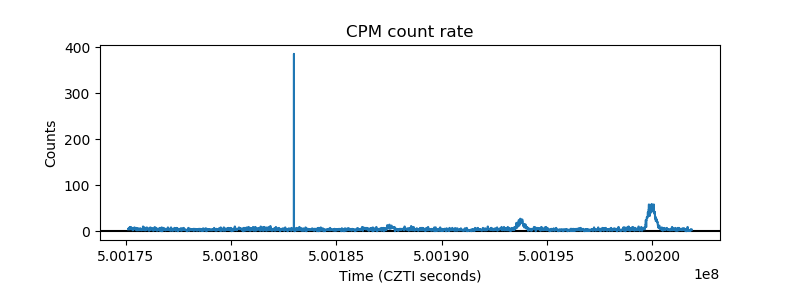 |
| CZT Counter | 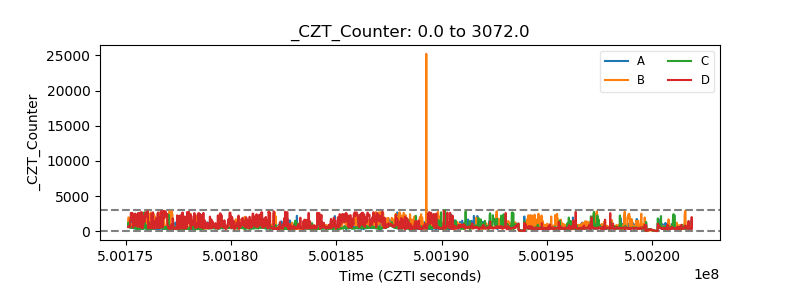 |
| +2.5 Volts monitor |  |
| +5 Volts monitor | 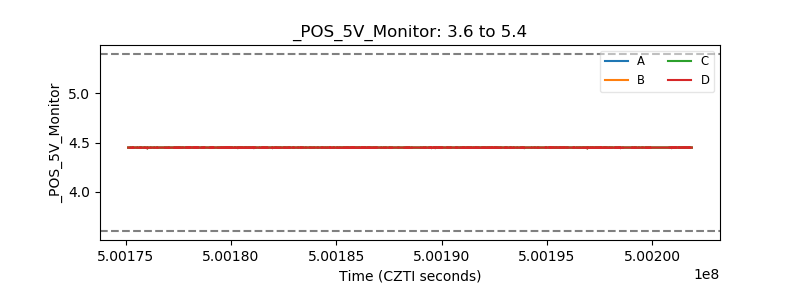 |
| _ROLL_ROT | 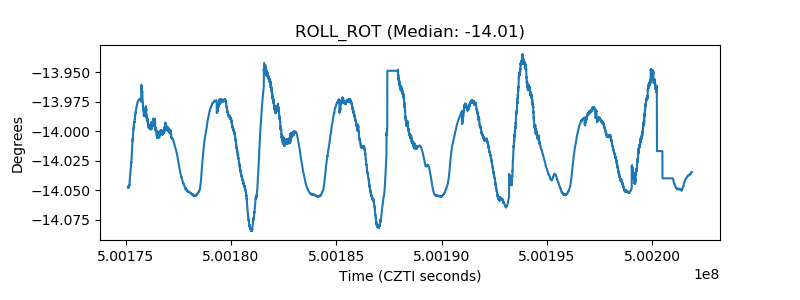 |
| _Roll_DEC | 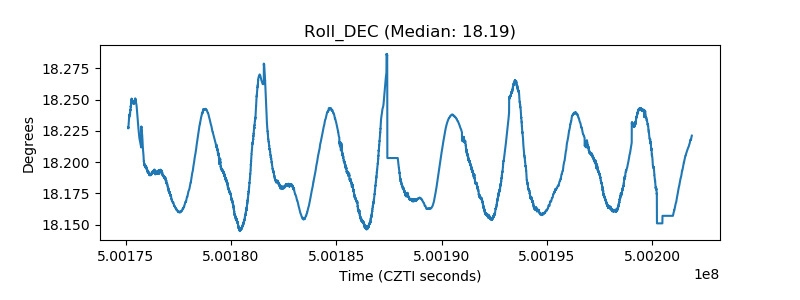 |
| _Roll_RA | 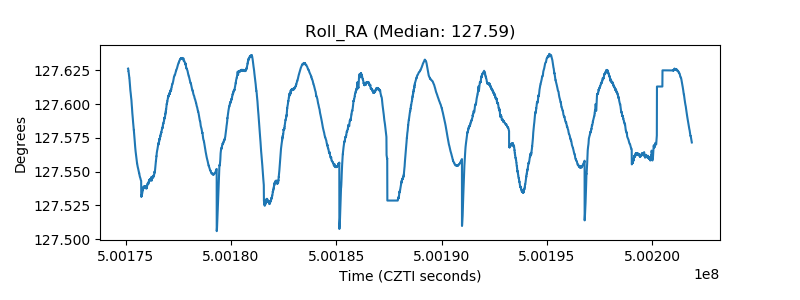 |
| Veto Counter | 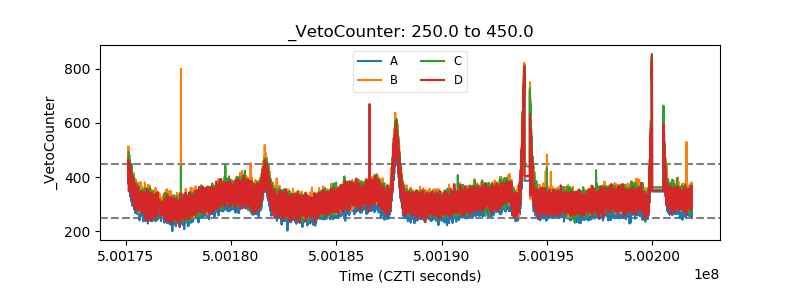 |