| Param | Original file | Final file |
|---|---|---|
| Filename | modeM0/AS1A14_066T07_9000006522_54700cztM0_level2.fits | modeM0/AS1A14_066T07_9000006522_54700cztM0_level2_quad_clean.evt |
| Size (bytes) | 183,919,680 | 36,008,640 |
| Size | 175.4 MB | 34.3 MB |
| Events in quadrant A | 1,473,240 | 230,362 |
| Events in quadrant B | 2,094,280 | 248,705 |
| Events in quadrant C | 1,249,070 | 223,548 |
| Events in quadrant D | 1,781,430 | 196,166 |
| Mode M0 | |||
|---|---|---|---|
| Quadrant | BADHDUFLAG | Total packets | Discarded packets |
| A | 0 | 6367 | 48 |
| B | 0 | 8156 | 83 |
| C | 0 | 5762 | 26 |
| D | 0 | 7358 | 87 |
| Mode SS | |||
|---|---|---|---|
| Quadrant | BADHDUFLAG | Total packets | Discarded packets |
| A | 0 | 54 | 0 |
| B | 0 | 54 | 0 |
| C | 0 | 54 | 0 |
| D | 0 | 54 | 0 |
| Quadrant | Total seconds | Saturated seconds | Saturation percentage |
|---|---|---|---|
| A | 2669 | 59 | 2.210566% |
| B | 2675 | 82 | 3.065421% |
| C | 2681 | 17 | 0.634092% |
| D | 2671 | 201 | 7.525271% |
Noise dominated data is calculated using 1-second bins in cleaned event files. If a bin has >2000 counts, and if more than 50% of those come from <1% of pixels, then it is considered to be noise-dominated and hence unusable.
| Quadrant | # 1 sec bins | Bins with >0 counts | Bins with >2000 counts | High rate bins dominated by noise | Noise dominated (total time) | Noise dominated (detector-on time) | Marked lightcurve |
|---|---|---|---|---|---|---|---|
| A | 2698 | 2688 | 44 | 44 | 1.63% | 1.64% | 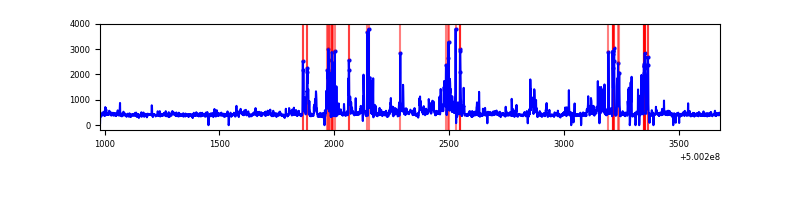 |
| B | 2699 | 2695 | 66 | 66 | 2.45% | 2.45% | 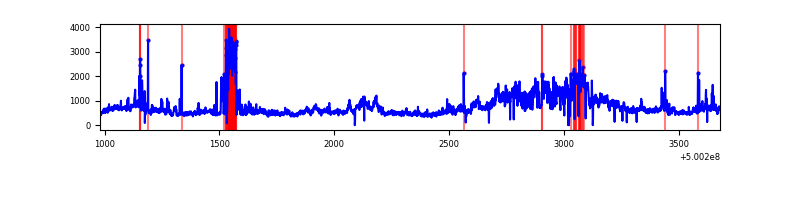 |
| C | 2699 | 2692 | 16 | 16 | 0.59% | 0.59% | 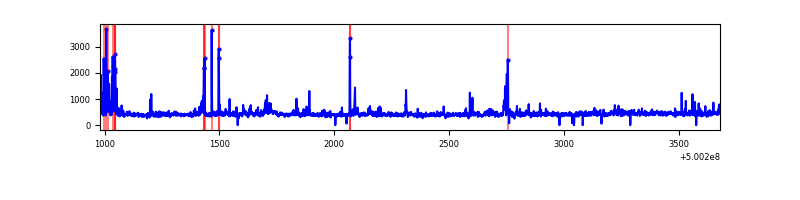 |
| D | 2699 | 2691 | 169 | 169 | 6.26% | 6.28% | 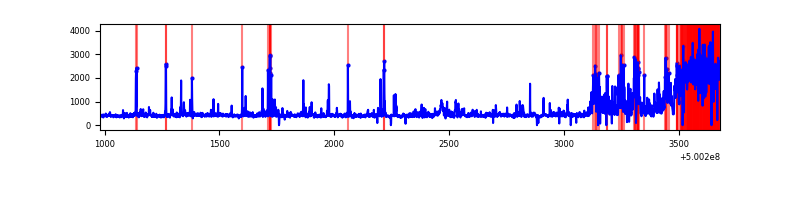 |
Top three noisy pixels from each quadrant. If the there are fewer than three noisy pixels in the level2.evt file, extra rows are filled as -1
| Pixel properties | Quadrant properties | ||||||
|---|---|---|---|---|---|---|---|
| Quadrant | DetID | PixID | Counts | Sigma | Mean | Median | Sigma |
| A | 13 | 248 | 150868 | 2280.58 | 264 | 256 | 66.0 |
| A | 0 | 8 | 110561 | 1670.25 | 264 | 256 | 66.0 |
| A | 7 | 190 | 52802 | 795.66 | 264 | 256 | 66.0 |
| B | 2 | 249 | 729460 | 12794.31 | 257 | 248 | 57.0 |
| B | 7 | 0 | 281573 | 4935.96 | 257 | 248 | 57.0 |
| B | 0 | 213 | 31256 | 544.05 | 257 | 248 | 57.0 |
| C | 9 | 38 | 119377 | 1667.07 | 257 | 255 | 71.5 |
| C | 4 | 5 | 33381 | 463.59 | 257 | 255 | 71.5 |
| C | 1 | 16 | 21975 | 303.96 | 257 | 255 | 71.5 |
| D | 11 | 129 | 513395 | 7189.2 | 250 | 238 | 71.4 |
| D | 6 | 239 | 62749 | 875.76 | 250 | 238 | 71.4 |
| D | 3 | 224 | 58843 | 821.04 | 250 | 238 | 71.4 |
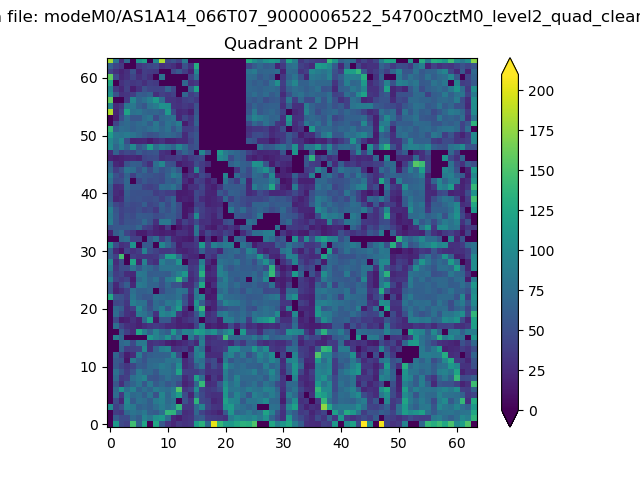
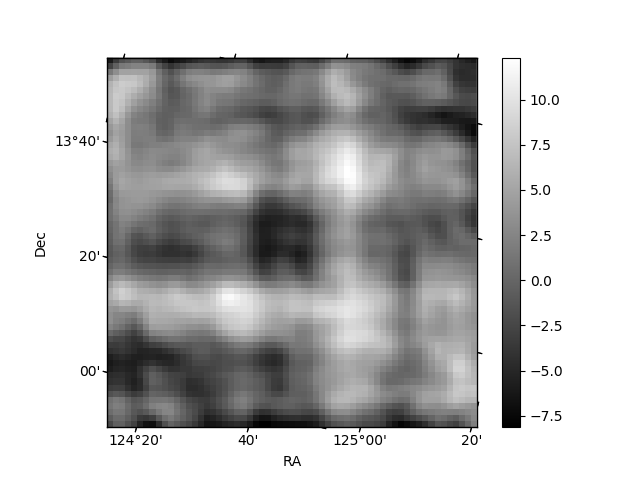
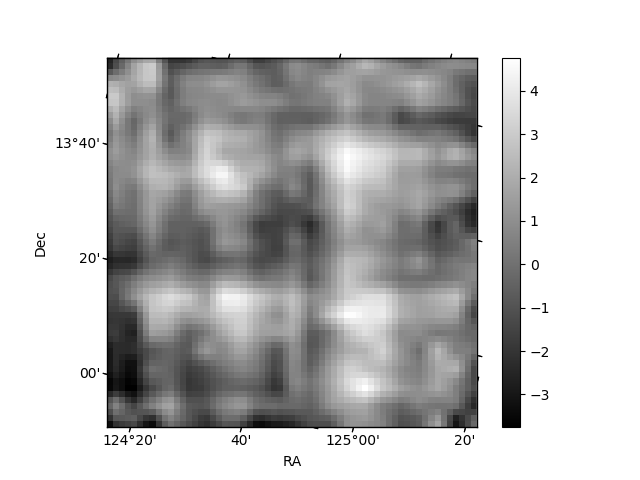
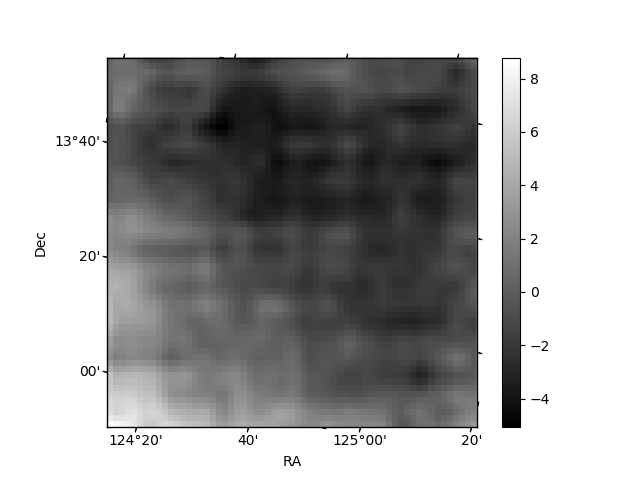
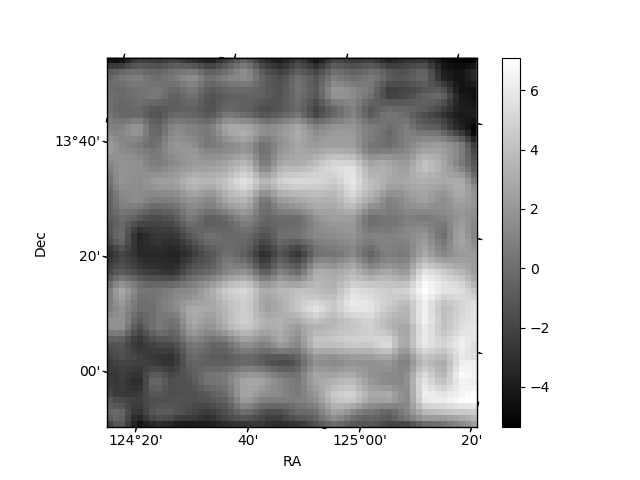
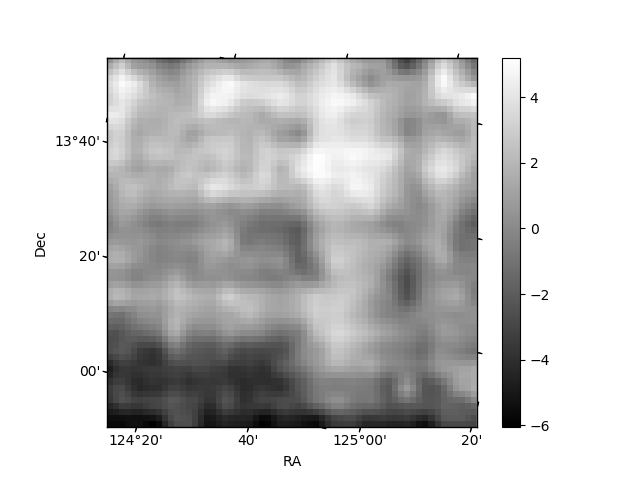
Histogram calculated using DETX and DETY for each event in the final _common_clean file
| Quadrant A | 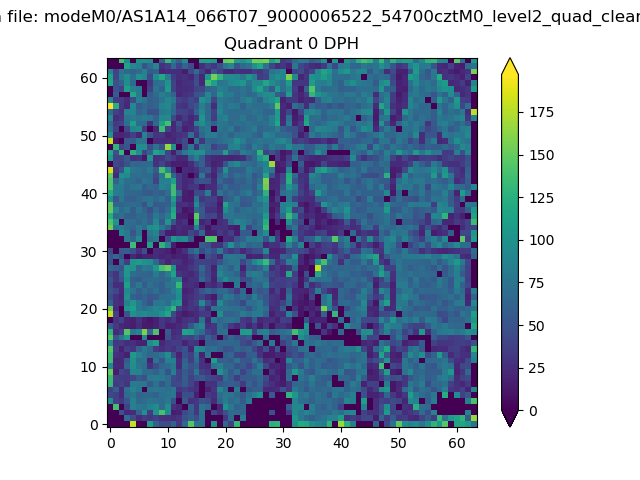 |
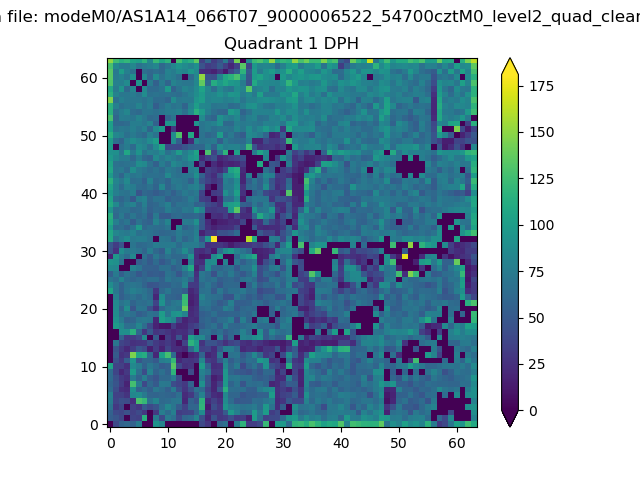 |
Quadrant B |
|---|---|---|---|
| Quadrant D | 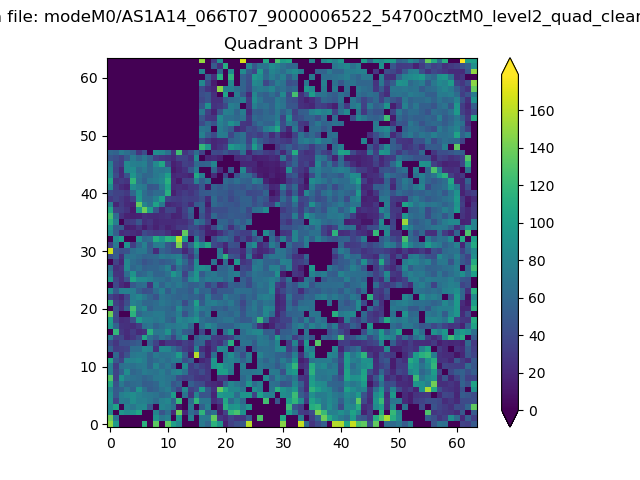 |
 |
Quadrant C |
| Plot type | Count rate plots | Images |
|---|---|---|
| Comparison with Poisson distribution Blue bars denote a histogram of data divided into 1 sec bins. Red curve is a Poisson curve with rate = median count rate of data. |
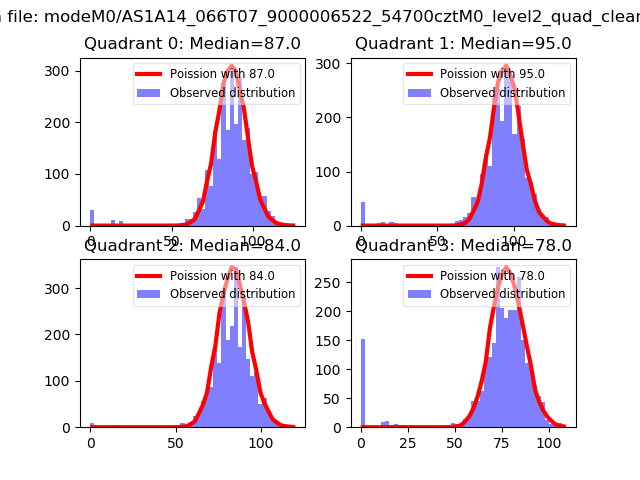 |
 |
| Quadrant-wise count rates Data is divided into 100 sec bins |
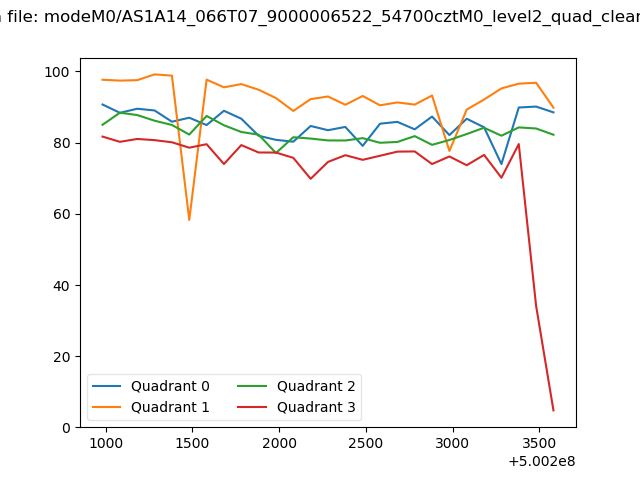 |
|
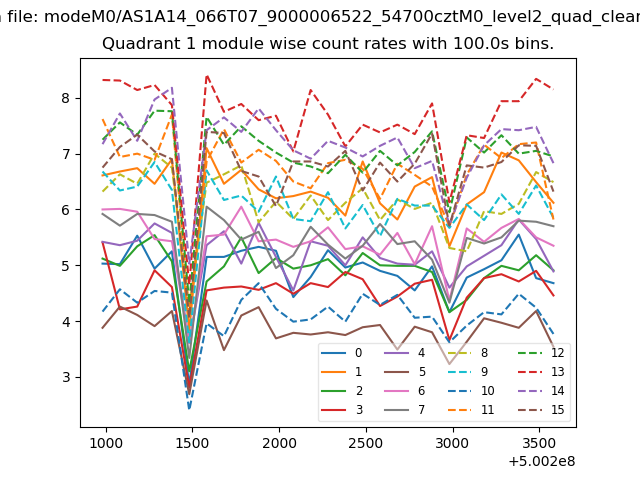
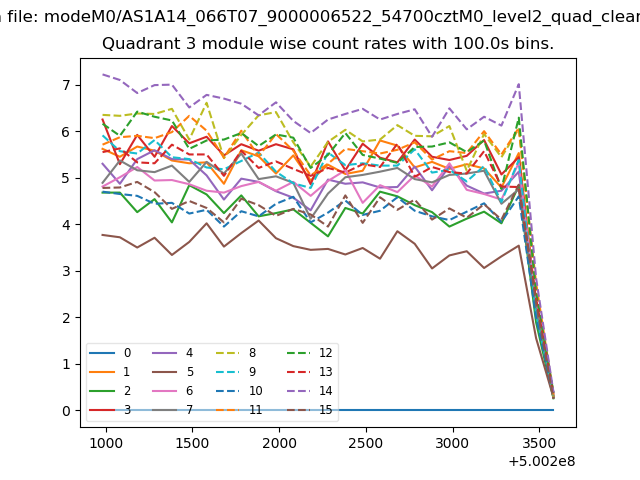
| Module-wise count rates for Quadrant A Data is divided into 100 sec bins |
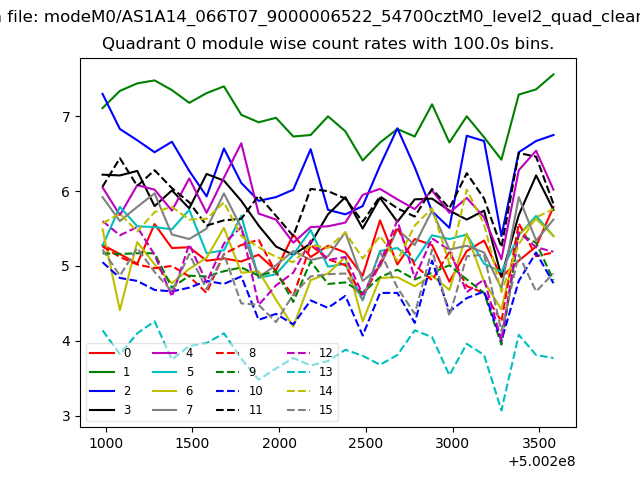 |
 |
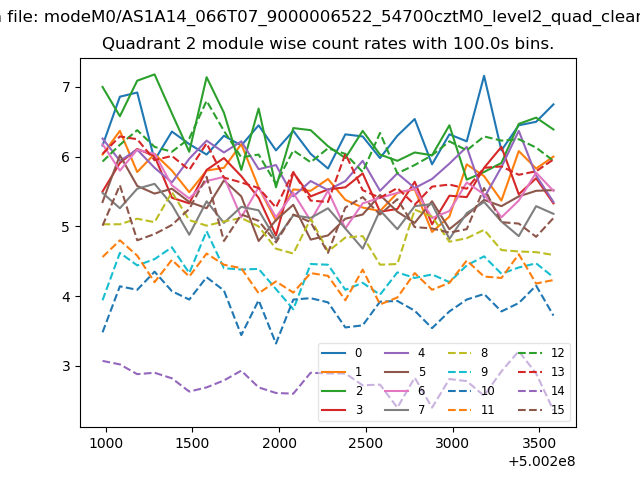
| Module-wise count rates for Quadrant B Data is divided into 100 sec bins |
 |
 |
| Module-wise count rates for Quadrant C Data is divided into 100 sec bins |
 |
 |
| Module-wise count rates for Quadrant D Data is divided into 100 sec bins |
 |
 |
| Parameter | Plot |
|---|---|
| CZT HV Monitor | 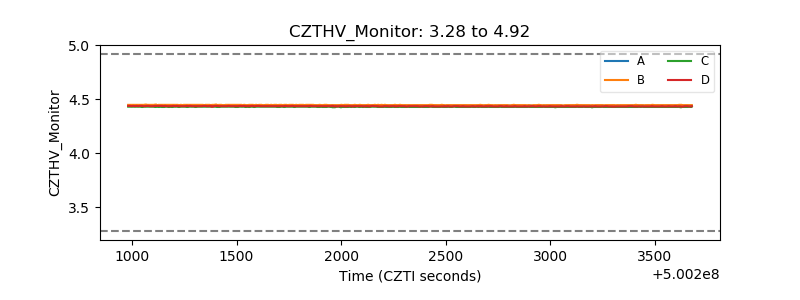 |
| D_VDD | 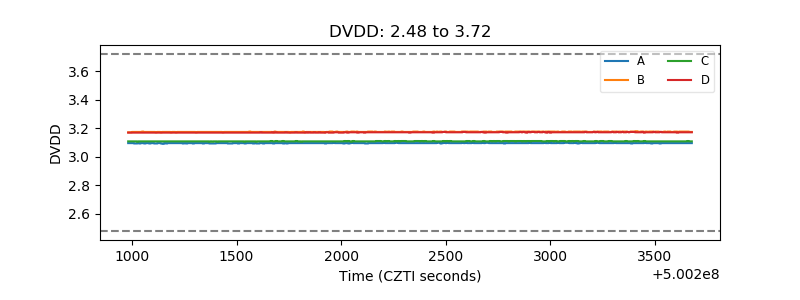 |
| Temperature 1 | 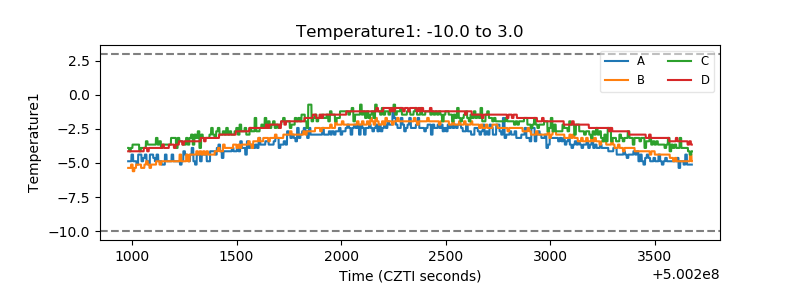 |
| Veto HV Monitor | 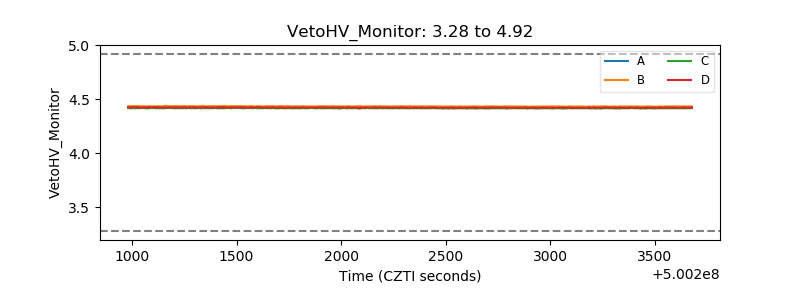 |
| Veto LLD | 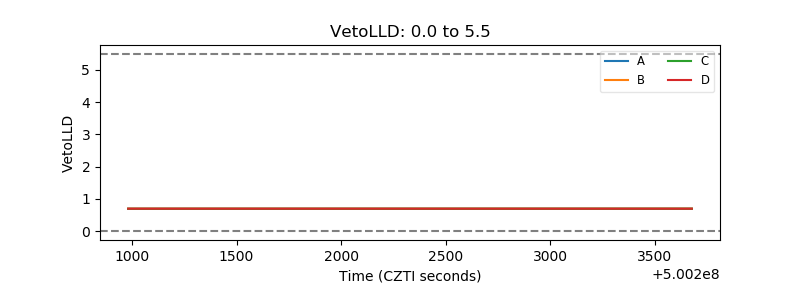 |
| Alpha Counter | 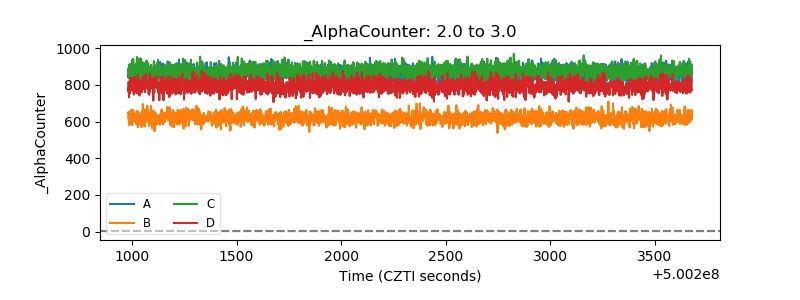 |
| _CPM_Rate | 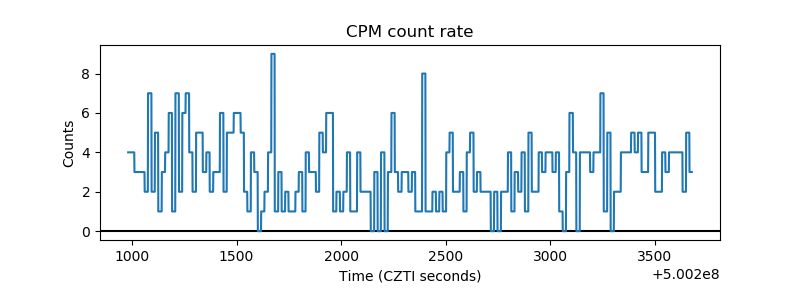 |
| CZT Counter | 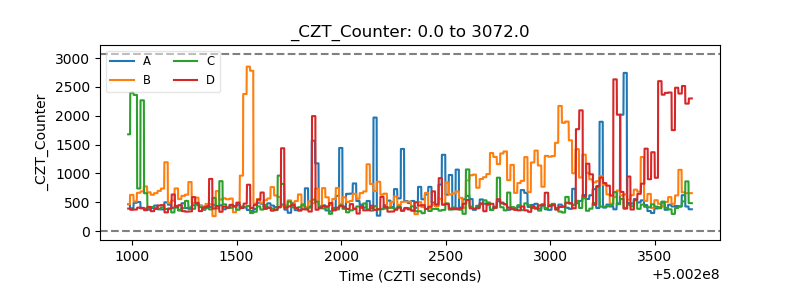 |
| +2.5 Volts monitor | 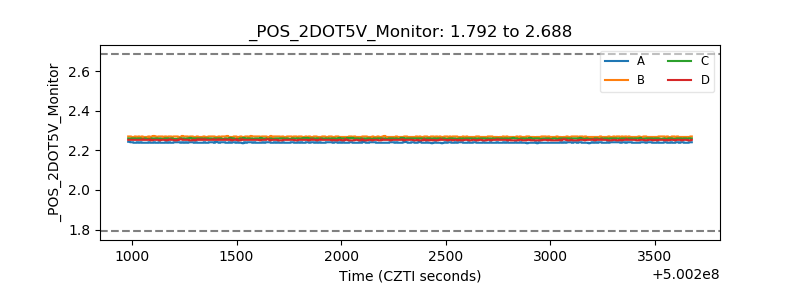 |
| +5 Volts monitor | 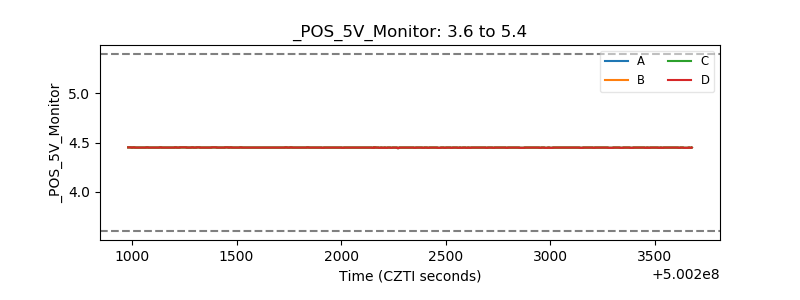 |
| _ROLL_ROT | 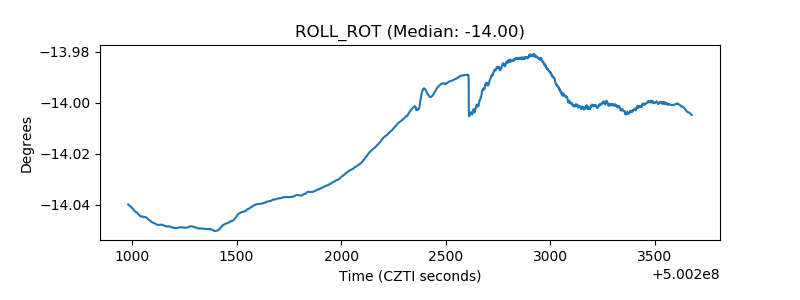 |
| _Roll_DEC | 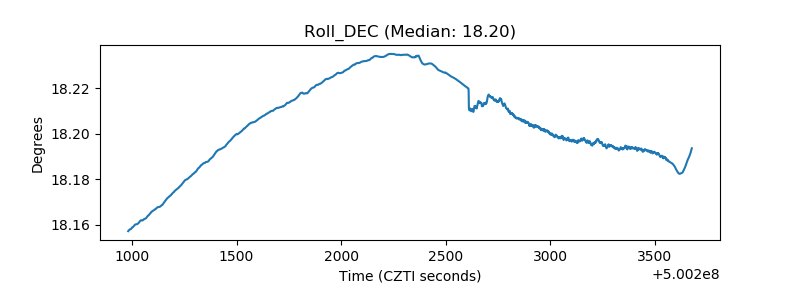 |
| _Roll_RA | 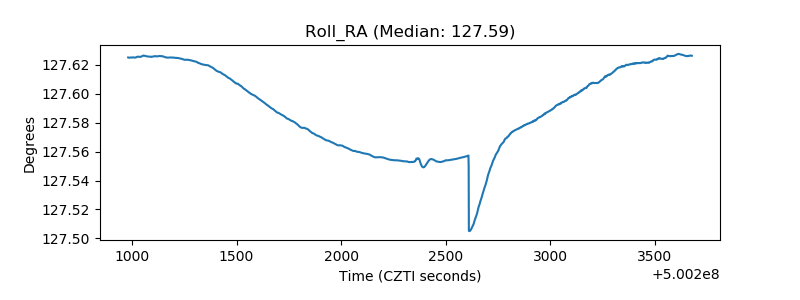 |
| Veto Counter | 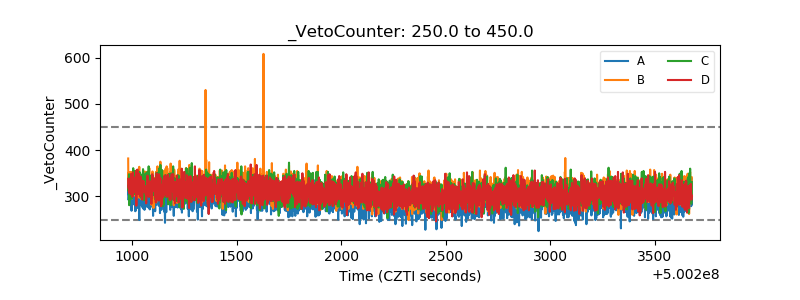 |