| Param | Original file | Final file |
|---|---|---|
| Filename | modeM0/AS1A14_103T01_9000006524cztM0_level2.fits | modeM0/AS1A14_103T01_9000006524cztM0_level2_quad_clean.evt |
| Size (bytes) | 3,819,222,720 | 1,931,999,040 |
| Size | 3.6 GB | 1.8 GB |
| Events in quadrant A | 23,309,922 | 7,542,918 |
| Events in quadrant B | 20,092,306 | 6,391,714 |
| Events in quadrant C | 21,448,015 | 6,378,518 |
| Events in quadrant D | 18,737,392 | 6,163,220 |
| Mode SS | |||
|---|---|---|---|
| Quadrant | BADHDUFLAG | Total packets | Discarded packets |
| A | 0 | 9644 | 0 |
| B | 0 | 9744 | 0 |
| C | 0 | 9749 | 0 |
| D | 0 | 9748 | 0 |
| Mode M0 | |||
|---|---|---|---|
| Quadrant | BADHDUFLAG | Total packets | Discarded packets |
| A | 0 | 1032628 | 0 |
| B | 0 | 1508111 | 0 |
| C | 0 | 1369057 | 0 |
| D | 0 | 1387843 | 0 |
| Mode M9 | |||
|---|---|---|---|
| Quadrant | BADHDUFLAG | Total packets | Discarded packets |
| A | 0 | 539 | 0 |
| B | 0 | 535 | 0 |
| C | 0 | 539 | 0 |
| D | 0 | 534 | 0 |
| Quadrant | Total seconds | Saturated seconds | Saturation percentage |
|---|---|---|---|
| A | 467070 | 9420 | 2.016828% |
| B | 465541 | 61040 | 13.111627% |
| C | 466909 | 41395 | 8.865753% |
| D | 466640 | 38991 | 8.355692% |
Noise dominated data is calculated using 1-second bins in cleaned event files. If a bin has >2000 counts, and if more than 50% of those come from <1% of pixels, then it is considered to be noise-dominated and hence unusable.
| Quadrant | # 1 sec bins | Bins with >0 counts | Bins with >2000 counts | High rate bins dominated by noise | Noise dominated (total time) | Noise dominated (detector-on time) | Marked lightcurve |
|---|---|---|---|---|---|---|---|
| A | 565826 | 467272 | 0 | 0 | 0.00% | 0.00% |  |
| B | 565826 | 461643 | 0 | 0 | 0.00% | 0.00% |  |
| C | 565826 | 465920 | 0 | 0 | 0.00% | 0.00% | 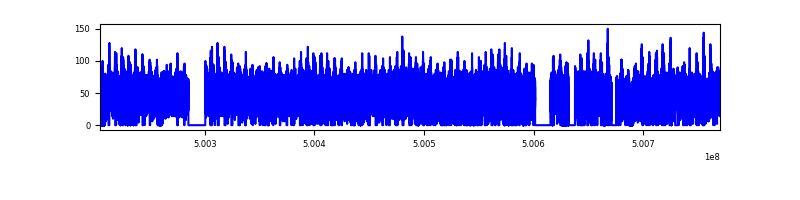 |
| D | 565825 | 465806 | 0 | 0 | 0.00% | 0.00% | 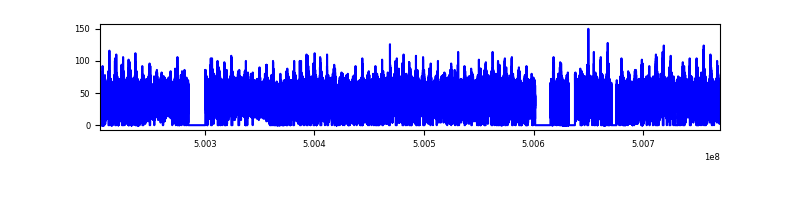 |
Top three noisy pixels from each quadrant. If the there are fewer than three noisy pixels in the level2.evt file, extra rows are filled as -1
| Pixel properties | Quadrant properties | ||||||
|---|---|---|---|---|---|---|---|
| Quadrant | DetID | PixID | Counts | Sigma | Mean | Median | Sigma |
| A | 14 | 188 | 25962 | 9.82 | 6115 | 5622 | 2070.4 |
| A | 9 | 255 | 23668 | 8.72 | 6115 | 5622 | 2070.4 |
| A | 14 | 204 | 21080 | 7.47 | 6115 | 5622 | 2070.4 |
| B | 2 | 9 | 22845 | 14.48 | 5298 | 5001 | 1232.4 |
| B | 2 | 8 | 20871 | 12.88 | 5298 | 5001 | 1232.4 |
| B | 3 | 25 | 16582 | 9.4 | 5298 | 5001 | 1232.4 |
| C | 15 | 175 | 17030 | 5.98 | 5725 | 5188 | 1980.1 |
| C | 2 | 31 | 16925 | 5.93 | 5725 | 5188 | 1980.1 |
| C | 7 | 221 | 16298 | 5.61 | 5725 | 5188 | 1980.1 |
| D | 6 | 218 | 24101 | 10.72 | 5353 | 4735 | 1805.9 |
| D | 15 | 11 | 17955 | 7.32 | 5353 | 4735 | 1805.9 |
| D | 8 | 12 | 17585 | 7.12 | 5353 | 4735 | 1805.9 |
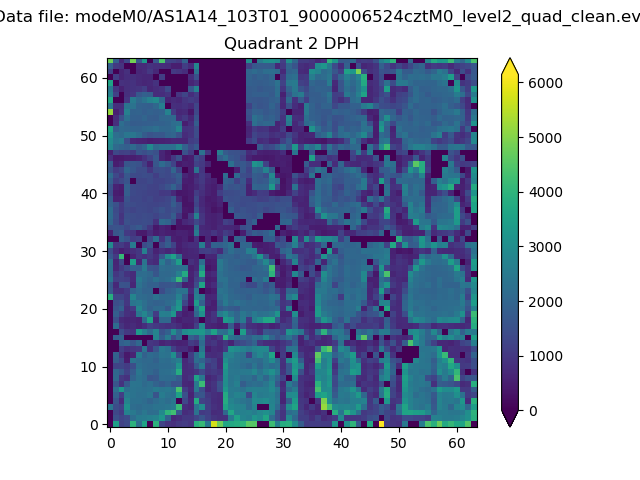
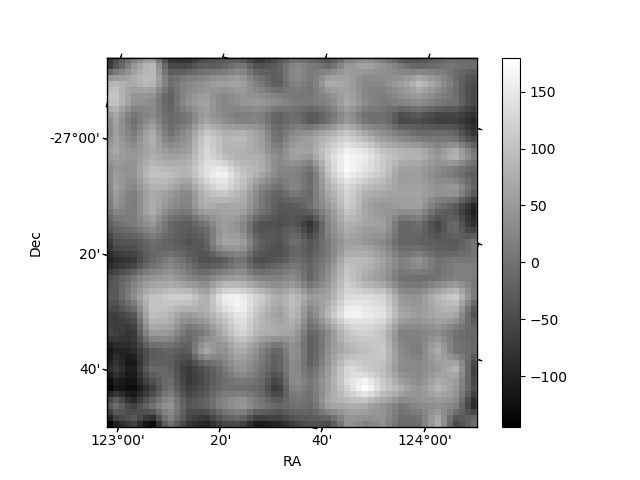
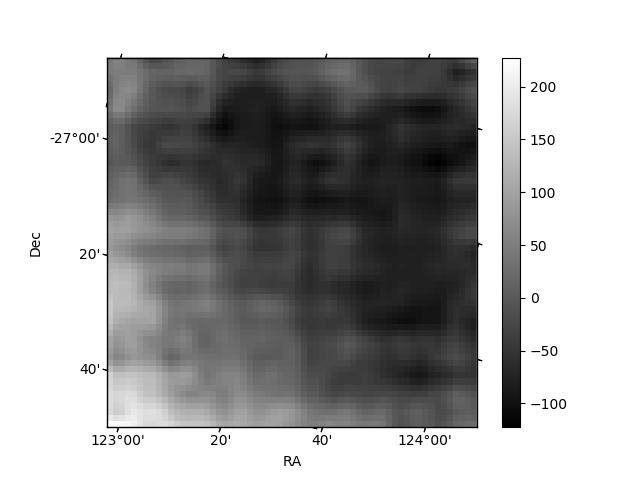
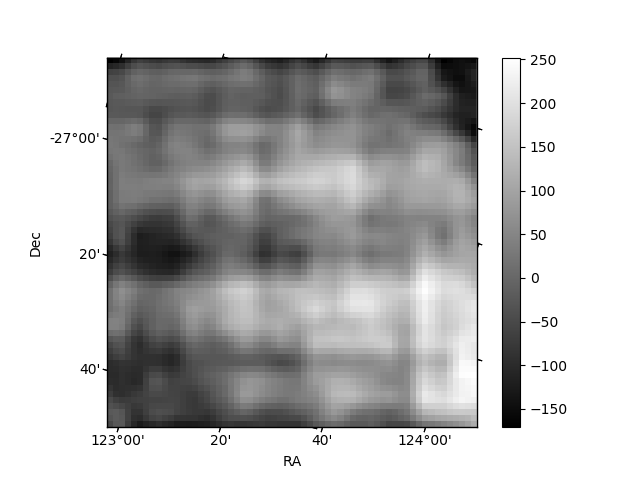
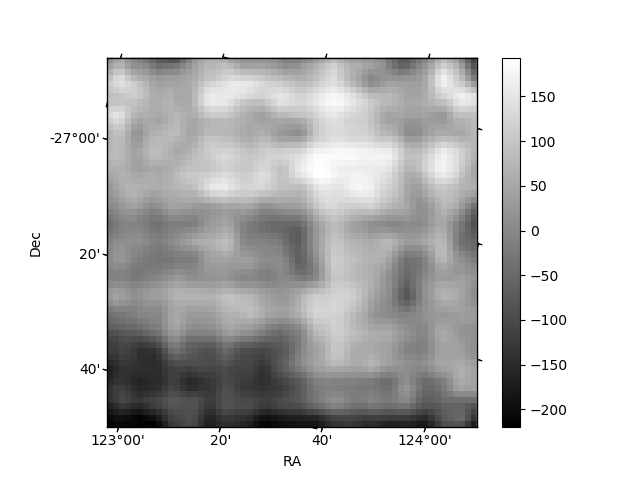
Histogram calculated using DETX and DETY for each event in the final _common_clean file
| Quadrant A | 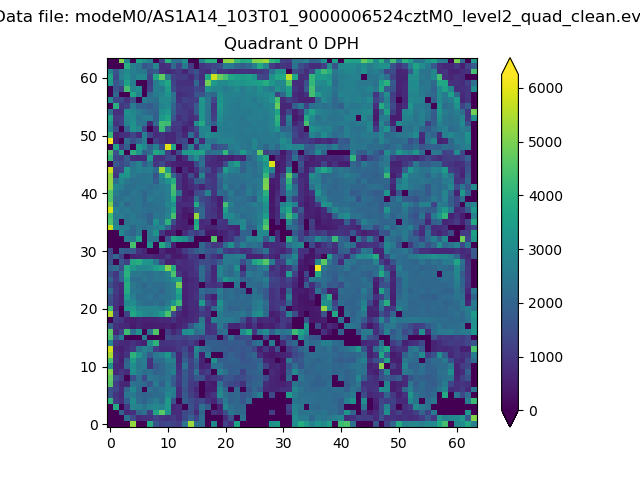 |
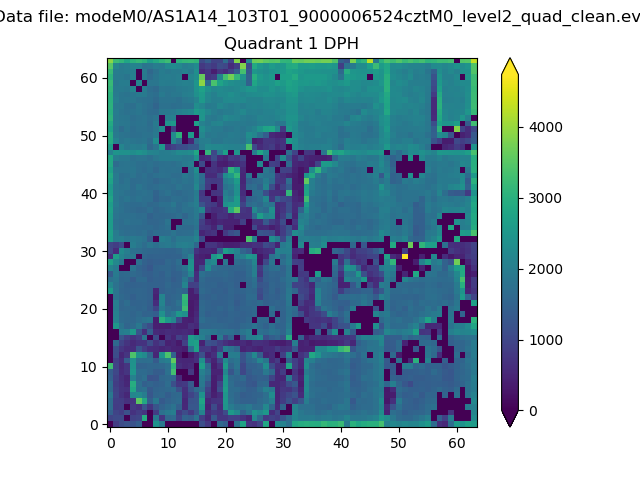 |
Quadrant B |
|---|---|---|---|
| Quadrant D | 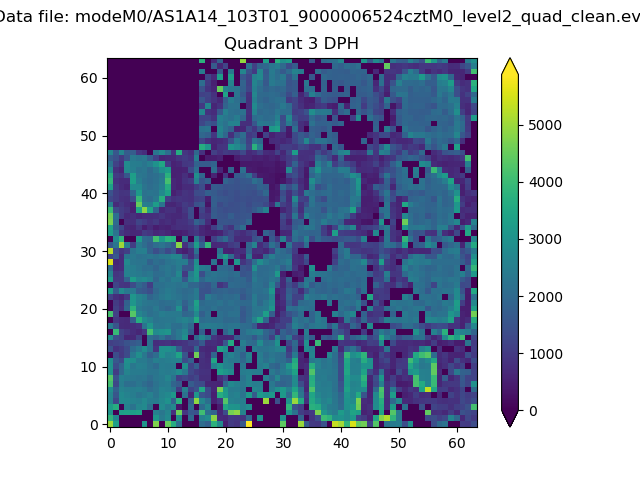 |
 |
Quadrant C |
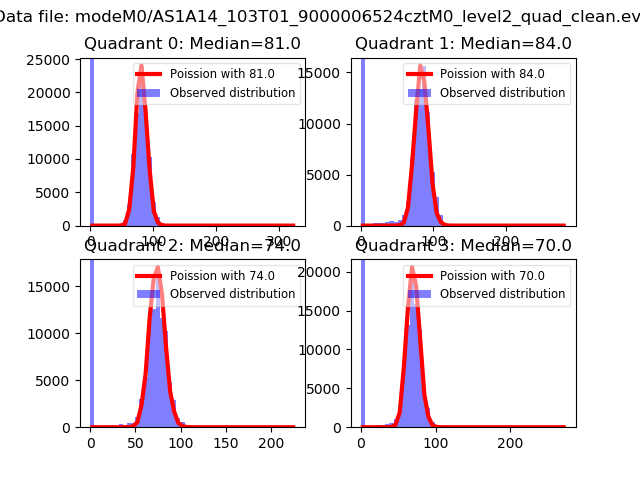
| Plot type | Count rate plots | Images |
|---|---|---|
| Comparison with Poisson distribution Blue bars denote a histogram of data divided into 1 sec bins. Red curve is a Poisson curve with rate = median count rate of data. |
 |
 |
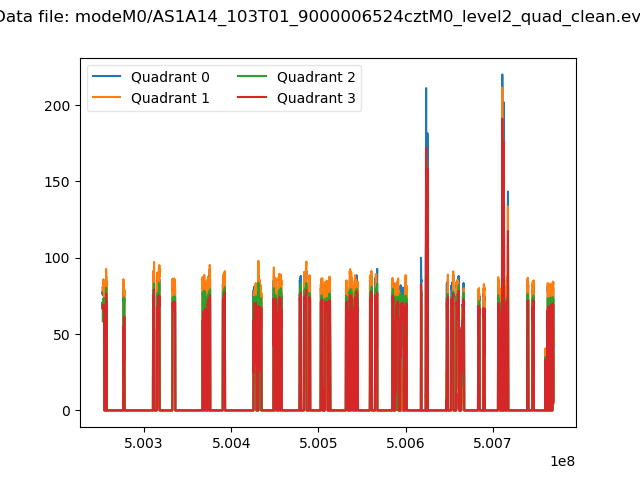
| Quadrant-wise count rates Data is divided into 100 sec bins |
 |
|
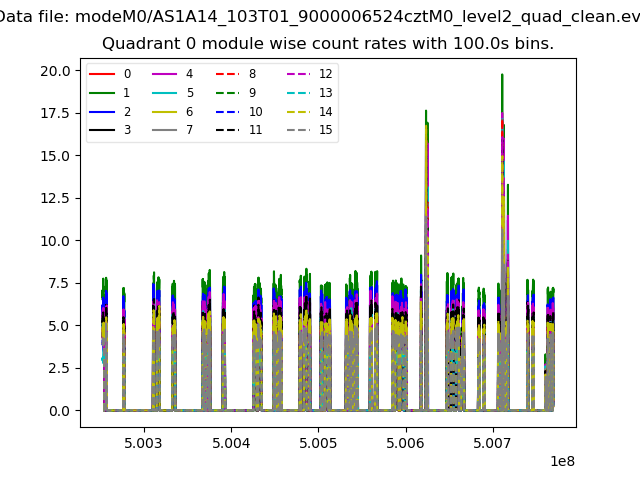
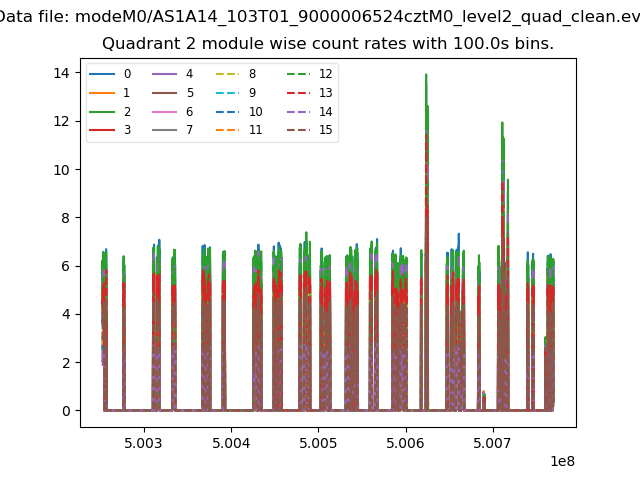
| Module-wise count rates for Quadrant A Data is divided into 100 sec bins |
 |
 |
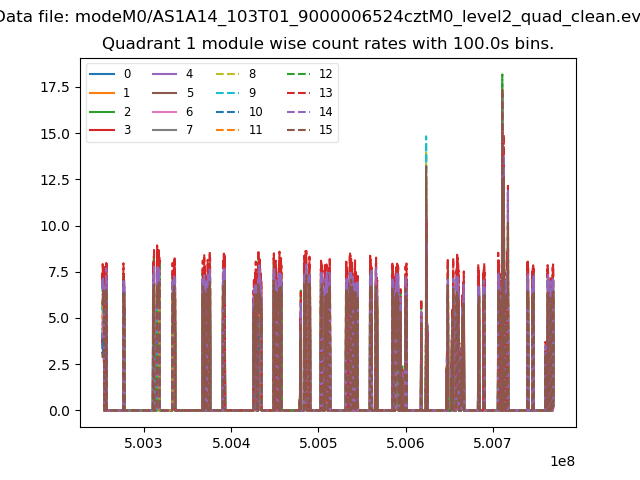
| Module-wise count rates for Quadrant B Data is divided into 100 sec bins |
 |
 |
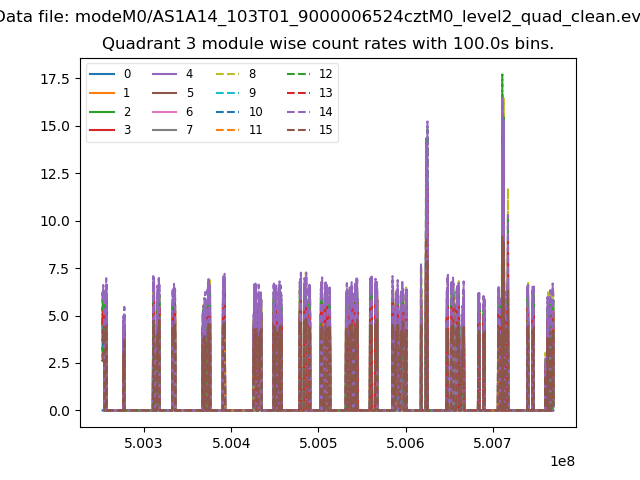
| Module-wise count rates for Quadrant C Data is divided into 100 sec bins |
 |
 |
| Module-wise count rates for Quadrant D Data is divided into 100 sec bins |
 |
 |
| Parameter | Plot |
|---|---|
| CZT HV Monitor | 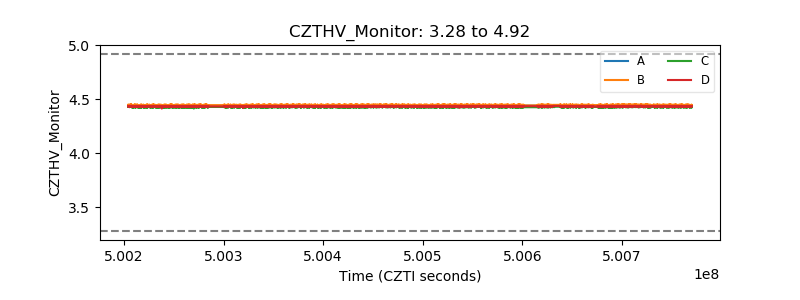 |
| D_VDD | 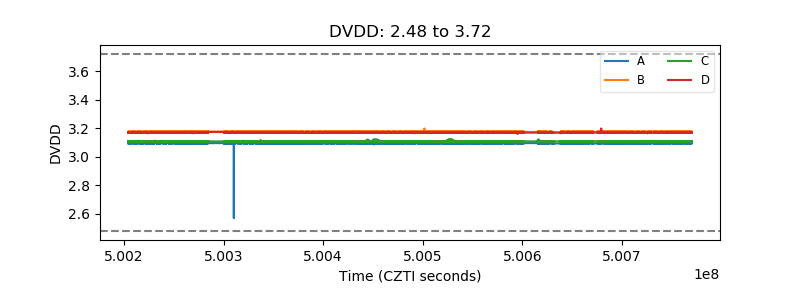 |
| Temperature 1 | 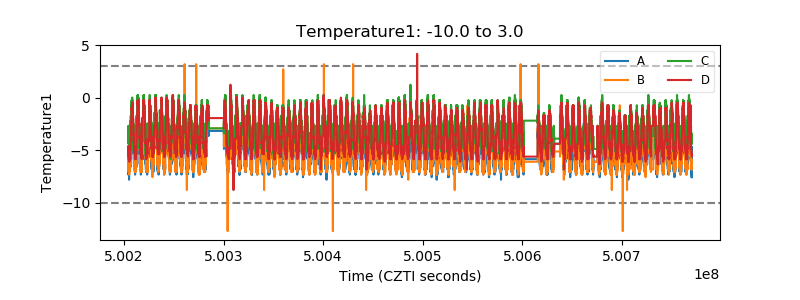 |
| Veto HV Monitor | 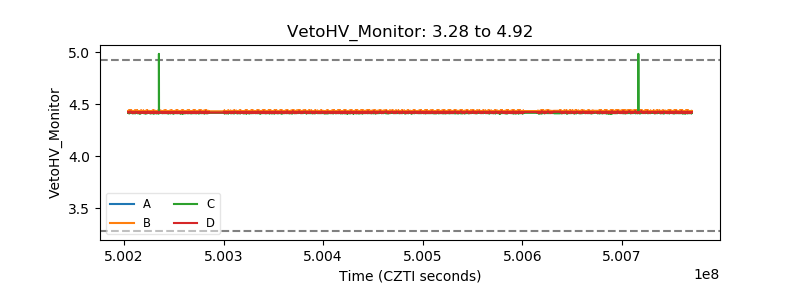 |
| Veto LLD | 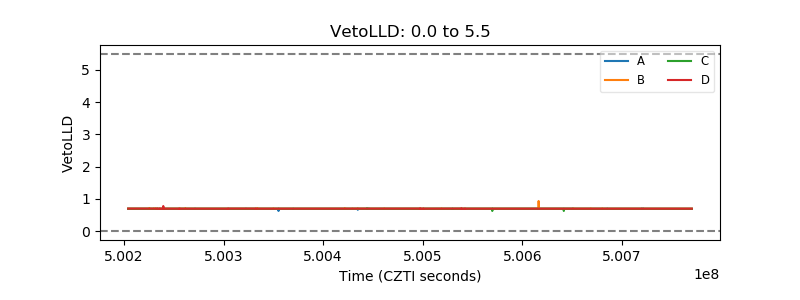 |
| Alpha Counter | 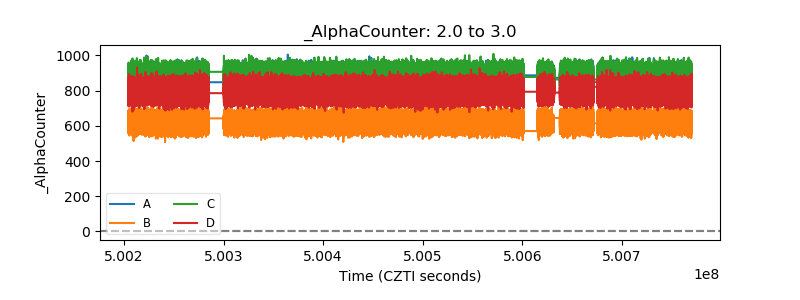 |
| _CPM_Rate | 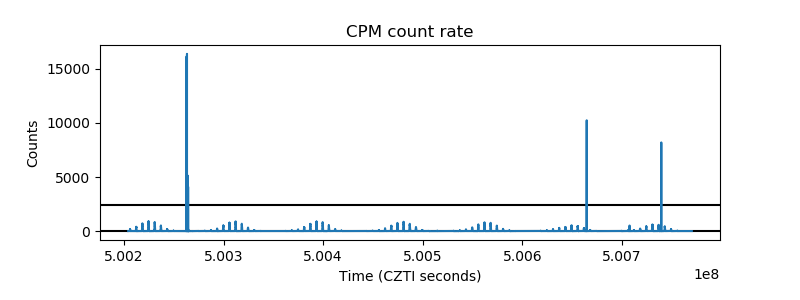 |
| CZT Counter | 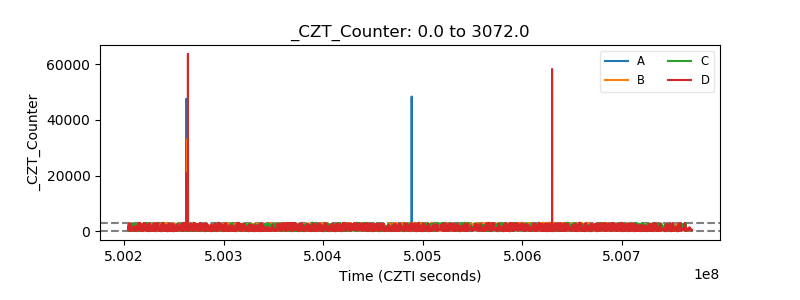 |
| +2.5 Volts monitor | 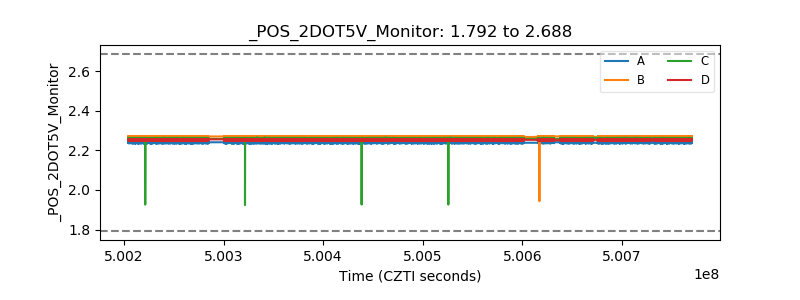 |
| +5 Volts monitor | 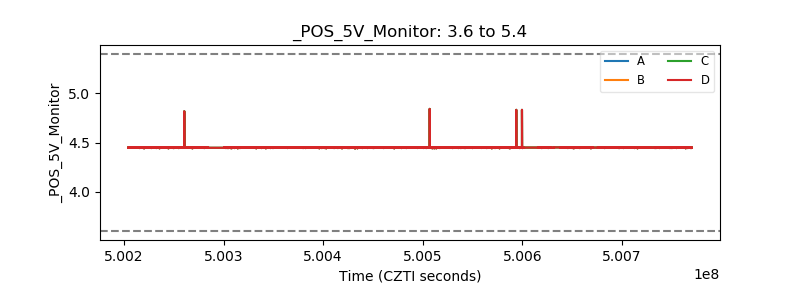 |
| _ROLL_ROT | 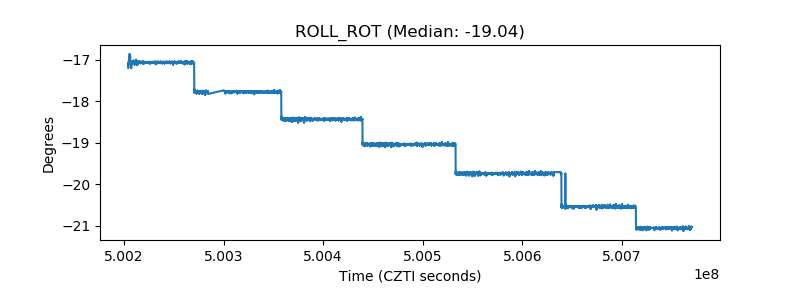 |
| _Roll_DEC | 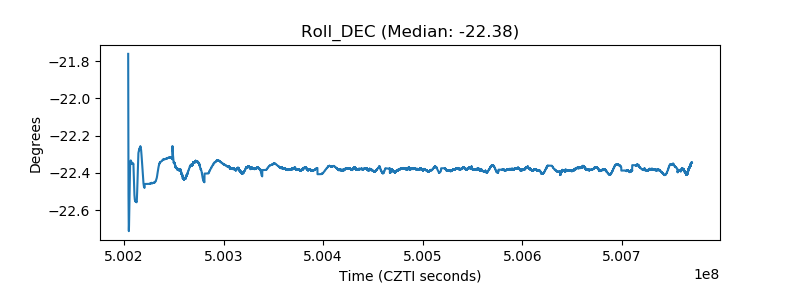 |
| _Roll_RA | 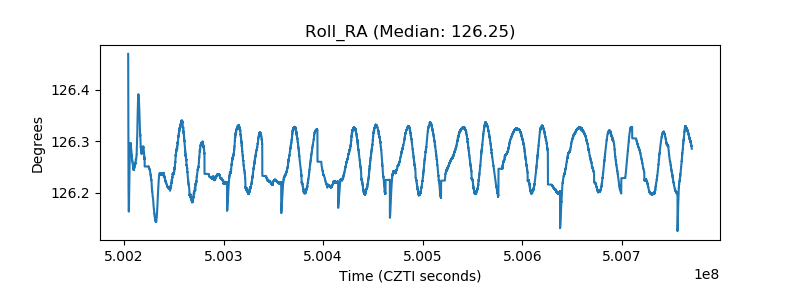 |
| Veto Counter | 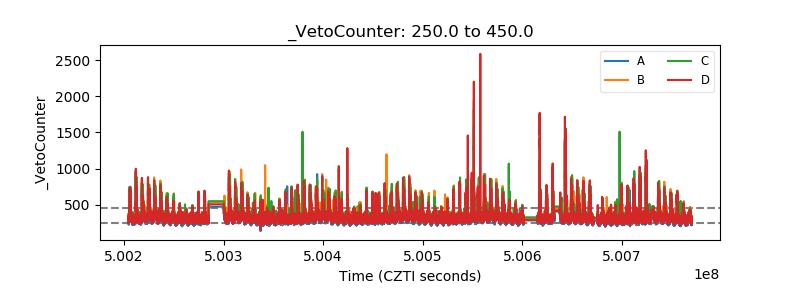 |