| Param | Original file | Final file |
|---|---|---|
| Filename | modeM0/AS1A14_103T01_9000006524_54700cztM0_level2.fits | modeM0/AS1A14_103T01_9000006524_54700cztM0_level2_quad_clean.evt |
| Size (bytes) | 188,360,640 | 43,392,960 |
| Size | 179.6 MB | 41.4 MB |
| Events in quadrant A | 1,393,281 | 302,001 |
| Events in quadrant B | 1,740,842 | 306,049 |
| Events in quadrant C | 1,718,602 | 264,984 |
| Events in quadrant D | 1,899,473 | 240,457 |
| Mode SS | |||
|---|---|---|---|
| Quadrant | BADHDUFLAG | Total packets | Discarded packets |
| A | 0 | 68 | 2 |
| B | 0 | 68 | 8 |
| C | 0 | 65 | 8 |
| D | 0 | 65 | 7 |
| Mode M0 | |||
|---|---|---|---|
| Quadrant | BADHDUFLAG | Total packets | Discarded packets |
| A | 0 | 6993 | 892 |
| B | 0 | 7815 | 738 |
| C | 0 | 8013 | 830 |
| D | 0 | 9891 | 2354 |
| Mode M9 | |||
|---|---|---|---|
| Quadrant | BADHDUFLAG | Total packets | Discarded packets |
| A | 0 | 7 | 0 |
| B | 0 | 7 | 2 |
| C | 0 | 7 | 0 |
| D | 0 | 5 | 0 |
| Quadrant | Total seconds | Saturated seconds | Saturation percentage |
|---|---|---|---|
| A | 2811 | 49 | 1.743152% |
| B | 2825 | 78 | 2.761062% |
| C | 2837 | 134 | 4.723299% |
| D | 2711 | 227 | 8.373294% |
Noise dominated data is calculated using 1-second bins in cleaned event files. If a bin has >2000 counts, and if more than 50% of those come from <1% of pixels, then it is considered to be noise-dominated and hence unusable.
| Quadrant | # 1 sec bins | Bins with >0 counts | Bins with >2000 counts | High rate bins dominated by noise | Noise dominated (total time) | Noise dominated (detector-on time) | Marked lightcurve |
|---|---|---|---|---|---|---|---|
| A | 3986 | 3061 | 0 | 0 | 0.00% | 0.00% | 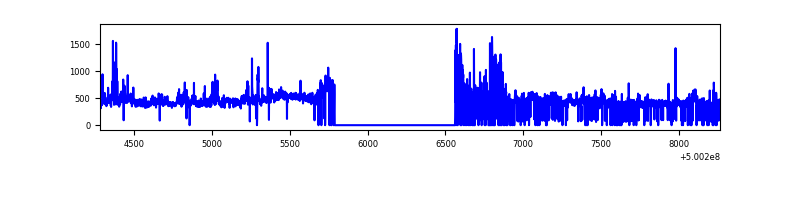 |
| B | 3986 | 3087 | 28 | 28 | 0.70% | 0.91% | 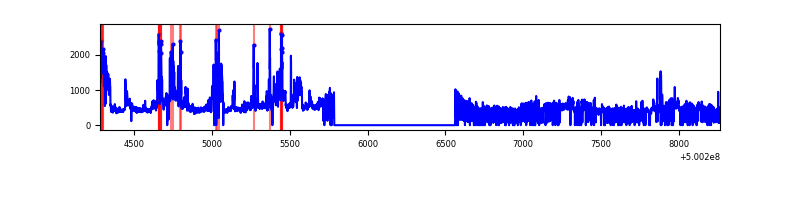 |
| C | 3986 | 3082 | 104 | 104 | 2.61% | 3.37% | 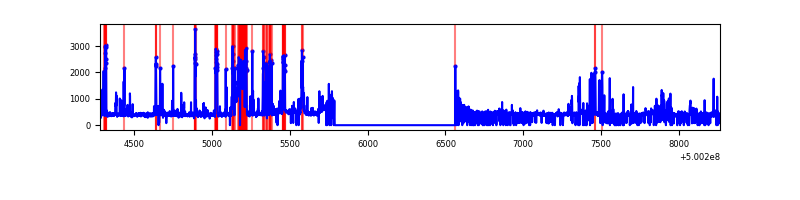 |
| D | 3985 | 2947 | 85 | 85 | 2.13% | 2.88% | 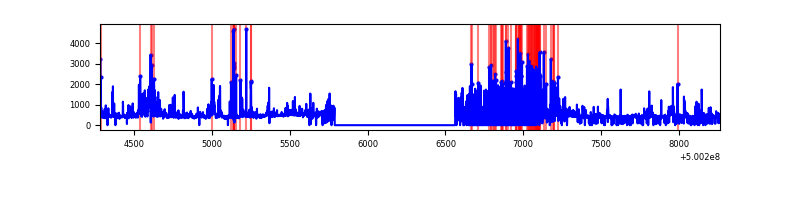 |
Top three noisy pixels from each quadrant. If the there are fewer than three noisy pixels in the level2.evt file, extra rows are filled as -1
| Pixel properties | Quadrant properties | ||||||
|---|---|---|---|---|---|---|---|
| Quadrant | DetID | PixID | Counts | Sigma | Mean | Median | Sigma |
| A | 3 | 14 | 93060 | 1135.04 | 311 | 303 | 81.7 |
| A | 7 | 190 | 36610 | 444.28 | 311 | 303 | 81.7 |
| A | 3 | 110 | 18149 | 218.38 | 311 | 303 | 81.7 |
| B | 2 | 249 | 440562 | 6523.79 | 303 | 292 | 67.5 |
| B | 0 | 213 | 46823 | 689.48 | 303 | 292 | 67.5 |
| B | 7 | 0 | 33845 | 497.18 | 303 | 292 | 67.5 |
| C | 9 | 38 | 361394 | 4289.42 | 298 | 294 | 84.2 |
| C | 4 | 5 | 121421 | 1438.84 | 298 | 294 | 84.2 |
| C | 1 | 16 | 16562 | 193.24 | 298 | 294 | 84.2 |
| D | 11 | 129 | 454430 | 5491.73 | 279 | 266 | 82.7 |
| D | 3 | 12 | 116330 | 1403.44 | 279 | 266 | 82.7 |
| D | 3 | 224 | 98814 | 1191.64 | 279 | 266 | 82.7 |
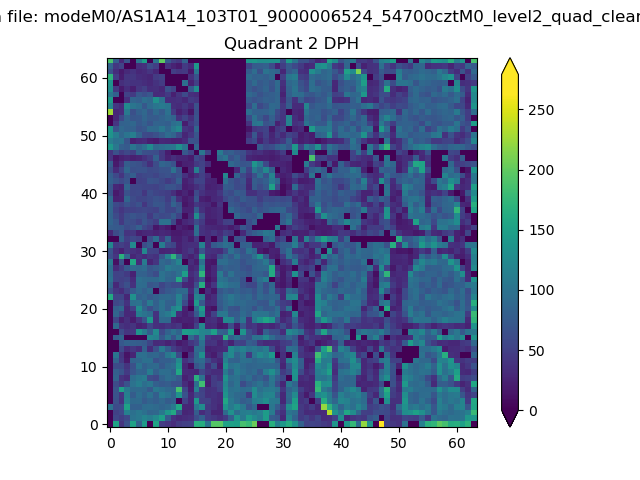
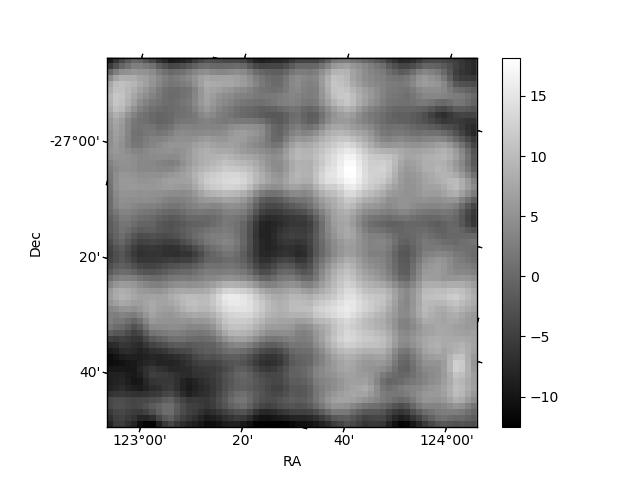
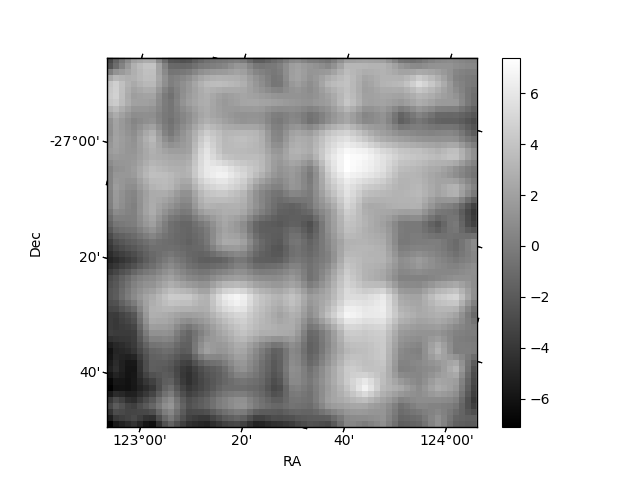
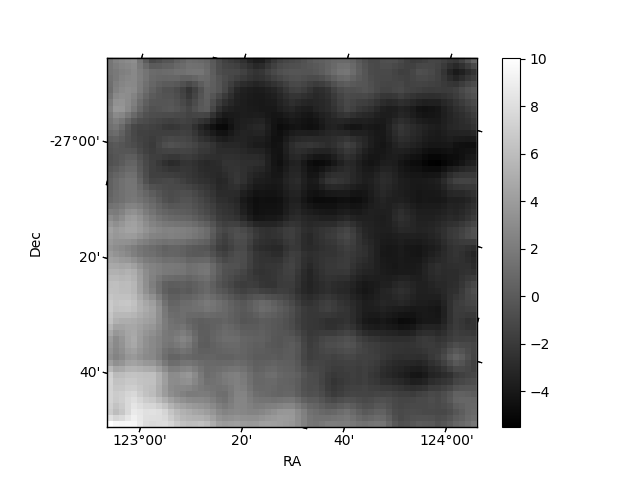
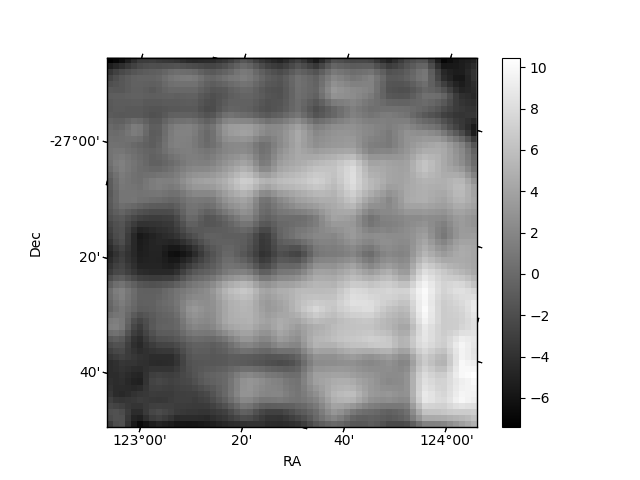
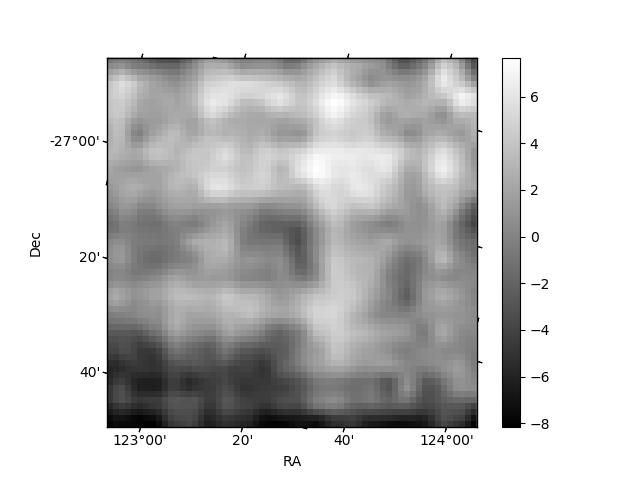
Histogram calculated using DETX and DETY for each event in the final _common_clean file
| Quadrant A | 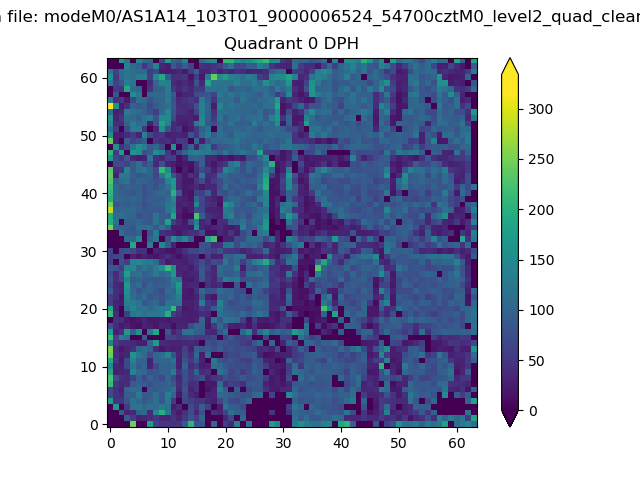 |
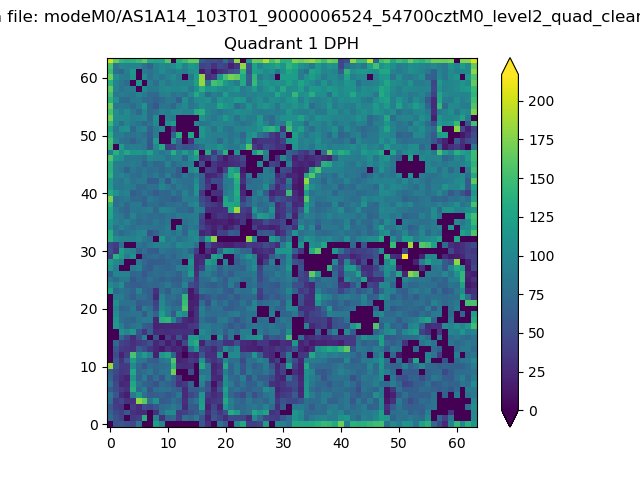 |
Quadrant B |
|---|---|---|---|
| Quadrant D | 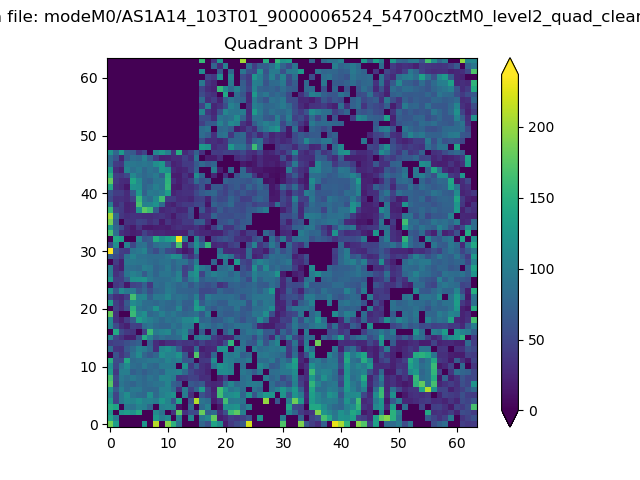 |
 |
Quadrant C |
| Plot type | Count rate plots | Images |
|---|---|---|
| Comparison with Poisson distribution Blue bars denote a histogram of data divided into 1 sec bins. Red curve is a Poisson curve with rate = median count rate of data. |
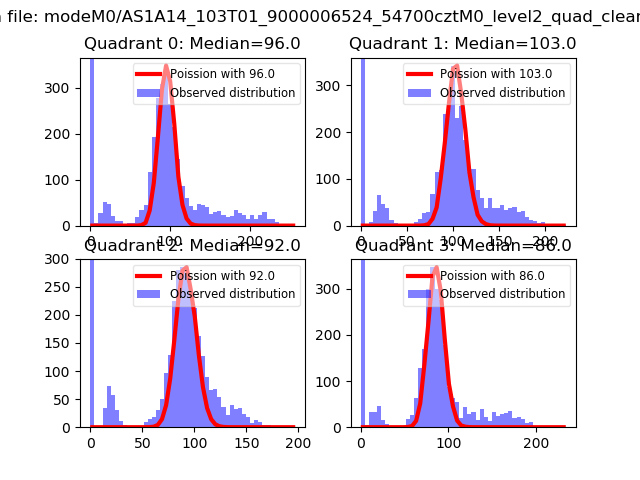 |
 |
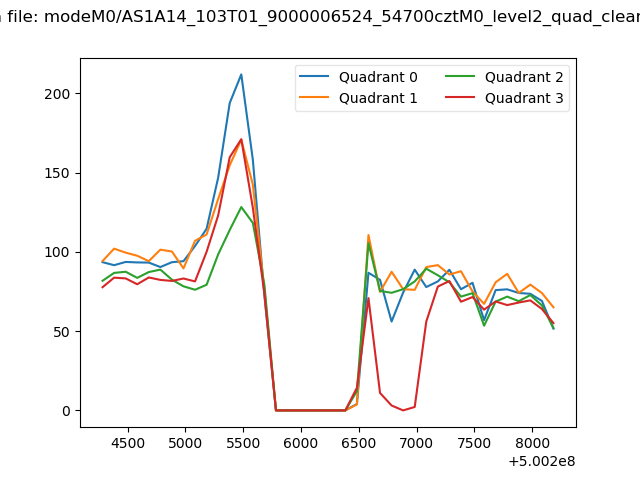
| Quadrant-wise count rates Data is divided into 100 sec bins |
 |
|
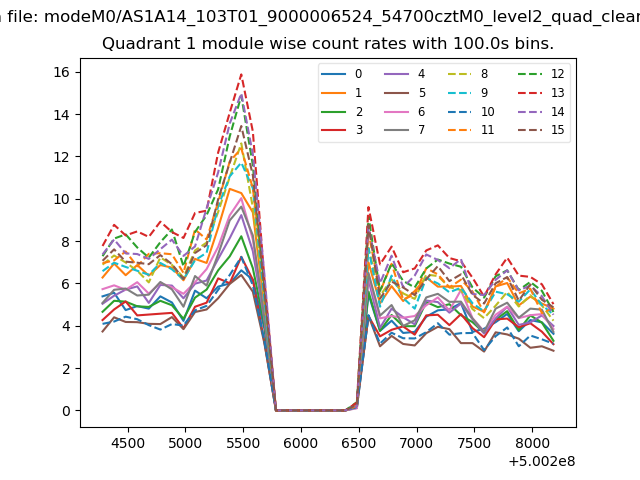
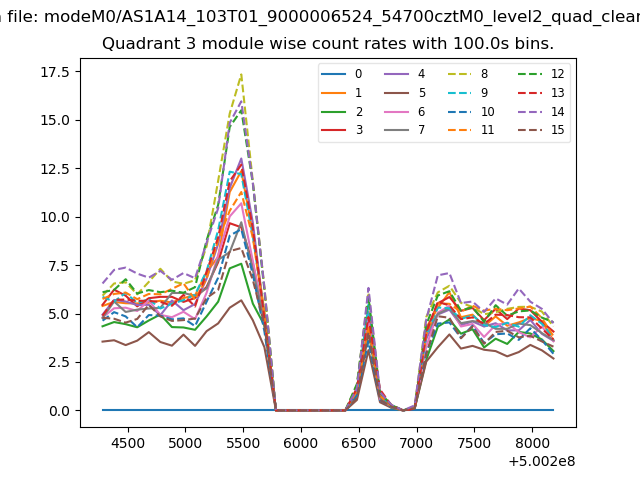
| Module-wise count rates for Quadrant A Data is divided into 100 sec bins |
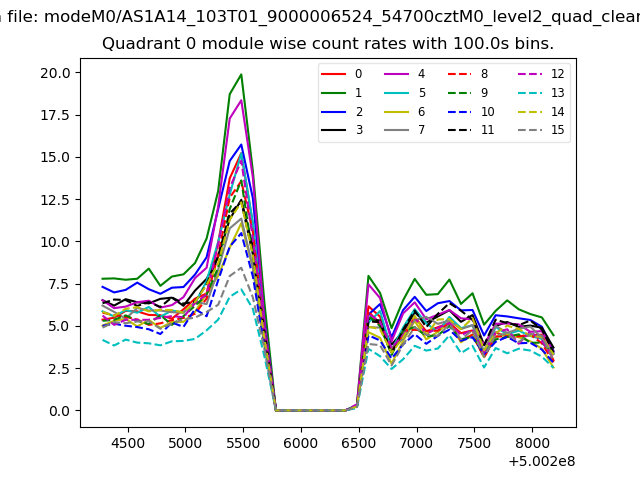 |
 |
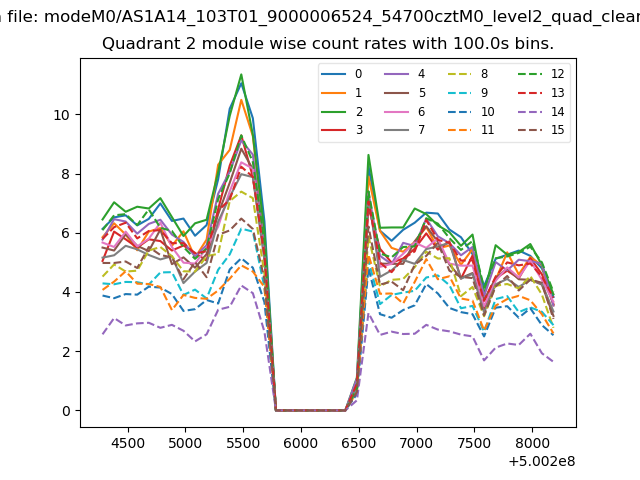
| Module-wise count rates for Quadrant B Data is divided into 100 sec bins |
 |
 |
| Module-wise count rates for Quadrant C Data is divided into 100 sec bins |
 |
 |
| Module-wise count rates for Quadrant D Data is divided into 100 sec bins |
 |
 |
| Parameter | Plot |
|---|---|
| CZT HV Monitor | 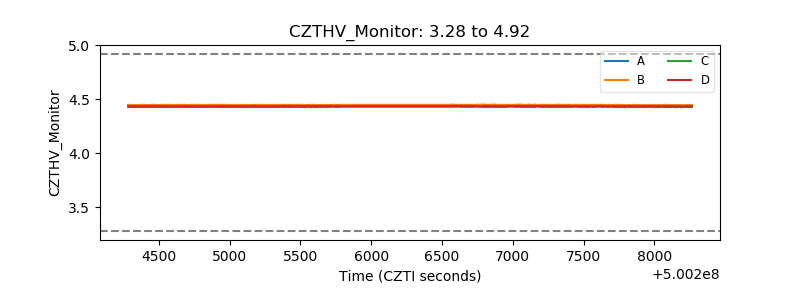 |
| D_VDD | 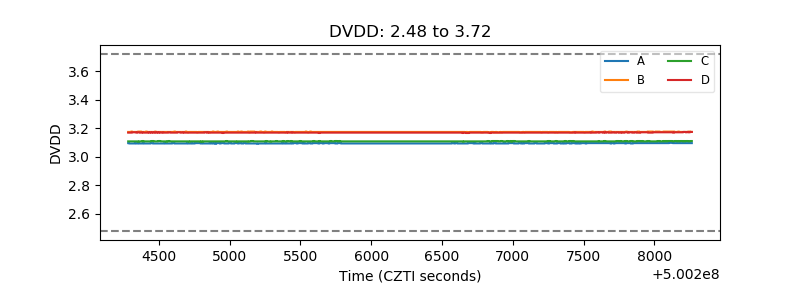 |
| Temperature 1 | 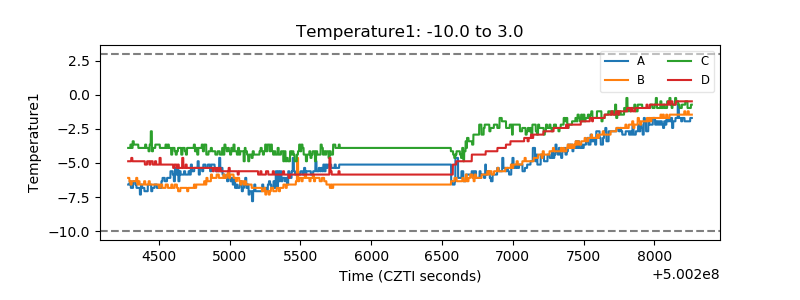 |
| Veto HV Monitor | 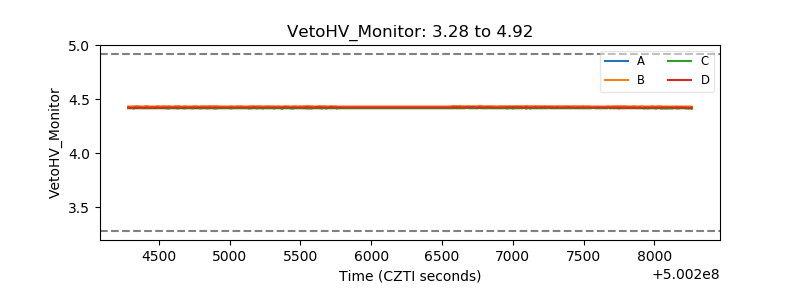 |
| Veto LLD | 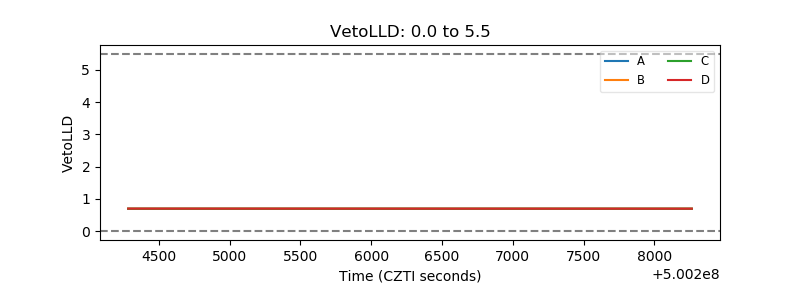 |
| Alpha Counter | 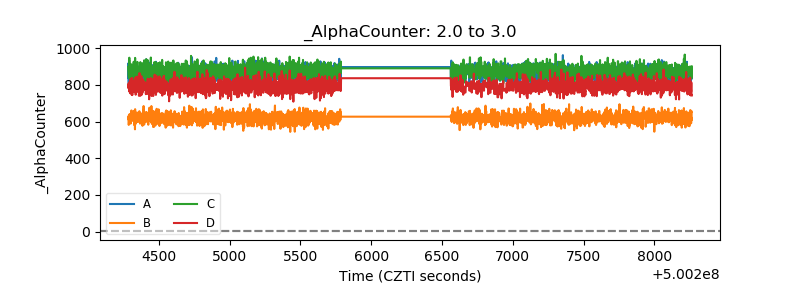 |
| _CPM_Rate | 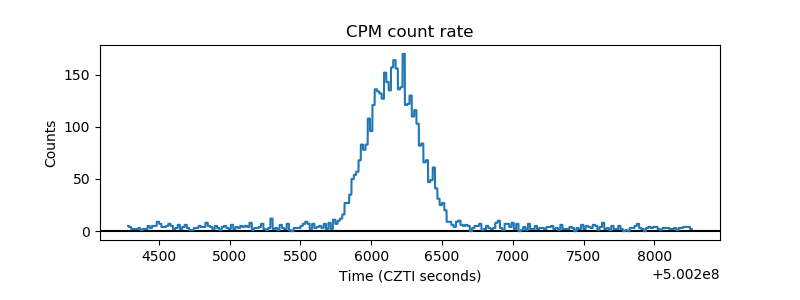 |
| CZT Counter | 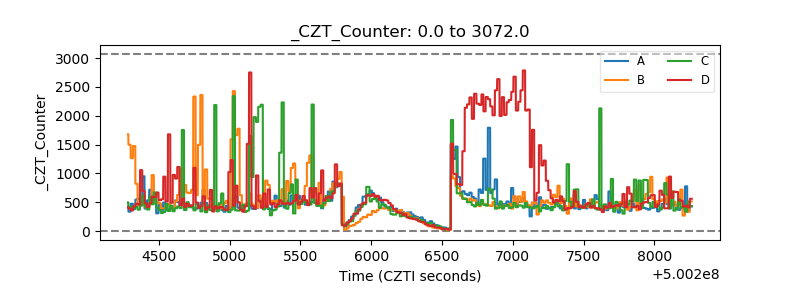 |
| +2.5 Volts monitor |  |
| +5 Volts monitor | 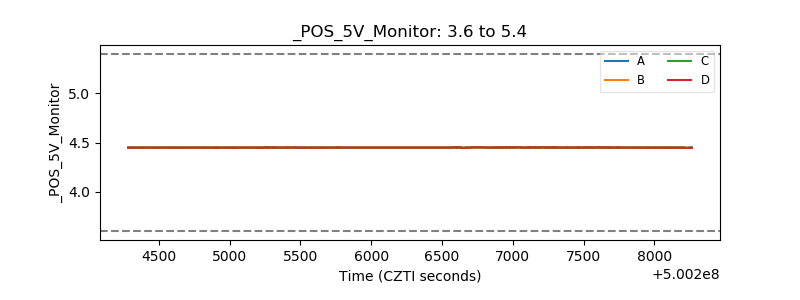 |
| _ROLL_ROT | 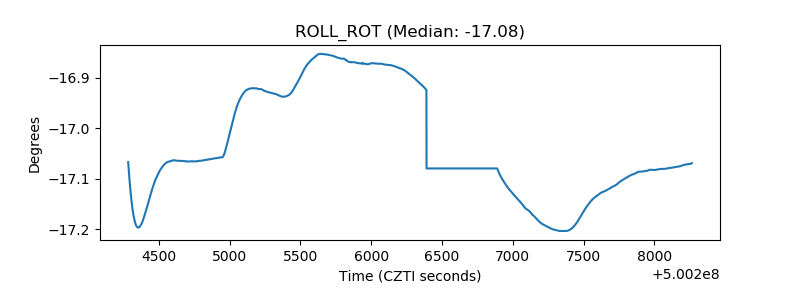 |
| _Roll_DEC | 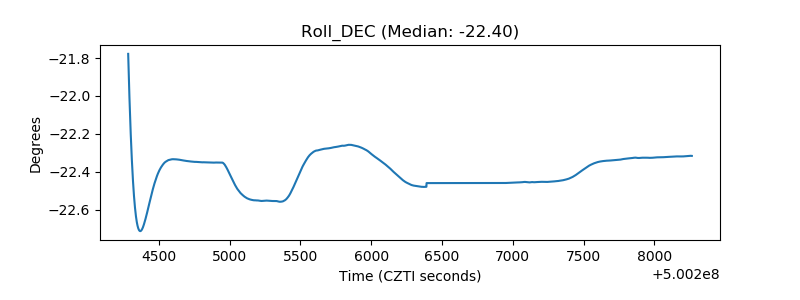 |
| _Roll_RA | 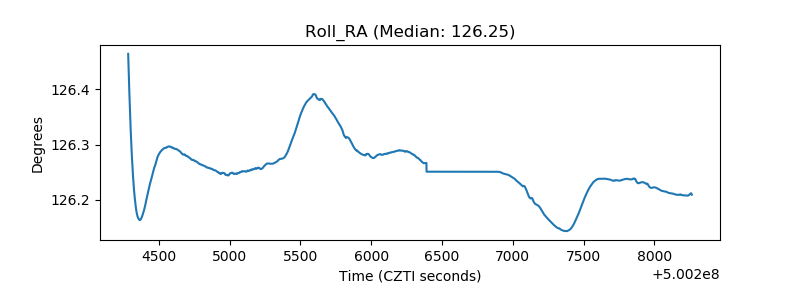 |
| Veto Counter | 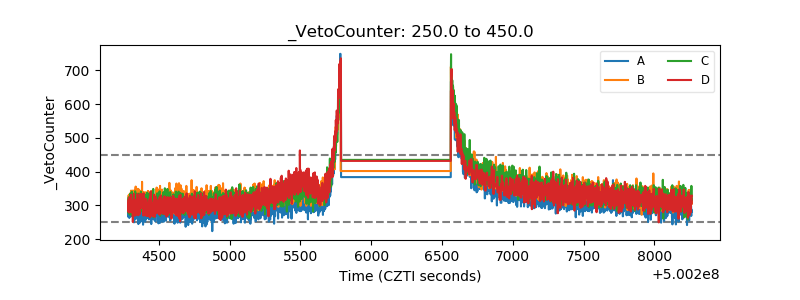 |