| Param | Original file | Final file |
|---|---|---|
| Filename | modeM0/AS1A14_103T01_9000006524_54703cztM0_level2.fits | modeM0/AS1A14_103T01_9000006524_54703cztM0_level2_quad_clean.evt |
| Size (bytes) | 567,953,280 | 87,416,640 |
| Size | 541.6 MB | 83.4 MB |
| Events in quadrant A | 4,143,996 | 585,742 |
| Events in quadrant B | 4,572,583 | 625,224 |
| Events in quadrant C | 3,565,228 | 578,212 |
| Events in quadrant D | 8,248,977 | 414,648 |
| Mode SS | |||
|---|---|---|---|
| Quadrant | BADHDUFLAG | Total packets | Discarded packets |
| A | 0 | 128 | 0 |
| B | 0 | 128 | 0 |
| C | 0 | 128 | 0 |
| D | 0 | 128 | 0 |
| Mode M0 | |||
|---|---|---|---|
| Quadrant | BADHDUFLAG | Total packets | Discarded packets |
| A | 0 | 16749 | 1 |
| B | 0 | 17916 | 1 |
| C | 0 | 15301 | 1 |
| D | 0 | 28949 | 1 |
| Mode M9 | |||
|---|---|---|---|
| Quadrant | BADHDUFLAG | Total packets | Discarded packets |
| A | 0 | 11 | 0 |
| B | 0 | 11 | 0 |
| C | 0 | 11 | 0 |
| D | 0 | 11 | 0 |
| Quadrant | Total seconds | Saturated seconds | Saturation percentage |
|---|---|---|---|
| A | 6350 | 348 | 5.480315% |
| B | 6350 | 335 | 5.275591% |
| C | 6350 | 102 | 1.606299% |
| D | 6351 | 1847 | 29.082034% |
Noise dominated data is calculated using 1-second bins in cleaned event files. If a bin has >2000 counts, and if more than 50% of those come from <1% of pixels, then it is considered to be noise-dominated and hence unusable.
| Quadrant | # 1 sec bins | Bins with >0 counts | Bins with >2000 counts | High rate bins dominated by noise | Noise dominated (total time) | Noise dominated (detector-on time) | Marked lightcurve |
|---|---|---|---|---|---|---|---|
| A | 7450 | 6351 | 238 | 238 | 3.19% | 3.75% | 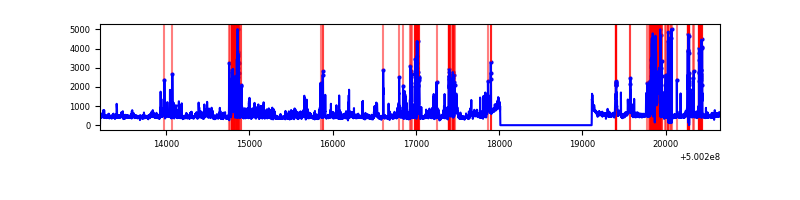 |
| B | 7450 | 6351 | 201 | 201 | 2.70% | 3.16% | 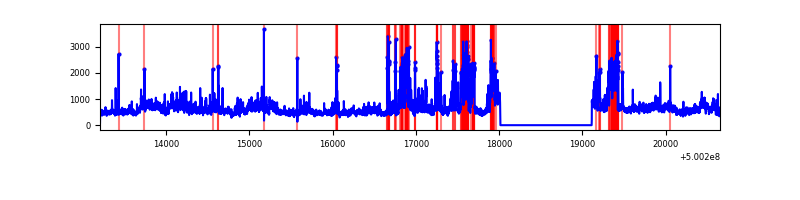 |
| C | 7450 | 6351 | 67 | 67 | 0.90% | 1.05% | 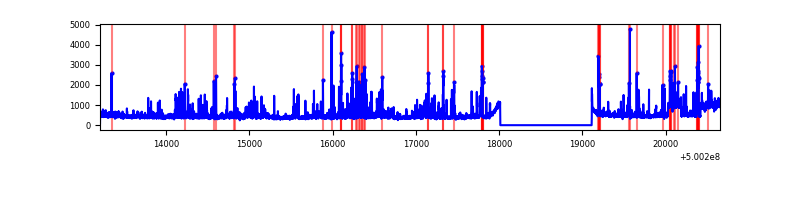 |
| D | 7451 | 6352 | 1560 | 1560 | 20.94% | 24.56% | 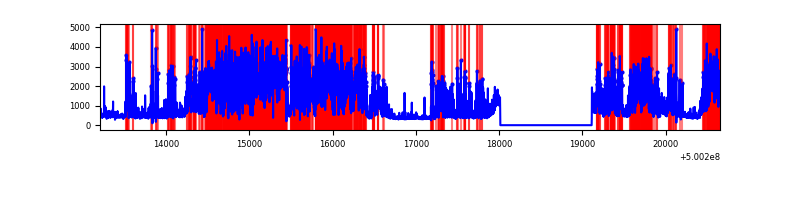 |
Top three noisy pixels from each quadrant. If the there are fewer than three noisy pixels in the level2.evt file, extra rows are filled as -1
| Pixel properties | Quadrant properties | ||||||
|---|---|---|---|---|---|---|---|
| Quadrant | DetID | PixID | Counts | Sigma | Mean | Median | Sigma |
| A | 0 | 8 | 499315 | 3083.57 | 653 | 640 | 161.7 |
| A | 13 | 248 | 467514 | 2886.92 | 653 | 640 | 161.7 |
| A | 3 | 14 | 234581 | 1446.58 | 653 | 640 | 161.7 |
| B | 2 | 249 | 916185 | 6634.18 | 648 | 627 | 138.0 |
| B | 7 | 0 | 817697 | 5920.53 | 648 | 627 | 138.0 |
| B | 0 | 213 | 132221 | 953.54 | 648 | 627 | 138.0 |
| C | 4 | 5 | 370894 | 2062.08 | 644 | 639 | 179.6 |
| C | 13 | 3 | 266059 | 1478.22 | 644 | 639 | 179.6 |
| C | 14 | 254 | 154606 | 857.5 | 644 | 639 | 179.6 |
| D | 11 | 129 | 4916021 | 29972.74 | 568 | 542 | 164.0 |
| D | 3 | 224 | 323078 | 1966.7 | 568 | 542 | 164.0 |
| D | 3 | 12 | 197847 | 1203.09 | 568 | 542 | 164.0 |
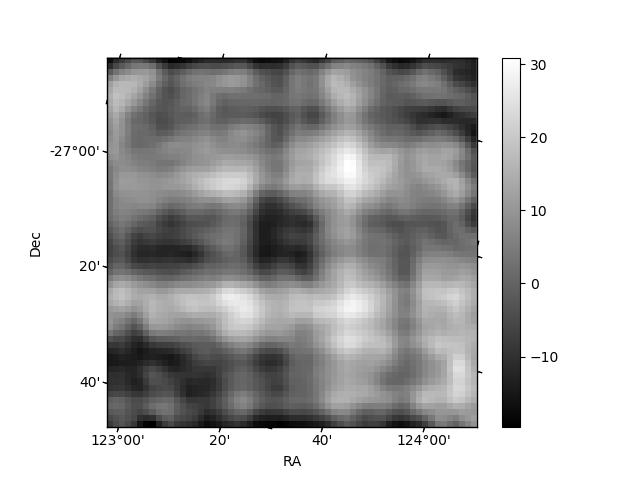
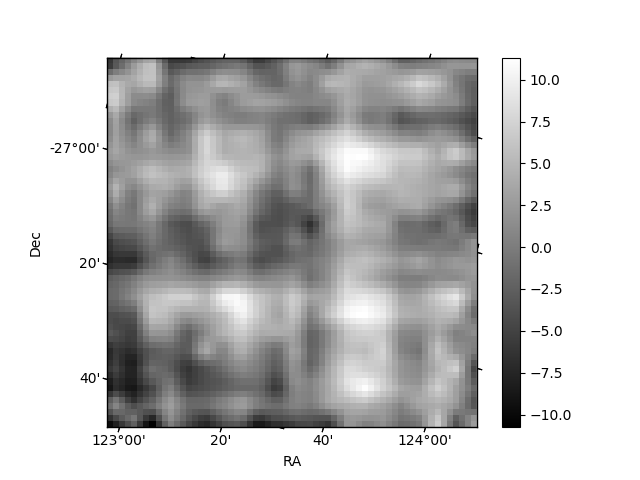
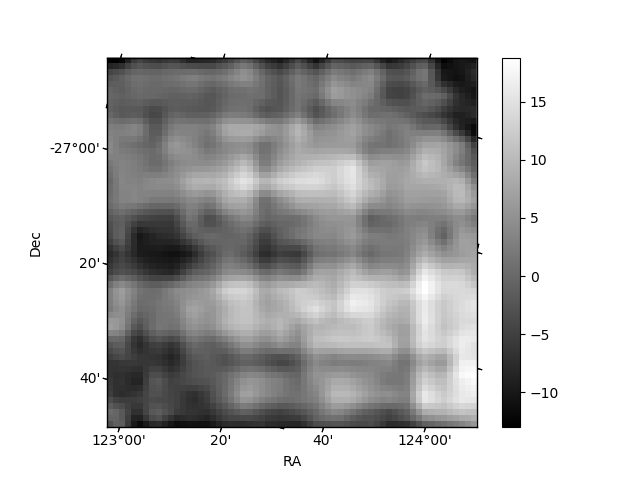
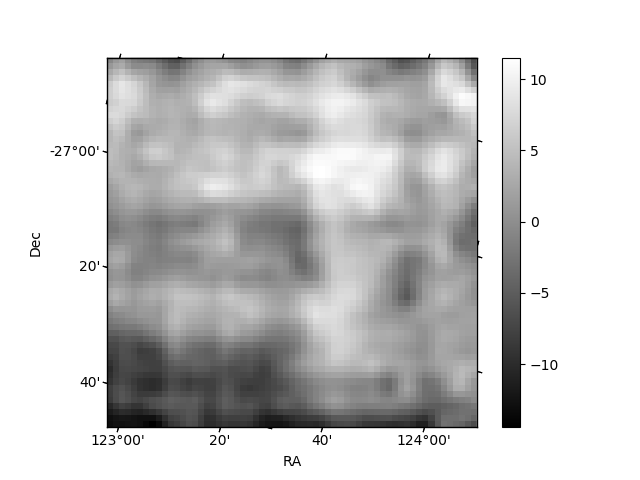
Histogram calculated using DETX and DETY for each event in the final _common_clean file
| Quadrant A | 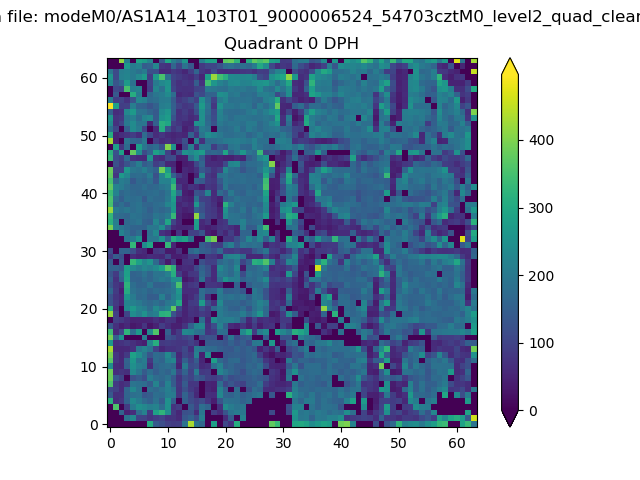 |
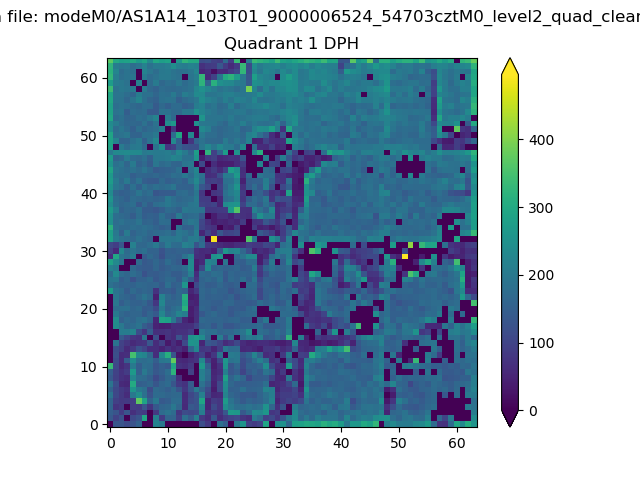 |
Quadrant B |
|---|---|---|---|
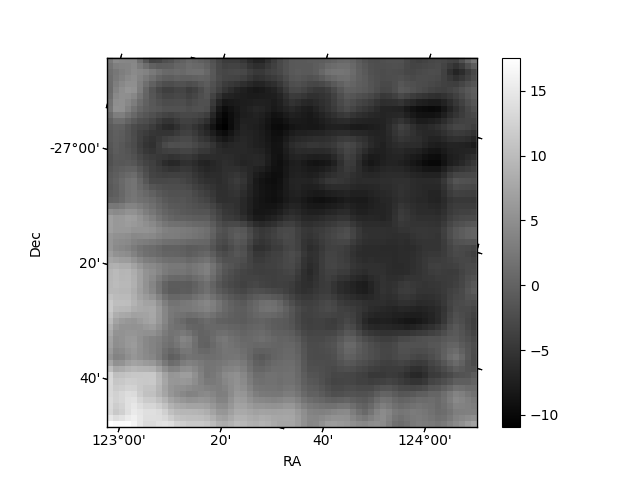
| Quadrant D | 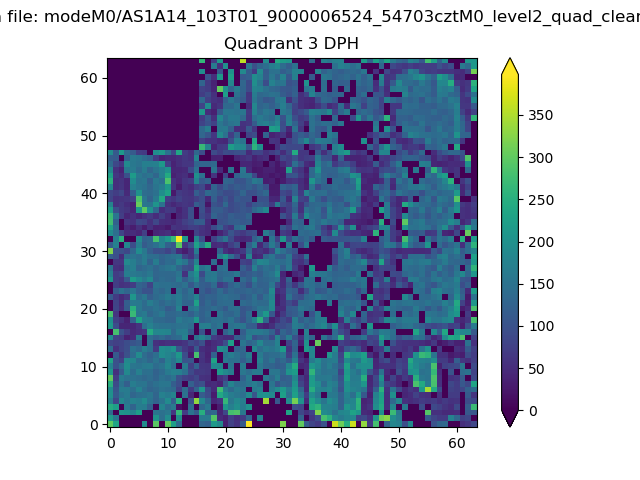 |
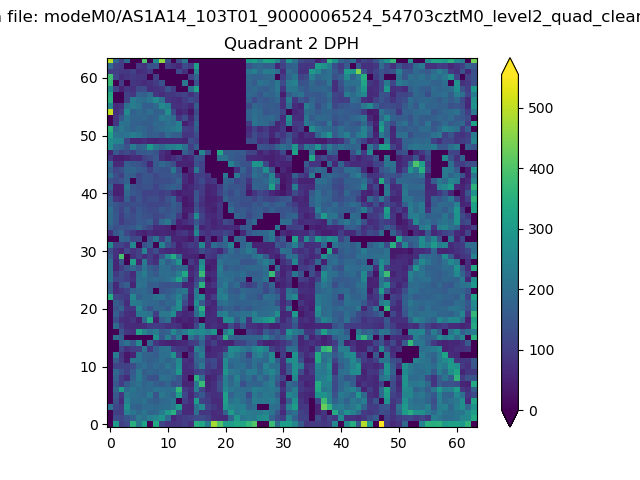 |
Quadrant C |
| Plot type | Count rate plots | Images |
|---|---|---|
| Comparison with Poisson distribution Blue bars denote a histogram of data divided into 1 sec bins. Red curve is a Poisson curve with rate = median count rate of data. |
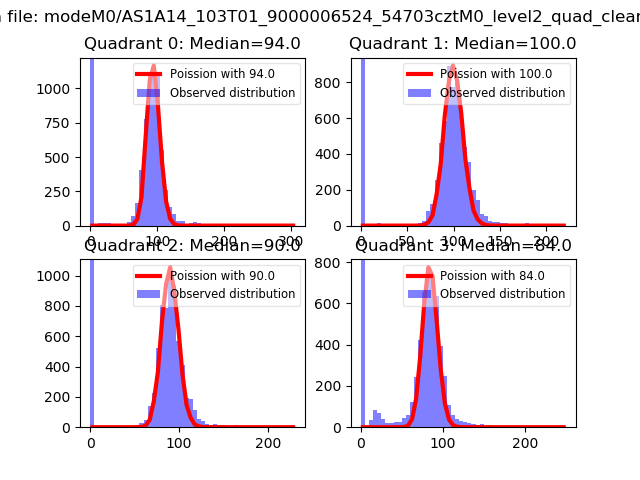 |
 |
| Quadrant-wise count rates Data is divided into 100 sec bins |
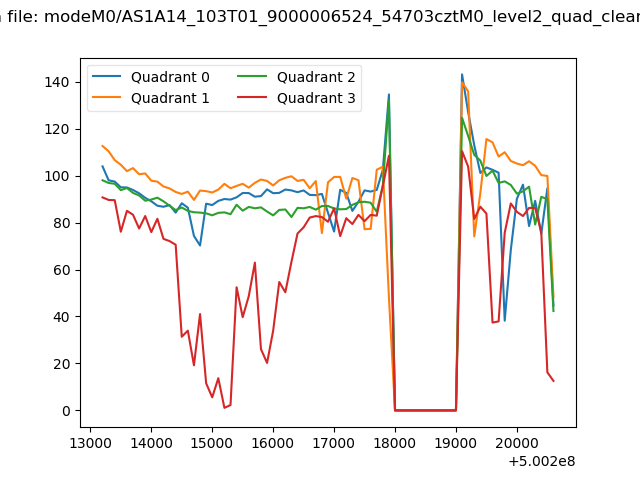 |
|
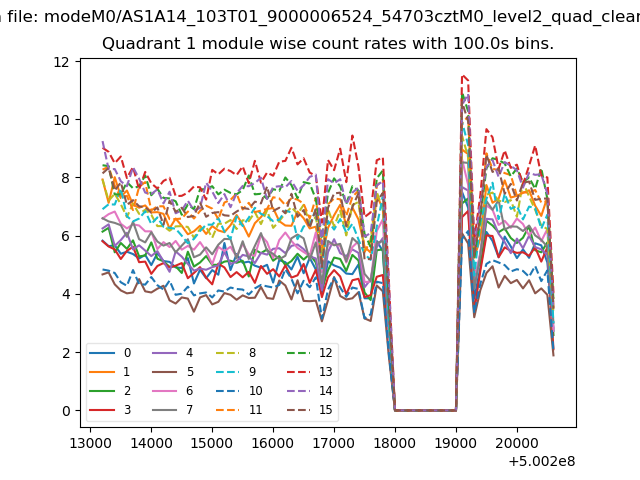
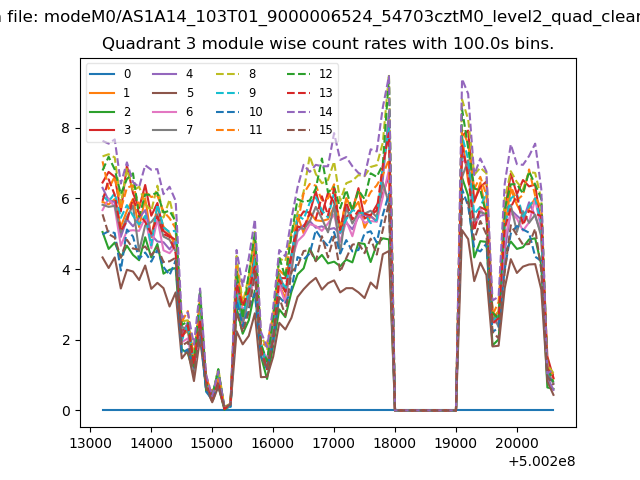
| Module-wise count rates for Quadrant A Data is divided into 100 sec bins |
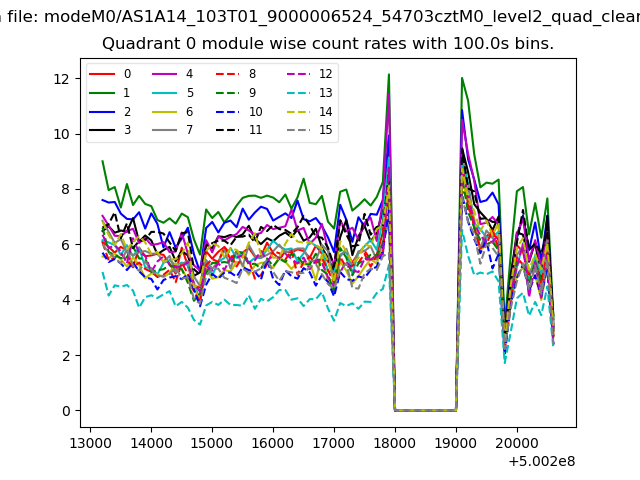 |
 |
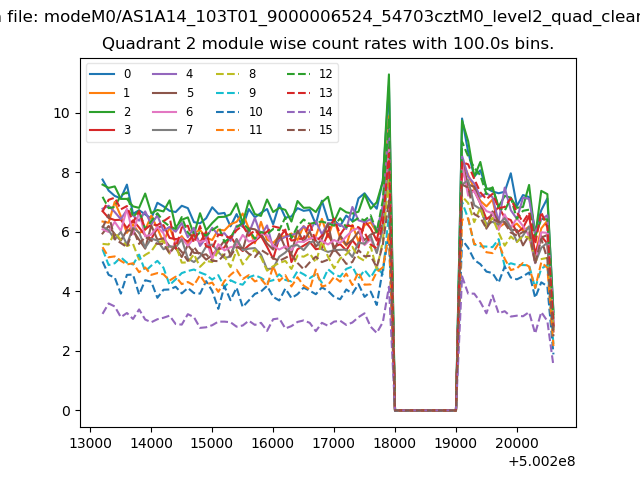
| Module-wise count rates for Quadrant B Data is divided into 100 sec bins |
 |
 |
| Module-wise count rates for Quadrant C Data is divided into 100 sec bins |
 |
 |
| Module-wise count rates for Quadrant D Data is divided into 100 sec bins |
 |
 |
| Parameter | Plot |
|---|---|
| CZT HV Monitor | 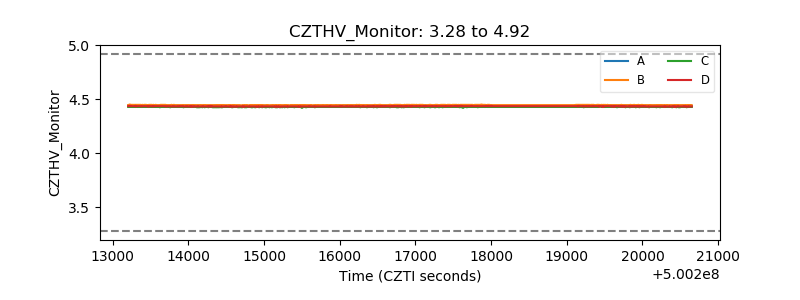 |
| D_VDD | 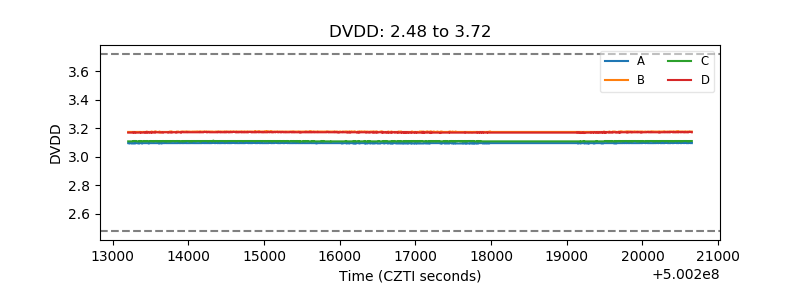 |
| Temperature 1 | 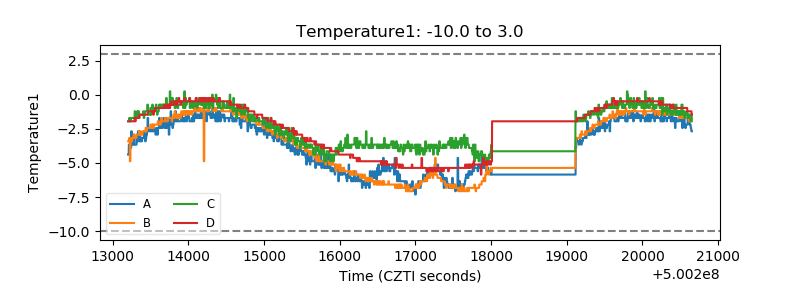 |
| Veto HV Monitor | 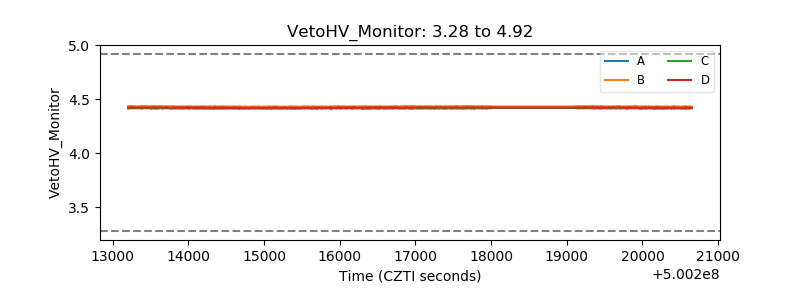 |
| Veto LLD | 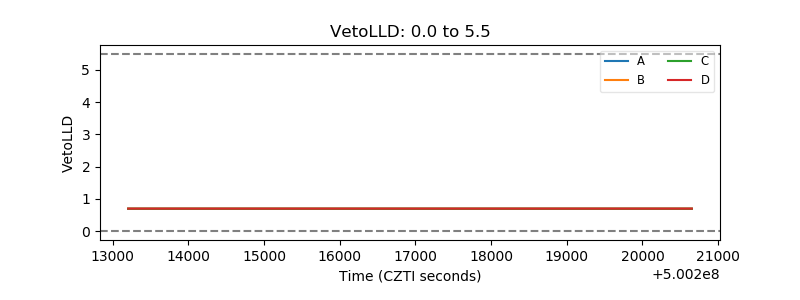 |
| Alpha Counter | 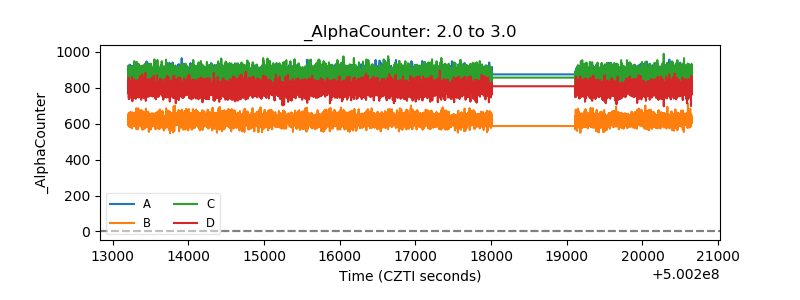 |
| _CPM_Rate | 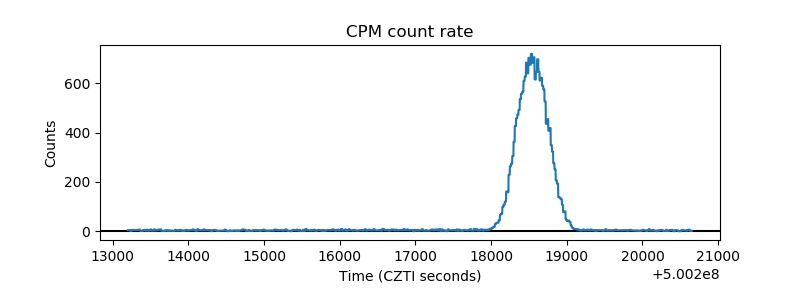 |
| CZT Counter | 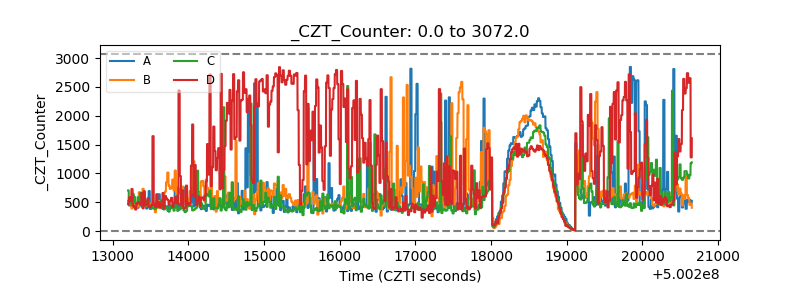 |
| +2.5 Volts monitor |  |
| +5 Volts monitor |  |
| _ROLL_ROT | 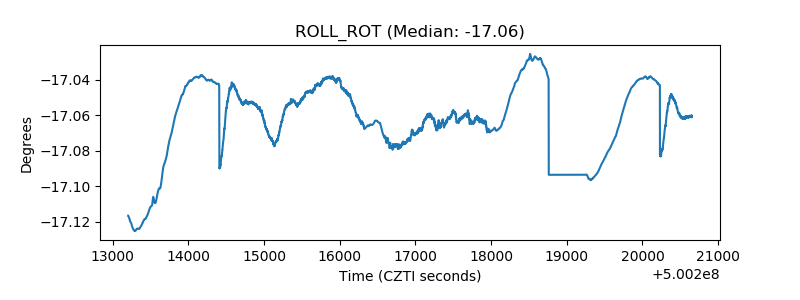 |
| _Roll_DEC | 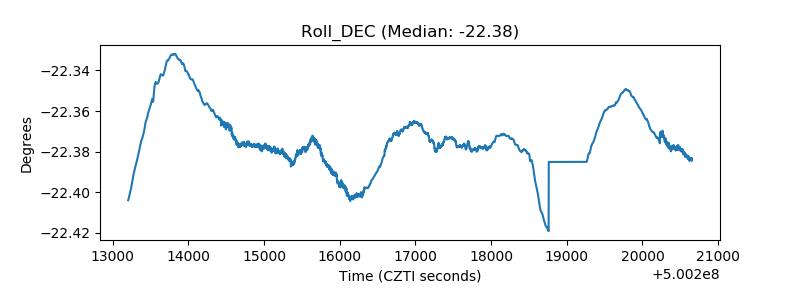 |
| _Roll_RA | 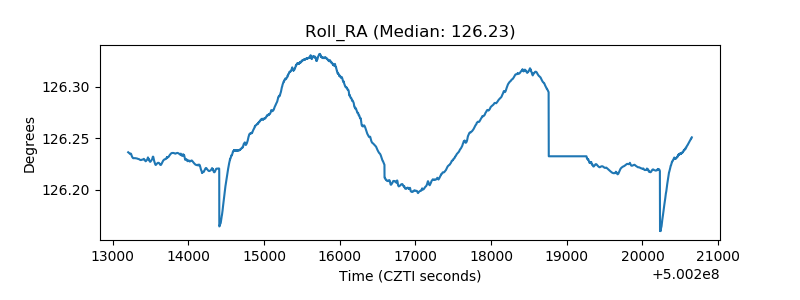 |
| Veto Counter | 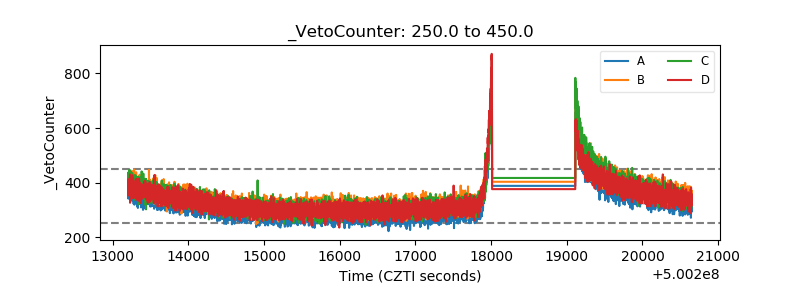 |