| Param | Original file | Final file |
|---|---|---|
| Filename | modeM0/AS1A14_103T01_9000006524_54707cztM0_level2.fits | modeM0/AS1A14_103T01_9000006524_54707cztM0_level2_quad_clean.evt |
| Size (bytes) | 518,060,160 | 88,660,800 |
| Size | 494.1 MB | 84.6 MB |
| Events in quadrant A | 3,102,727 | 614,172 |
| Events in quadrant B | 5,809,996 | 578,078 |
| Events in quadrant C | 3,375,426 | 582,149 |
| Events in quadrant D | 6,386,474 | 459,869 |
| Mode SS | |||
|---|---|---|---|
| Quadrant | BADHDUFLAG | Total packets | Discarded packets |
| A | 0 | 130 | 0 |
| B | 0 | 130 | 0 |
| C | 0 | 130 | 0 |
| D | 0 | 130 | 0 |
| Mode M0 | |||
|---|---|---|---|
| Quadrant | BADHDUFLAG | Total packets | Discarded packets |
| A | 0 | 13808 | 1 |
| B | 0 | 21850 | 1 |
| C | 0 | 14773 | 1 |
| D | 0 | 23707 | 1 |
| Mode M9 | |||
|---|---|---|---|
| Quadrant | BADHDUFLAG | Total packets | Discarded packets |
| A | 0 | 10 | 0 |
| B | 0 | 10 | 0 |
| C | 0 | 10 | 0 |
| D | 0 | 10 | 0 |
| Quadrant | Total seconds | Saturated seconds | Saturation percentage |
|---|---|---|---|
| A | 6459 | 71 | 1.099241% |
| B | 6460 | 979 | 15.154799% |
| C | 6460 | 79 | 1.222910% |
| D | 6460 | 1210 | 18.730650% |
Noise dominated data is calculated using 1-second bins in cleaned event files. If a bin has >2000 counts, and if more than 50% of those come from <1% of pixels, then it is considered to be noise-dominated and hence unusable.
| Quadrant | # 1 sec bins | Bins with >0 counts | Bins with >2000 counts | High rate bins dominated by noise | Noise dominated (total time) | Noise dominated (detector-on time) | Marked lightcurve |
|---|---|---|---|---|---|---|---|
| A | 7439 | 6460 | 13 | 13 | 0.17% | 0.20% | 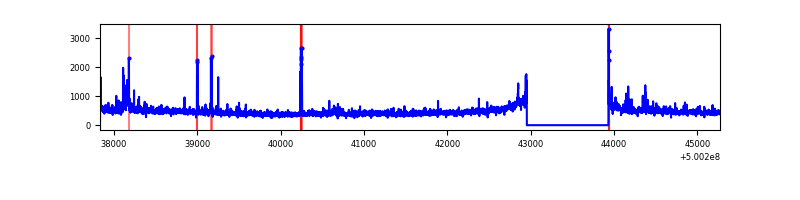 |
| B | 7440 | 6460 | 791 | 791 | 10.63% | 12.24% | 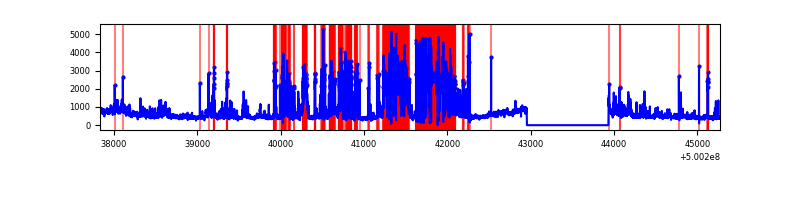 |
| C | 7440 | 6461 | 36 | 36 | 0.48% | 0.56% | 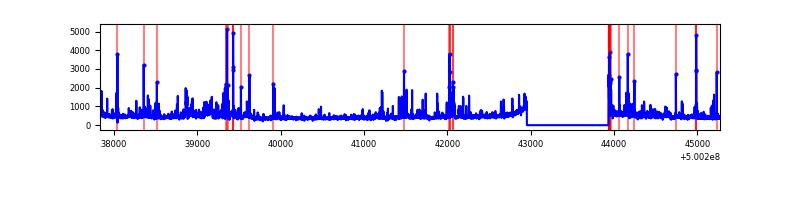 |
| D | 7440 | 6460 | 963 | 963 | 12.94% | 14.91% | 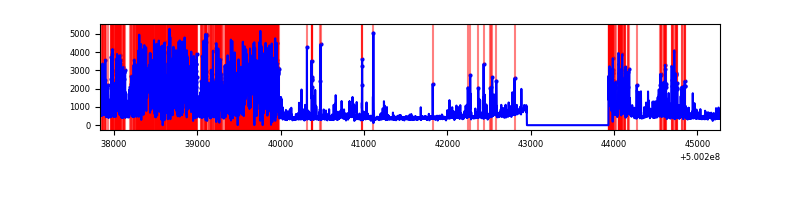 |
Top three noisy pixels from each quadrant. If the there are fewer than three noisy pixels in the level2.evt file, extra rows are filled as -1
| Pixel properties | Quadrant properties | ||||||
|---|---|---|---|---|---|---|---|
| Quadrant | DetID | PixID | Counts | Sigma | Mean | Median | Sigma |
| A | 3 | 14 | 95080 | 557.23 | 679 | 662 | 169.4 |
| A | 4 | 3 | 86317 | 505.52 | 679 | 662 | 169.4 |
| A | 11 | 3 | 75475 | 441.53 | 679 | 662 | 169.4 |
| B | 2 | 249 | 2740348 | 20221.58 | 632 | 609 | 135.5 |
| B | 7 | 0 | 142645 | 1048.35 | 632 | 609 | 135.5 |
| B | 0 | 213 | 82217 | 602.34 | 632 | 609 | 135.5 |
| C | 3 | 242 | 306699 | 1686.4 | 655 | 649 | 181.5 |
| C | 14 | 254 | 104719 | 573.45 | 655 | 649 | 181.5 |
| C | 13 | 3 | 96277 | 526.93 | 655 | 649 | 181.5 |
| D | 15 | 94 | 2462281 | 14088.26 | 595 | 565 | 174.7 |
| D | 11 | 129 | 702737 | 4018.49 | 595 | 565 | 174.7 |
| D | 3 | 12 | 429788 | 2456.42 | 595 | 565 | 174.7 |
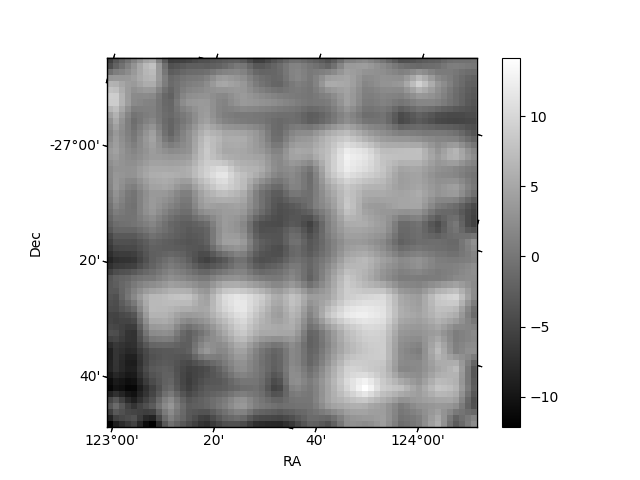
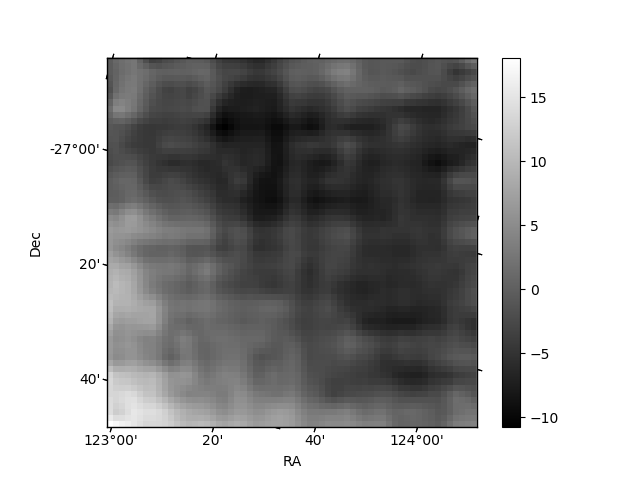
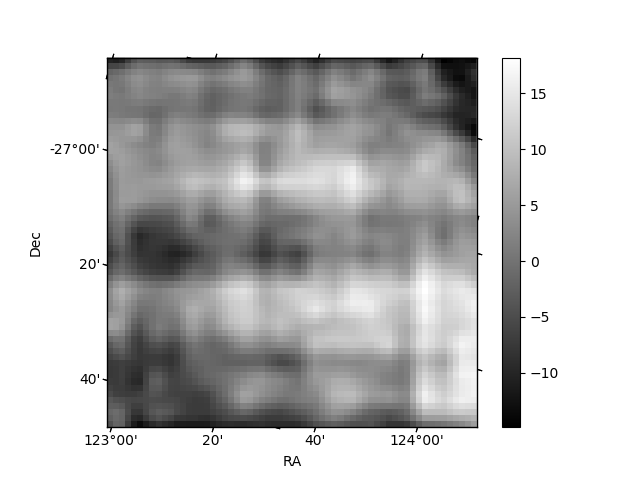
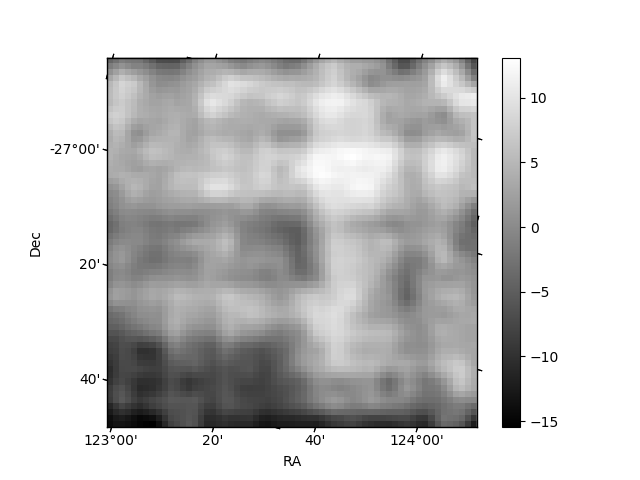
Histogram calculated using DETX and DETY for each event in the final _common_clean file
| Quadrant A | 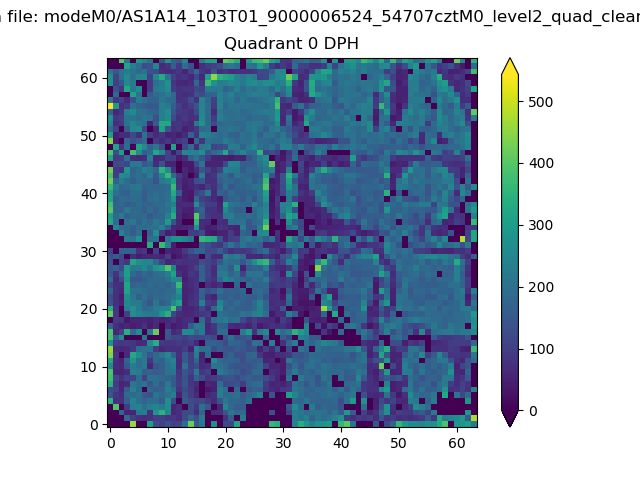 |
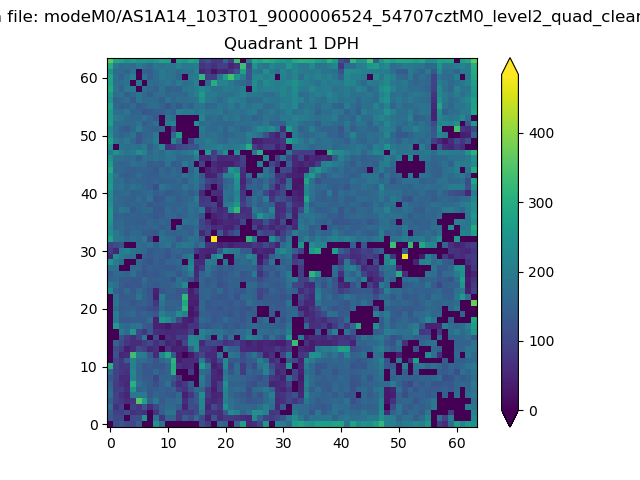 |
Quadrant B |
|---|---|---|---|
| Quadrant D | 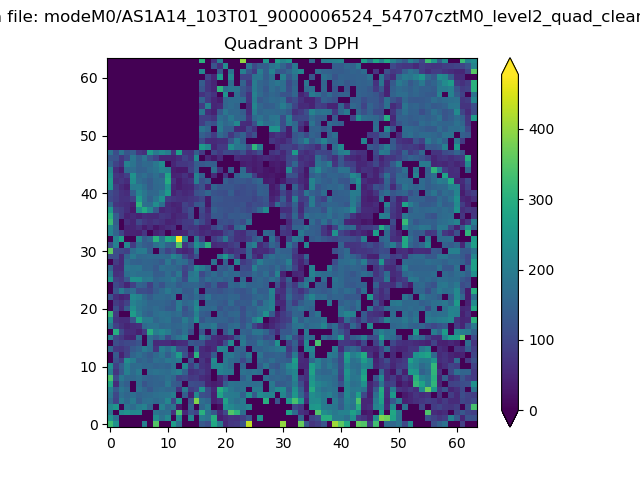 |
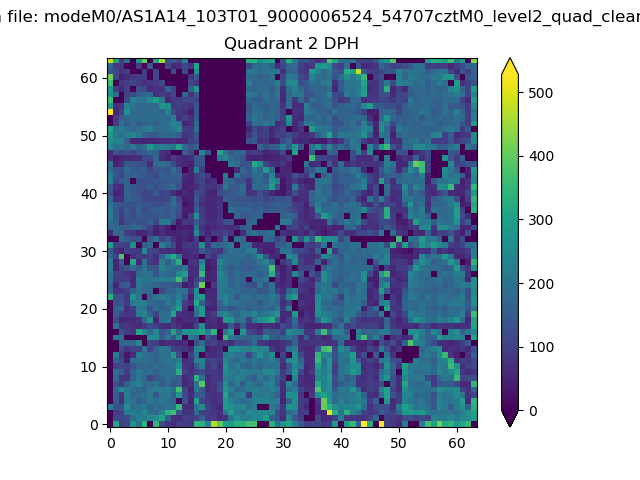 |
Quadrant C |
| Plot type | Count rate plots | Images |
|---|---|---|
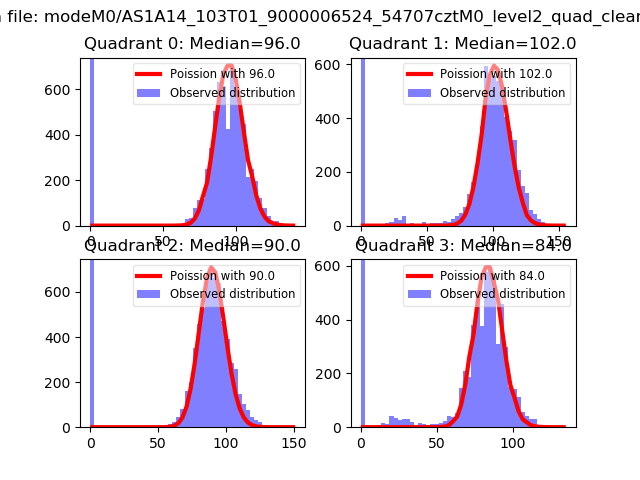
| Comparison with Poisson distribution Blue bars denote a histogram of data divided into 1 sec bins. Red curve is a Poisson curve with rate = median count rate of data. |
 |
 |
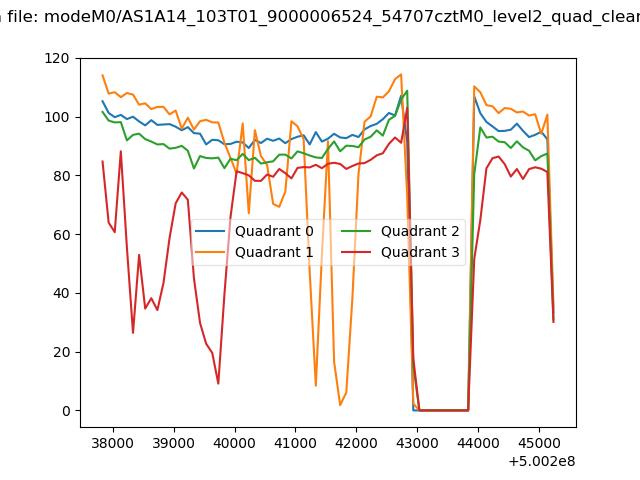
| Quadrant-wise count rates Data is divided into 100 sec bins |
 |
|
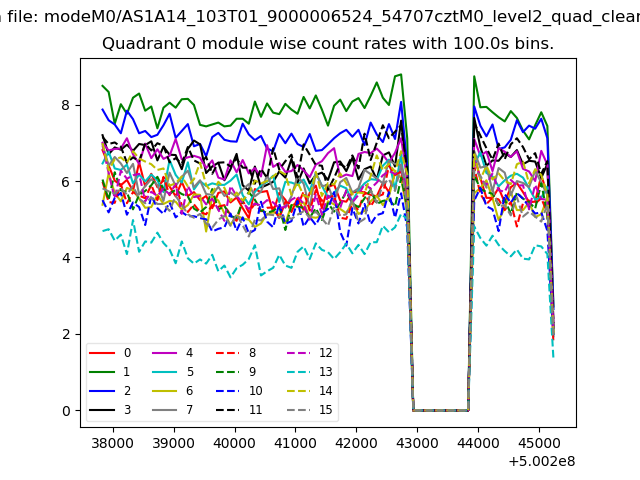
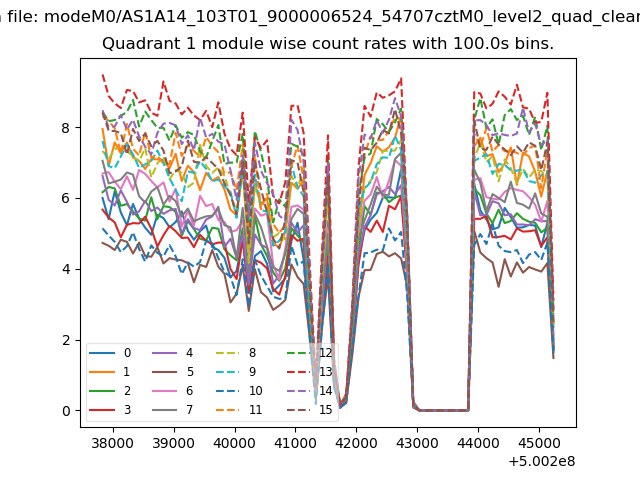
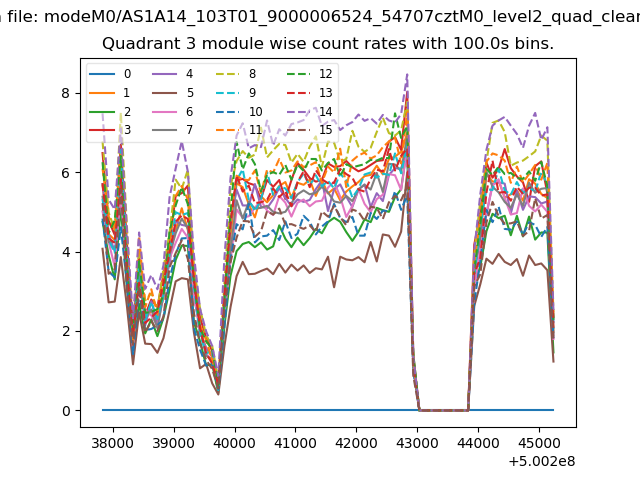
| Module-wise count rates for Quadrant A Data is divided into 100 sec bins |
 |
 |
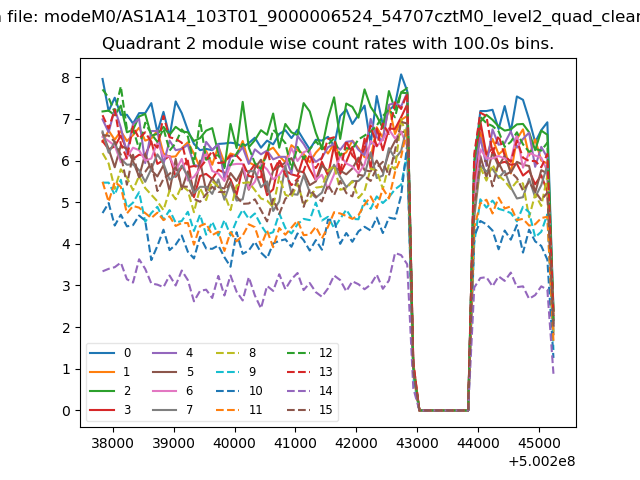
| Module-wise count rates for Quadrant B Data is divided into 100 sec bins |
 |
 |
| Module-wise count rates for Quadrant C Data is divided into 100 sec bins |
 |
 |
| Module-wise count rates for Quadrant D Data is divided into 100 sec bins |
 |
 |
| Parameter | Plot |
|---|---|
| CZT HV Monitor | 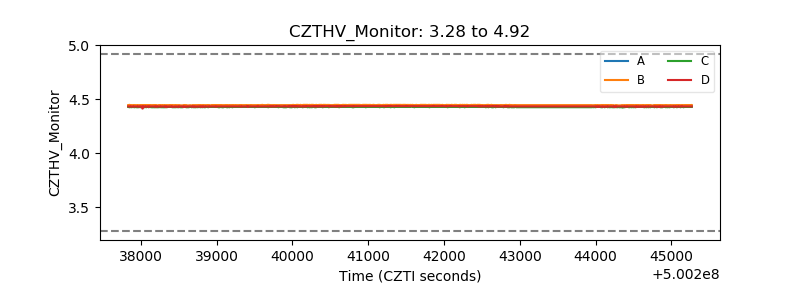 |
| D_VDD | 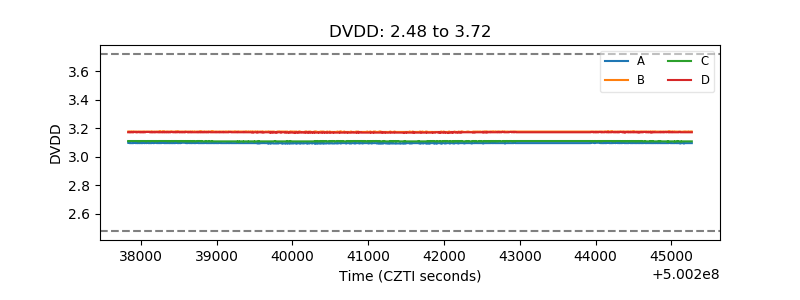 |
| Temperature 1 | 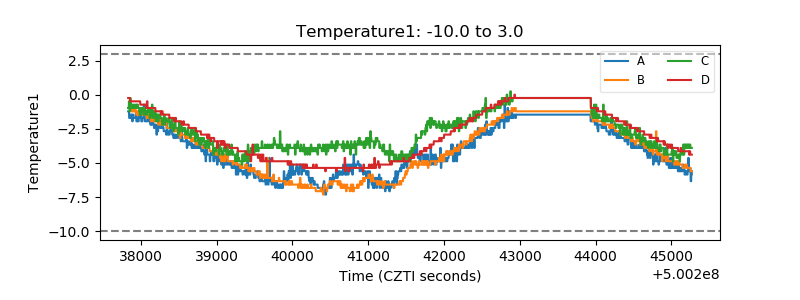 |
| Veto HV Monitor | 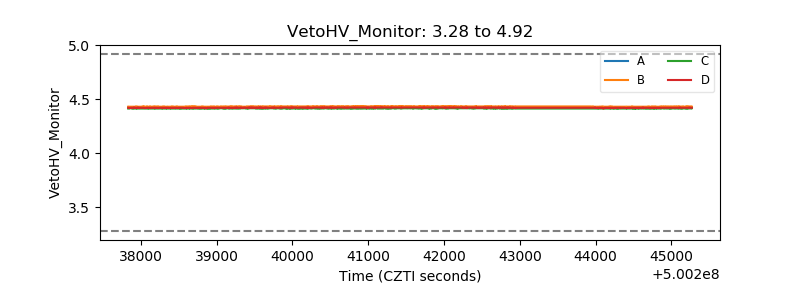 |
| Veto LLD | 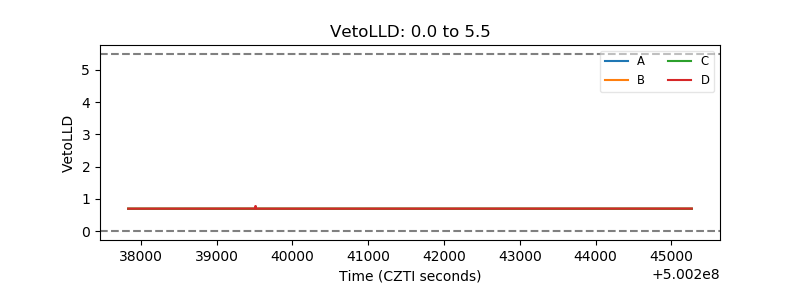 |
| Alpha Counter | 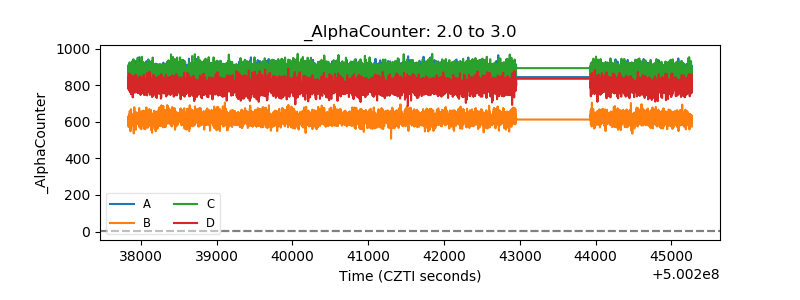 |
| _CPM_Rate | 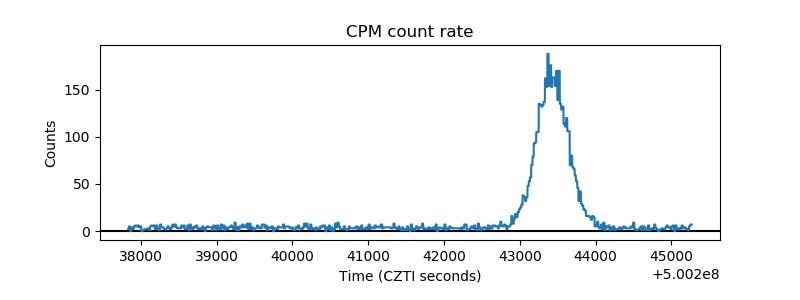 |
| CZT Counter | 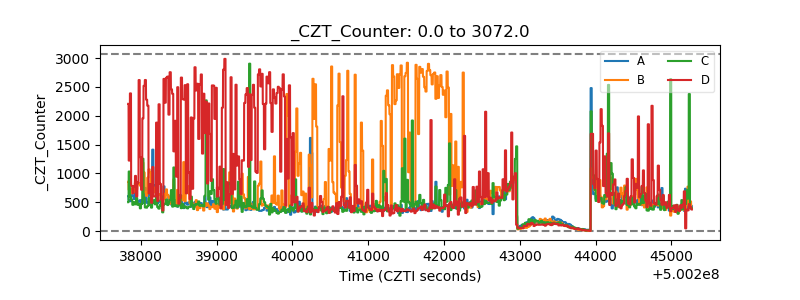 |
| +2.5 Volts monitor | 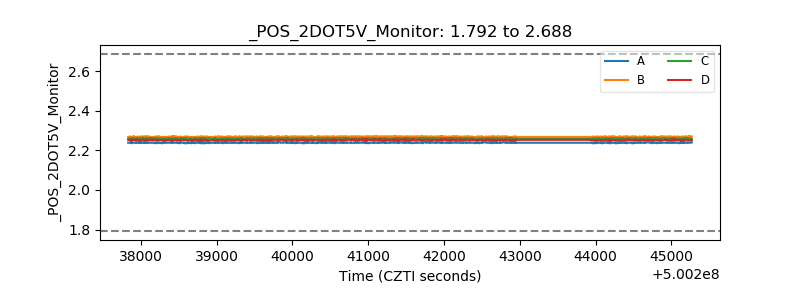 |
| +5 Volts monitor |  |
| _ROLL_ROT | 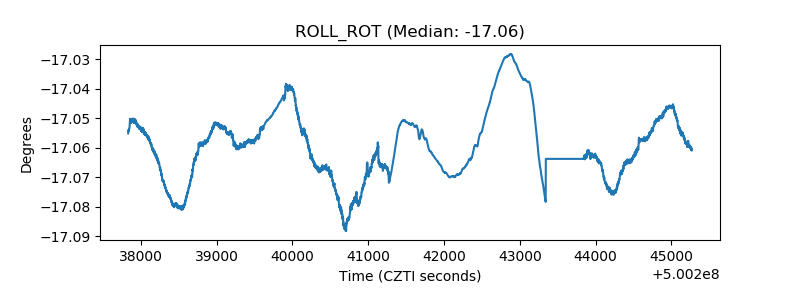 |
| _Roll_DEC | 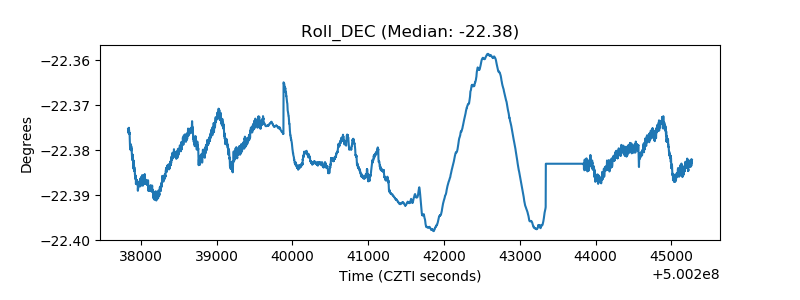 |
| _Roll_RA | 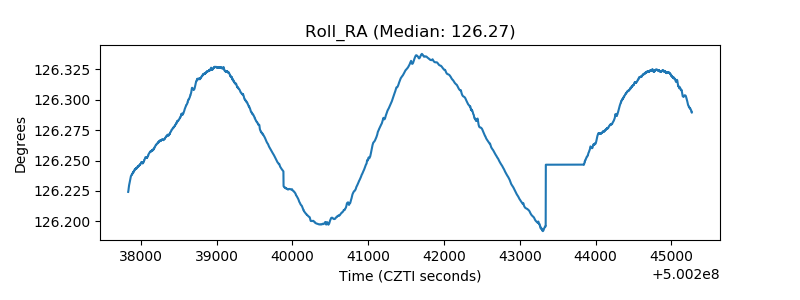 |
| Veto Counter | 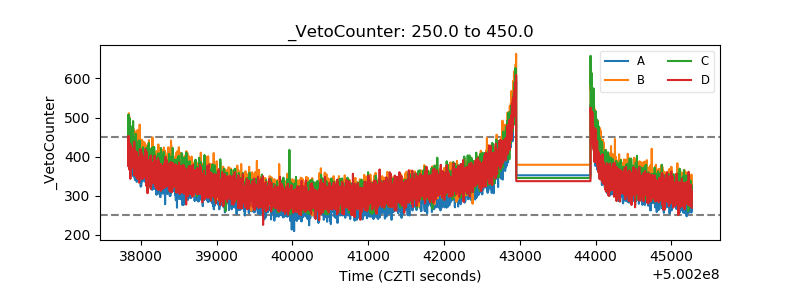 |