| Param | Original file | Final file |
|---|---|---|
| Filename | modeM0/AS1A14_103T01_9000006524_54708cztM0_level2.fits | modeM0/AS1A14_103T01_9000006524_54708cztM0_level2_quad_clean.evt |
| Size (bytes) | 437,313,600 | 101,905,920 |
| Size | 417.1 MB | 97.2 MB |
| Events in quadrant A | 3,369,990 | 670,299 |
| Events in quadrant B | 4,835,519 | 686,422 |
| Events in quadrant C | 3,475,784 | 637,855 |
| Events in quadrant D | 3,949,974 | 592,761 |
| Mode SS | |||
|---|---|---|---|
| Quadrant | BADHDUFLAG | Total packets | Discarded packets |
| A | 0 | 146 | 0 |
| B | 0 | 146 | 0 |
| C | 0 | 146 | 0 |
| D | 0 | 146 | 0 |
| Mode M0 | |||
|---|---|---|---|
| Quadrant | BADHDUFLAG | Total packets | Discarded packets |
| A | 0 | 15392 | 2 |
| B | 0 | 19533 | 2 |
| C | 0 | 15820 | 2 |
| D | 0 | 17250 | 2 |
| Mode M9 | |||
|---|---|---|---|
| Quadrant | BADHDUFLAG | Total packets | Discarded packets |
| A | 0 | 5 | 0 |
| B | 0 | 6 | 0 |
| C | 0 | 6 | 0 |
| D | 0 | 6 | 0 |
| Quadrant | Total seconds | Saturated seconds | Saturation percentage |
|---|---|---|---|
| A | 7154 | 75 | 1.048365% |
| B | 7154 | 483 | 6.751468% |
| C | 7154 | 72 | 1.006430% |
| D | 7154 | 178 | 2.488119% |
Noise dominated data is calculated using 1-second bins in cleaned event files. If a bin has >2000 counts, and if more than 50% of those come from <1% of pixels, then it is considered to be noise-dominated and hence unusable.
| Quadrant | # 1 sec bins | Bins with >0 counts | Bins with >2000 counts | High rate bins dominated by noise | Noise dominated (total time) | Noise dominated (detector-on time) | Marked lightcurve |
|---|---|---|---|---|---|---|---|
| A | 7694 | 7155 | 21 | 21 | 0.27% | 0.29% | 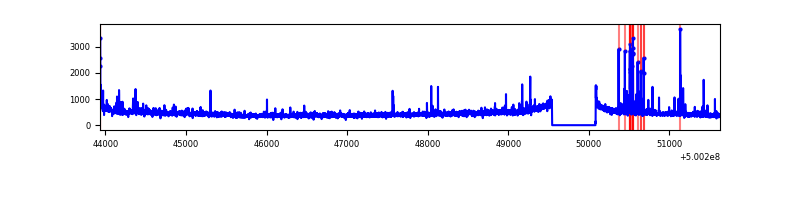 |
| B | 7694 | 7155 | 305 | 305 | 3.96% | 4.26% | 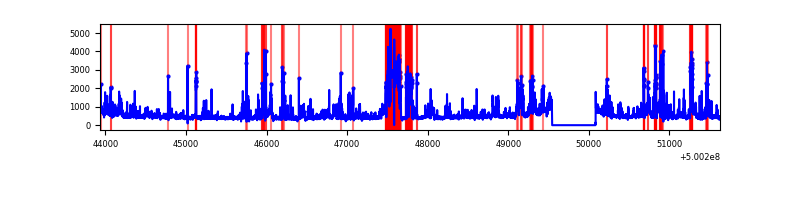 |
| C | 7694 | 7155 | 35 | 35 | 0.45% | 0.49% | 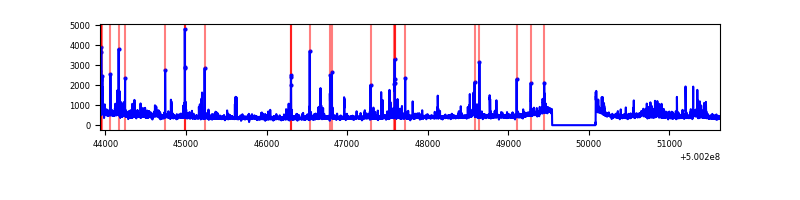 |
| D | 7694 | 7155 | 129 | 129 | 1.68% | 1.80% | 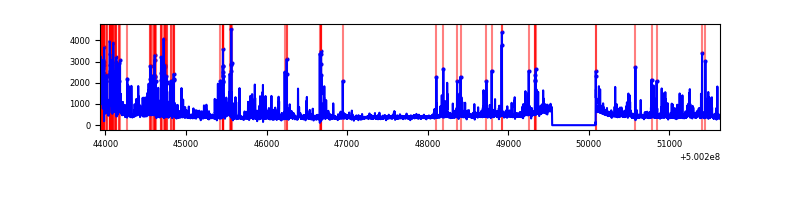 |
Top three noisy pixels from each quadrant. If the there are fewer than three noisy pixels in the level2.evt file, extra rows are filled as -1
| Pixel properties | Quadrant properties | ||||||
|---|---|---|---|---|---|---|---|
| Quadrant | DetID | PixID | Counts | Sigma | Mean | Median | Sigma |
| A | 0 | 8 | 132077 | 705.07 | 744 | 726 | 186.3 |
| A | 11 | 3 | 109170 | 582.11 | 744 | 726 | 186.3 |
| A | 3 | 14 | 95590 | 509.21 | 744 | 726 | 186.3 |
| B | 2 | 249 | 1309023 | 8380.9 | 725 | 698 | 156.1 |
| B | 4 | 171 | 337318 | 2156.33 | 725 | 698 | 156.1 |
| B | 8 | 234 | 84343 | 535.82 | 725 | 698 | 156.1 |
| C | 3 | 242 | 175233 | 879.34 | 724 | 719 | 198.5 |
| C | 14 | 254 | 154071 | 772.7 | 724 | 719 | 198.5 |
| C | 13 | 3 | 71048 | 354.37 | 724 | 719 | 198.5 |
| D | 3 | 12 | 356279 | 1710.12 | 715 | 682 | 207.9 |
| D | 11 | 129 | 268442 | 1287.7 | 715 | 682 | 207.9 |
| D | 15 | 43 | 123502 | 590.66 | 715 | 682 | 207.9 |
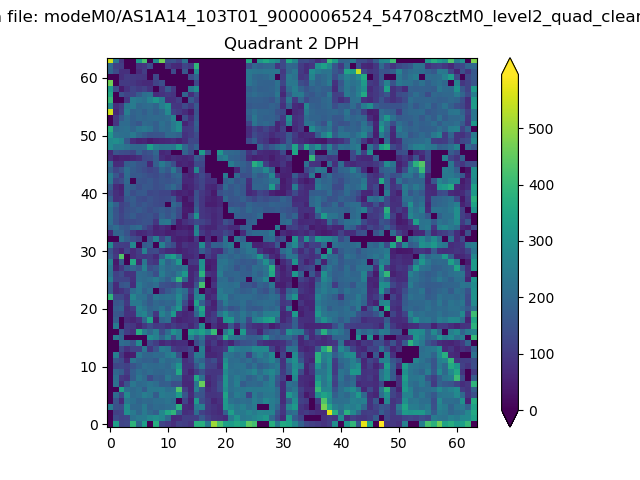
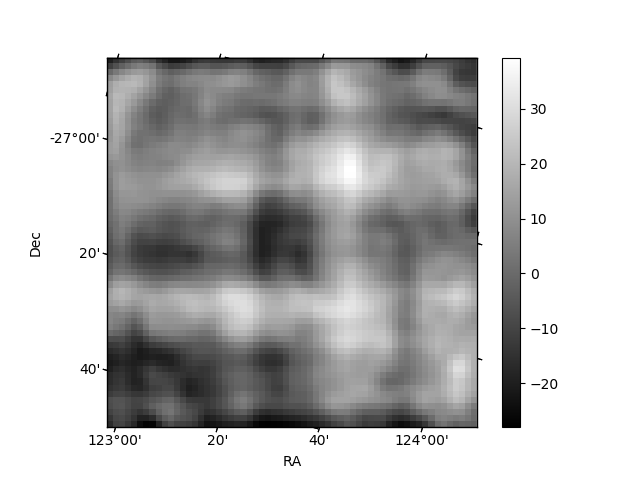
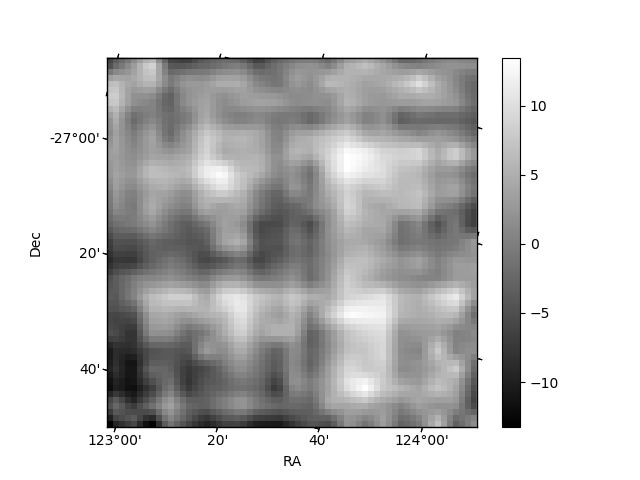
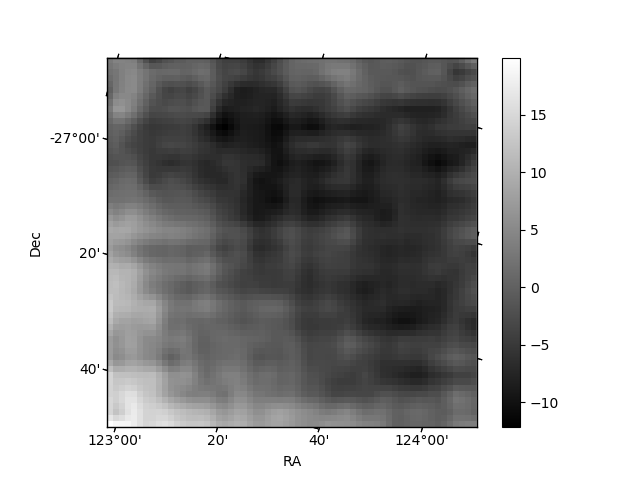
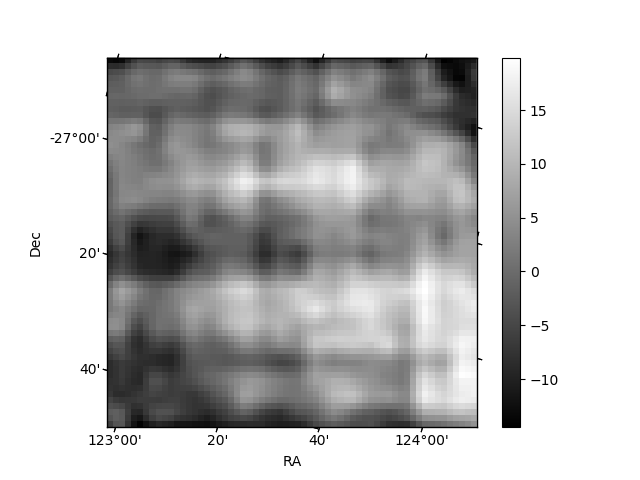
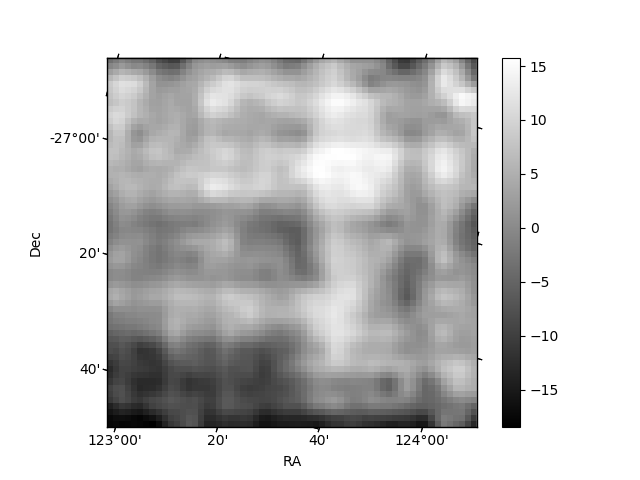
Histogram calculated using DETX and DETY for each event in the final _common_clean file
| Quadrant A | 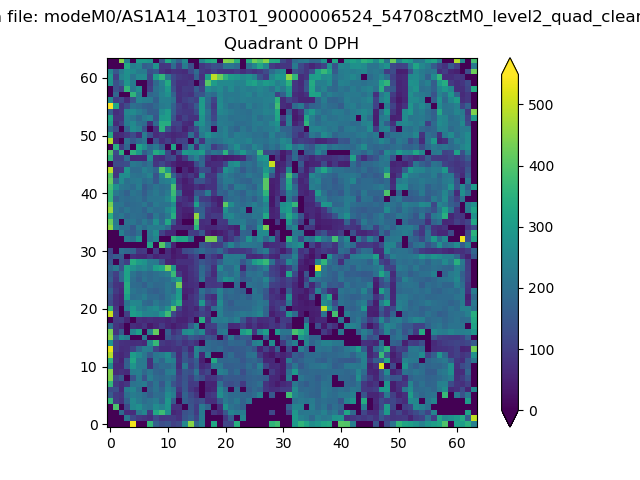 |
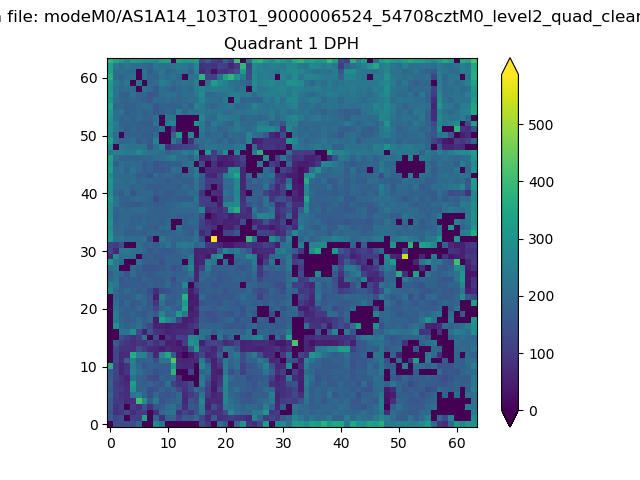 |
Quadrant B |
|---|---|---|---|
| Quadrant D | 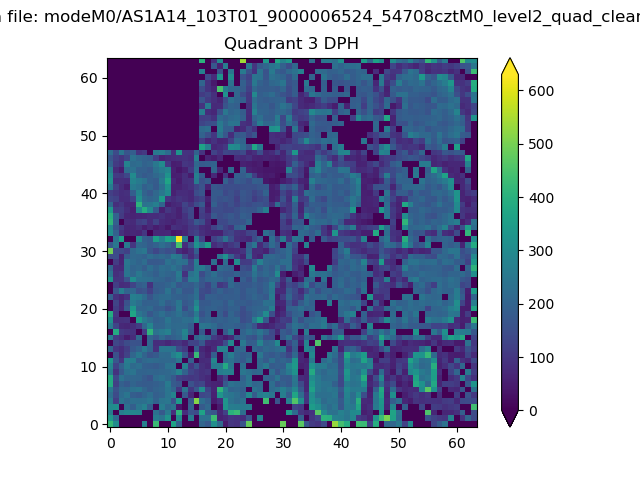 |
 |
Quadrant C |
| Plot type | Count rate plots | Images |
|---|---|---|
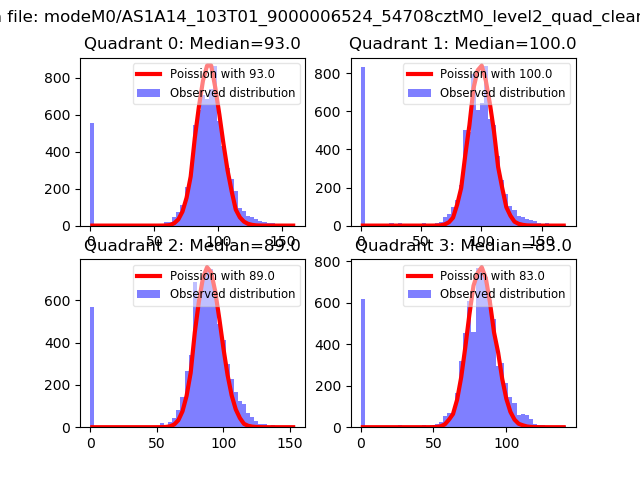
| Comparison with Poisson distribution Blue bars denote a histogram of data divided into 1 sec bins. Red curve is a Poisson curve with rate = median count rate of data. |
 |
 |
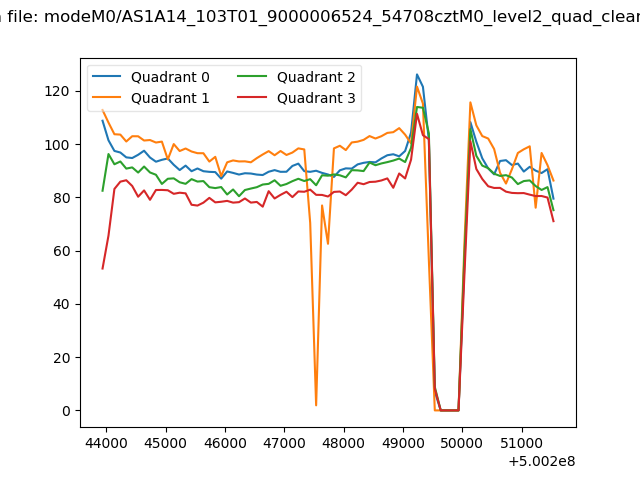
| Quadrant-wise count rates Data is divided into 100 sec bins |
 |
|
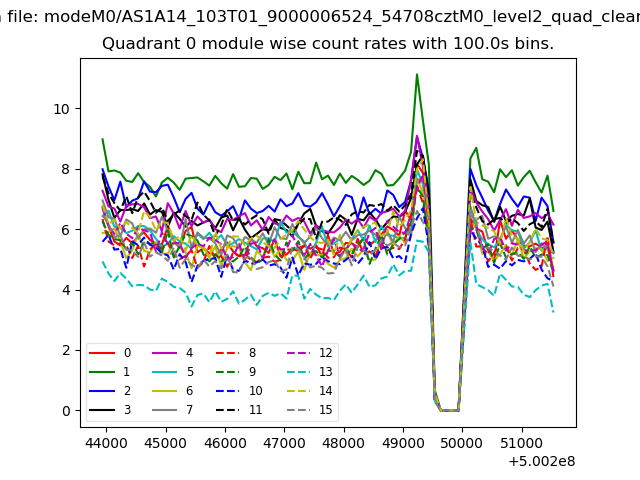
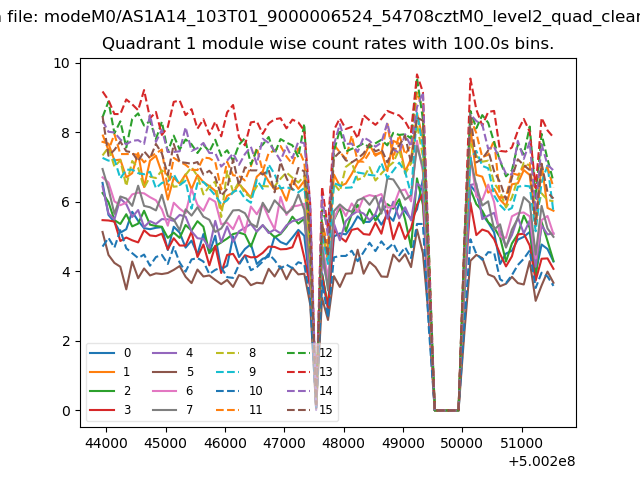
| Module-wise count rates for Quadrant A Data is divided into 100 sec bins |
 |
 |
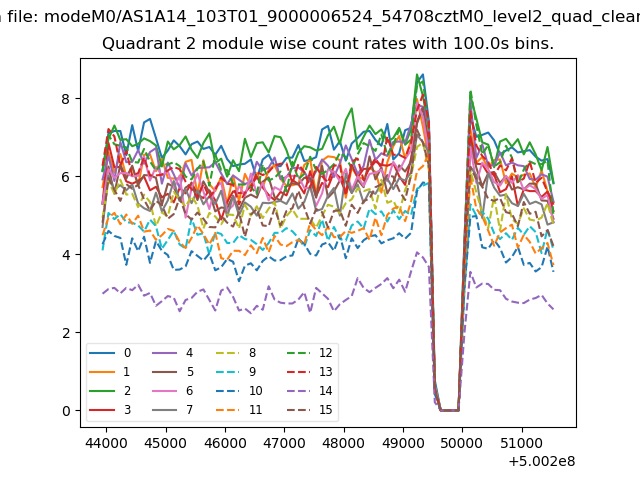
| Module-wise count rates for Quadrant B Data is divided into 100 sec bins |
 |
 |
| Module-wise count rates for Quadrant C Data is divided into 100 sec bins |
 |
 |
| Module-wise count rates for Quadrant D Data is divided into 100 sec bins |
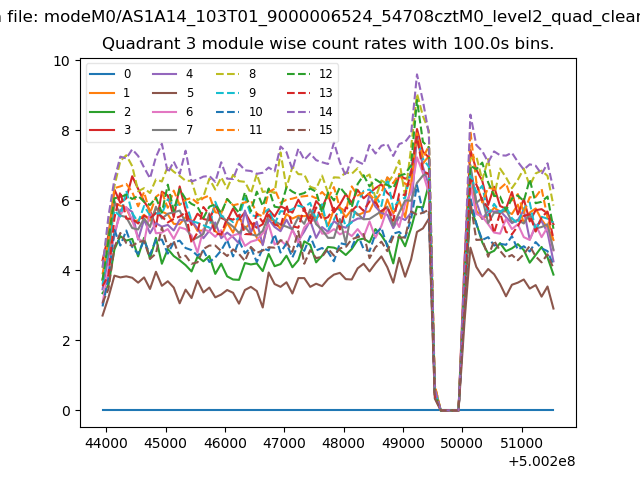 |
 |
| Parameter | Plot |
|---|---|
| CZT HV Monitor | 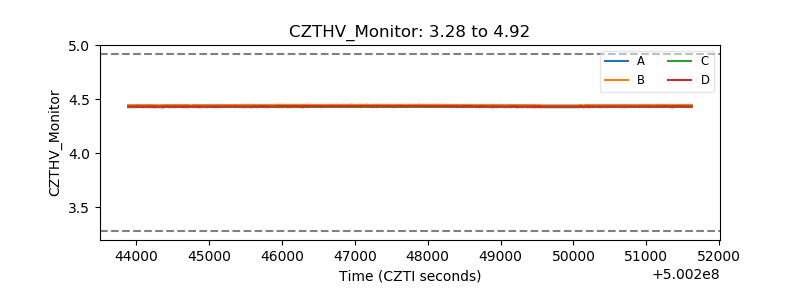 |
| D_VDD | 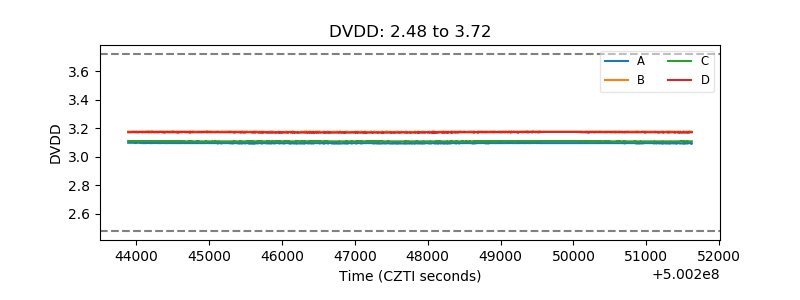 |
| Temperature 1 | 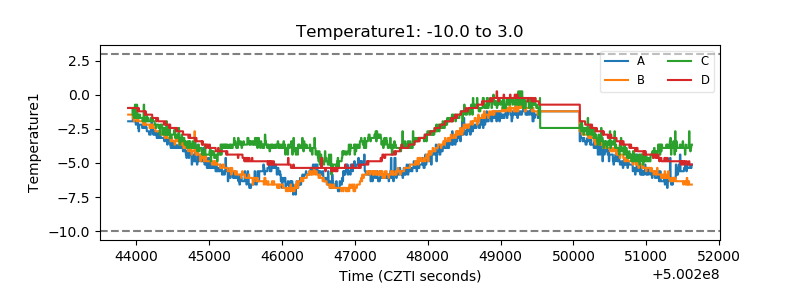 |
| Veto HV Monitor | 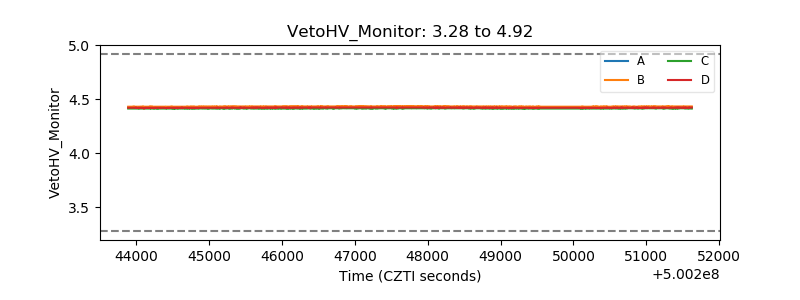 |
| Veto LLD | 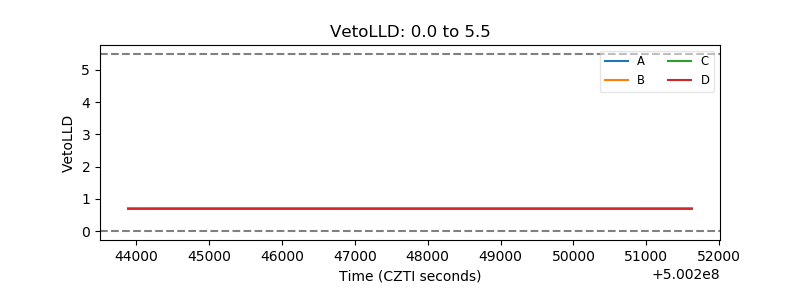 |
| Alpha Counter | 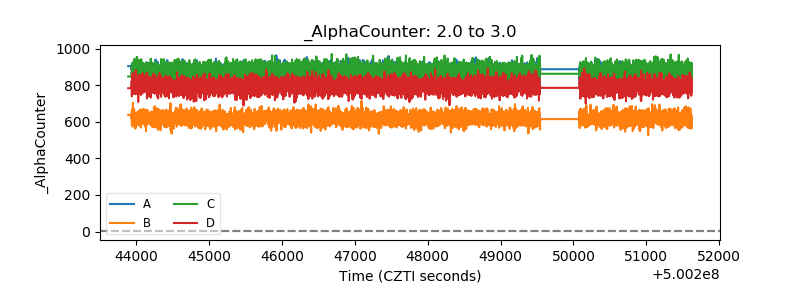 |
| _CPM_Rate | 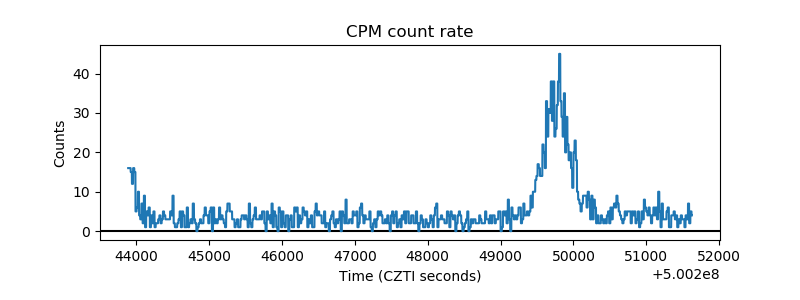 |
| CZT Counter | 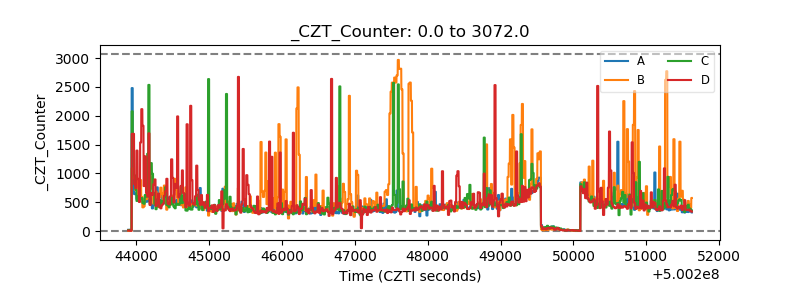 |
| +2.5 Volts monitor |  |
| +5 Volts monitor |  |
| _ROLL_ROT | 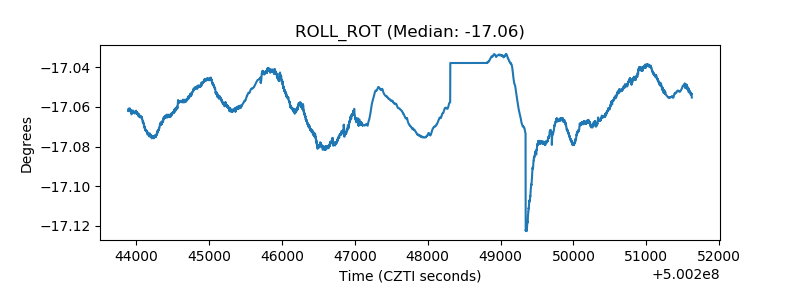 |
| _Roll_DEC | 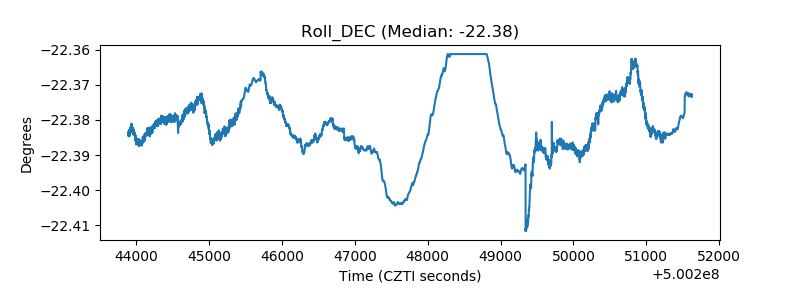 |
| _Roll_RA | 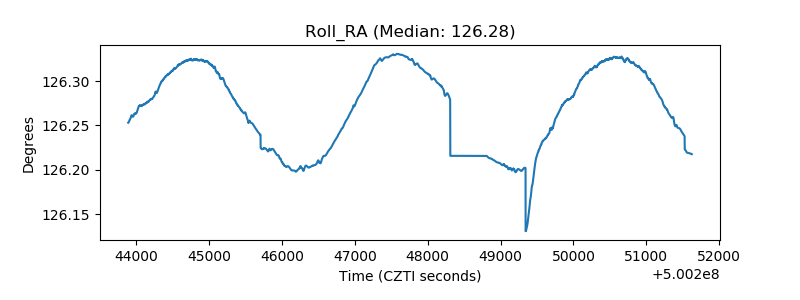 |
| Veto Counter | 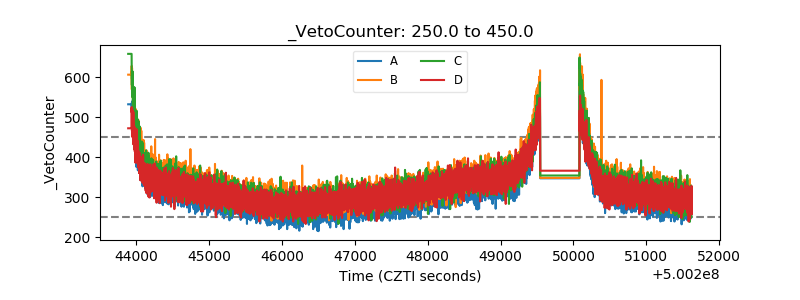 |