| Param | Original file | Final file |
|---|---|---|
| Filename | modeM0/AS1A14_103T01_9000006524_54709cztM0_level2.fits | modeM0/AS1A14_103T01_9000006524_54709cztM0_level2_quad_clean.evt |
| Size (bytes) | 543,407,040 | 122,016,960 |
| Size | 518.2 MB | 116.4 MB |
| Events in quadrant A | 4,110,161 | 807,109 |
| Events in quadrant B | 5,130,375 | 845,857 |
| Events in quadrant C | 5,663,898 | 718,096 |
| Events in quadrant D | 4,540,256 | 724,205 |
| Mode SS | |||
|---|---|---|---|
| Quadrant | BADHDUFLAG | Total packets | Discarded packets |
| A | 0 | 174 | 0 |
| B | 0 | 174 | 0 |
| C | 0 | 174 | 0 |
| D | 0 | 174 | 0 |
| Mode M0 | |||
|---|---|---|---|
| Quadrant | BADHDUFLAG | Total packets | Discarded packets |
| A | 0 | 18725 | 1 |
| B | 0 | 21544 | 1 |
| C | 0 | 23204 | 1 |
| D | 0 | 20002 | 2 |
| Mode M9 | |||
|---|---|---|---|
| Quadrant | BADHDUFLAG | Total packets | Discarded packets |
| A | 0 | 5 | 0 |
| B | 0 | 5 | 0 |
| C | 0 | 5 | 0 |
| D | 0 | 5 | 0 |
| Quadrant | Total seconds | Saturated seconds | Saturation percentage |
|---|---|---|---|
| A | 8632 | 73 | 0.845690% |
| B | 8632 | 316 | 3.660797% |
| C | 8632 | 636 | 7.367933% |
| D | 8631 | 78 | 0.903719% |
Noise dominated data is calculated using 1-second bins in cleaned event files. If a bin has >2000 counts, and if more than 50% of those come from <1% of pixels, then it is considered to be noise-dominated and hence unusable.
| Quadrant | # 1 sec bins | Bins with >0 counts | Bins with >2000 counts | High rate bins dominated by noise | Noise dominated (total time) | Noise dominated (detector-on time) | Marked lightcurve |
|---|---|---|---|---|---|---|---|
| A | 9172 | 8633 | 21 | 21 | 0.23% | 0.24% | 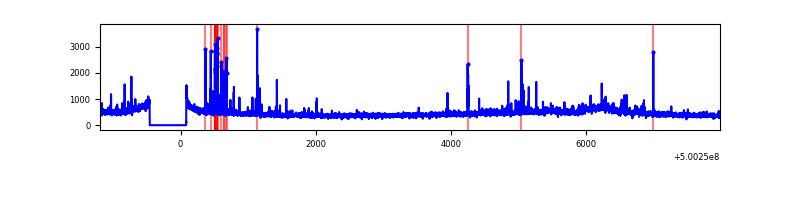 |
| B | 9172 | 8633 | 139 | 139 | 1.52% | 1.61% | 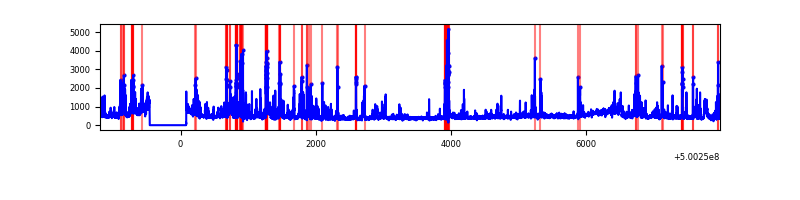 |
| C | 9172 | 8633 | 355 | 355 | 3.87% | 4.11% | 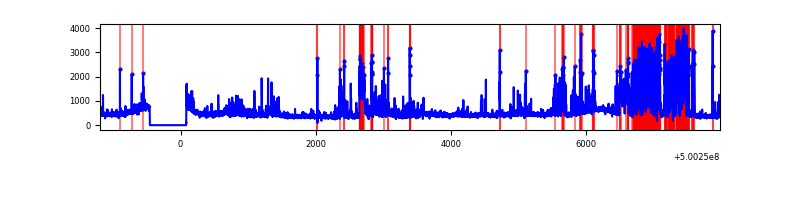 |
| D | 9171 | 8632 | 56 | 56 | 0.61% | 0.65% | 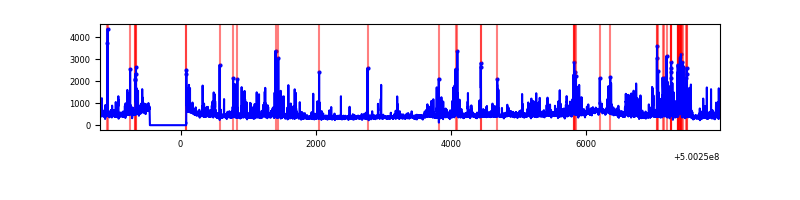 |
Top three noisy pixels from each quadrant. If the there are fewer than three noisy pixels in the level2.evt file, extra rows are filled as -1
| Pixel properties | Quadrant properties | ||||||
|---|---|---|---|---|---|---|---|
| Quadrant | DetID | PixID | Counts | Sigma | Mean | Median | Sigma |
| A | 11 | 3 | 154054 | 673.55 | 917 | 893 | 227.4 |
| A | 0 | 8 | 143603 | 627.59 | 917 | 893 | 227.4 |
| A | 3 | 14 | 79378 | 345.15 | 917 | 893 | 227.4 |
| B | 2 | 249 | 880720 | 4498.4 | 906 | 873 | 195.6 |
| B | 4 | 171 | 328260 | 1673.83 | 906 | 873 | 195.6 |
| B | 10 | 247 | 85304 | 431.67 | 906 | 873 | 195.6 |
| C | 15 | 219 | 1415884 | 5926.92 | 868 | 861 | 238.7 |
| C | 4 | 5 | 231631 | 966.6 | 868 | 861 | 238.7 |
| C | 13 | 3 | 209752 | 874.95 | 868 | 861 | 238.7 |
| D | 3 | 12 | 375018 | 1454.87 | 890 | 846 | 257.2 |
| D | 11 | 129 | 351874 | 1364.88 | 890 | 846 | 257.2 |
| D | 15 | 43 | 86592 | 333.4 | 890 | 846 | 257.2 |
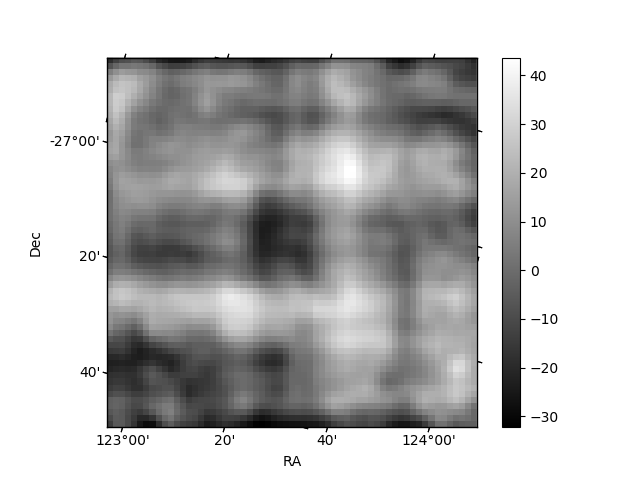
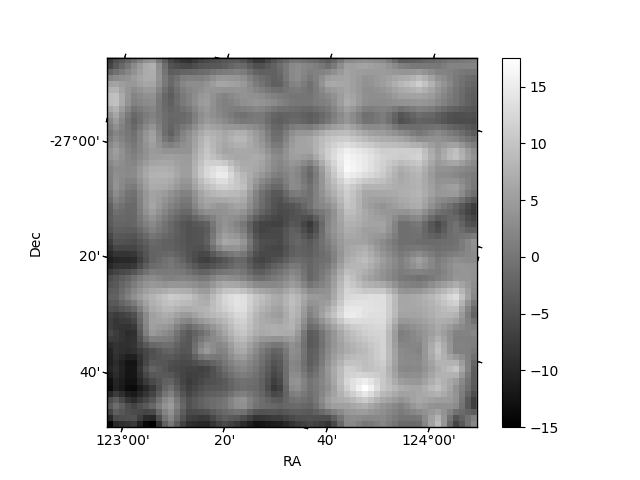
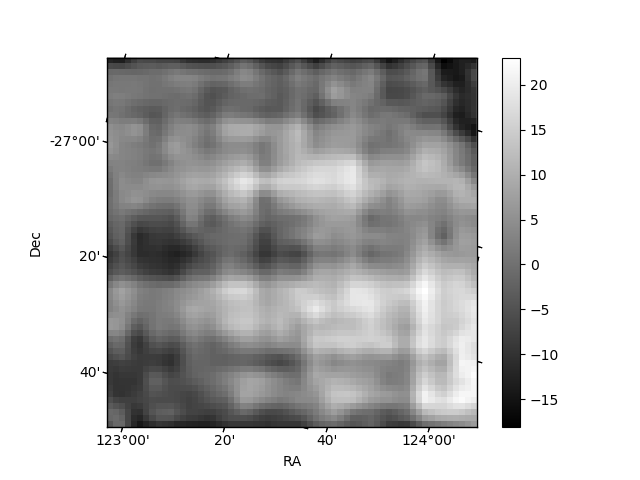
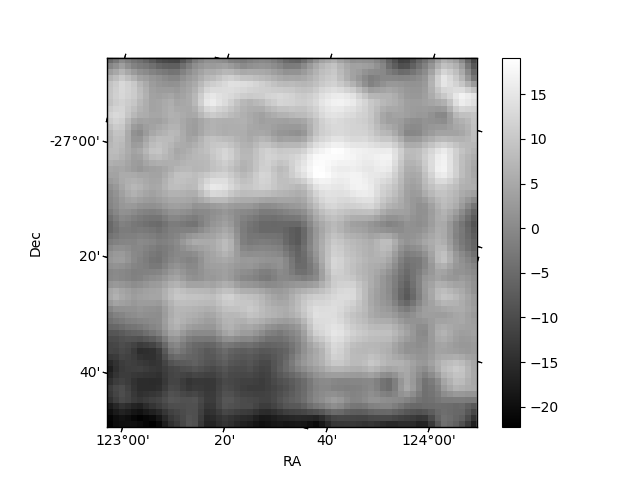
Histogram calculated using DETX and DETY for each event in the final _common_clean file
| Quadrant A | 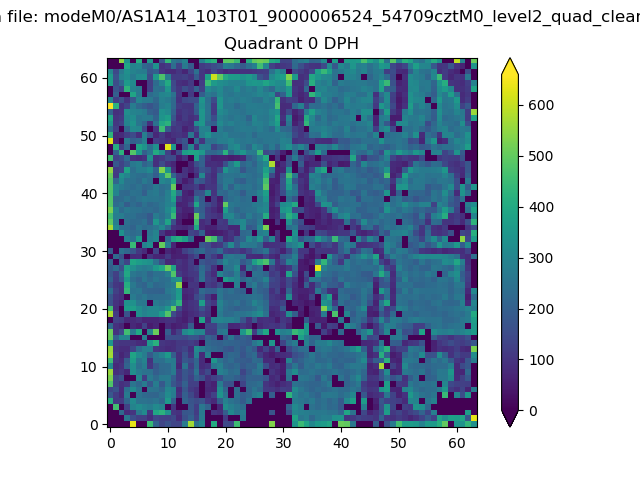 |
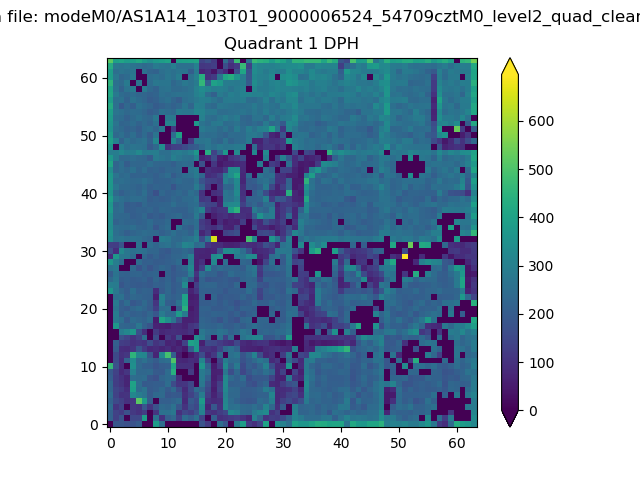 |
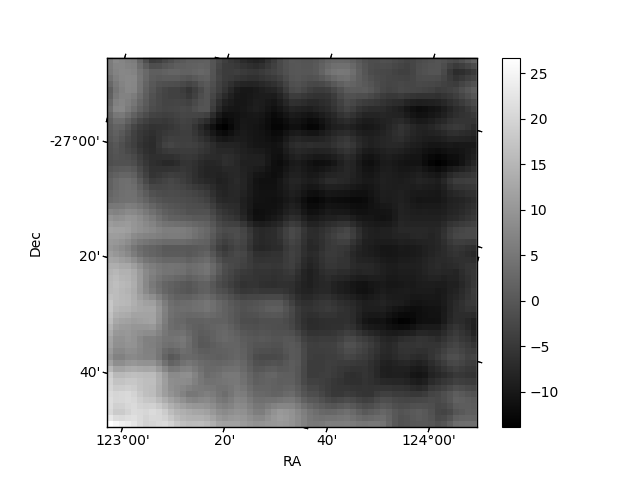
Quadrant B |
|---|---|---|---|
| Quadrant D | 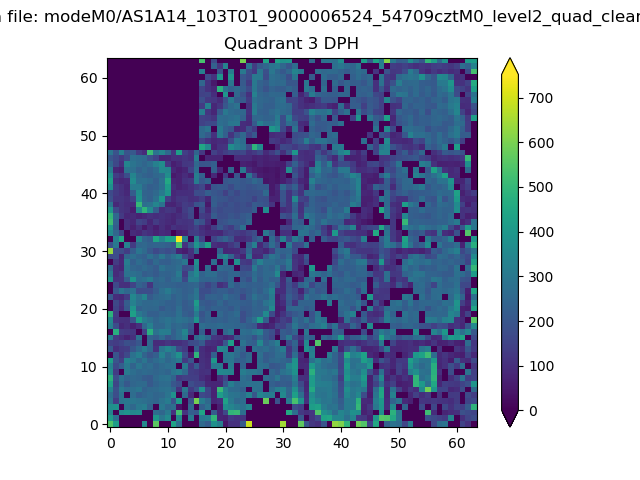 |
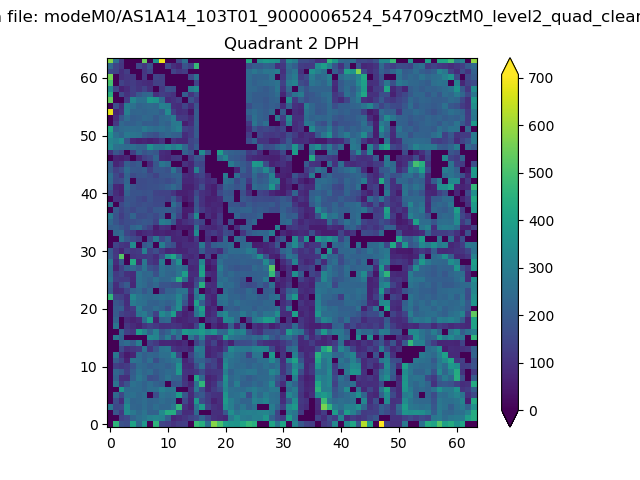 |
Quadrant C |
| Plot type | Count rate plots | Images |
|---|---|---|
| Comparison with Poisson distribution Blue bars denote a histogram of data divided into 1 sec bins. Red curve is a Poisson curve with rate = median count rate of data. |
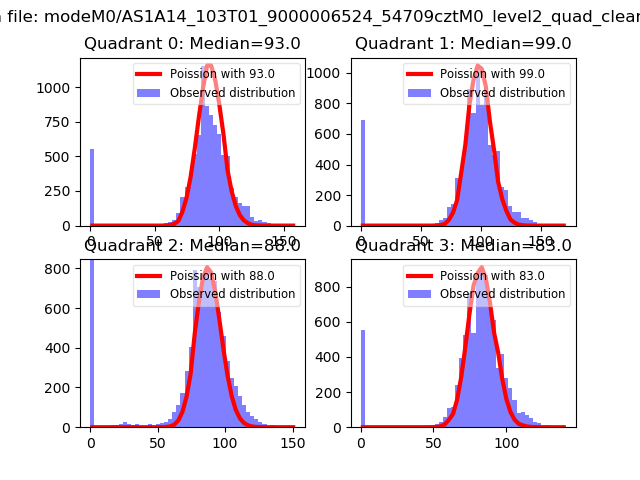 |
 |
| Quadrant-wise count rates Data is divided into 100 sec bins |
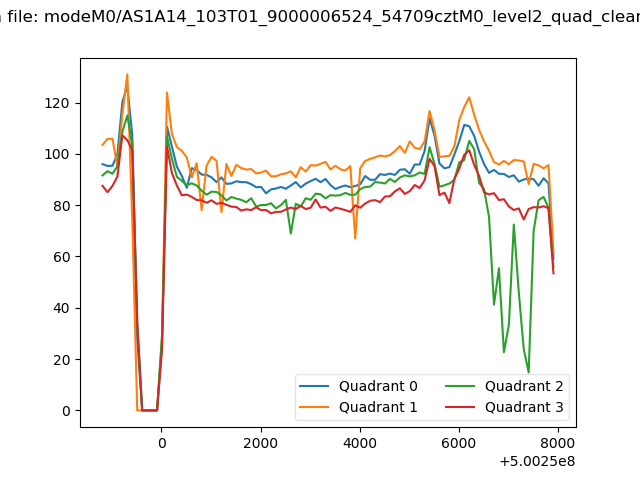 |
|
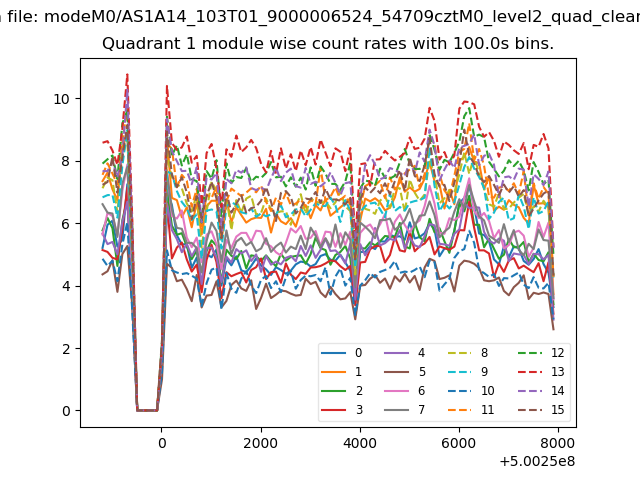
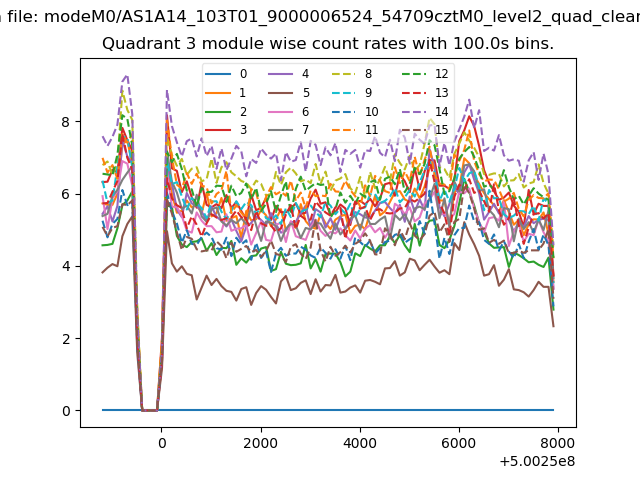
| Module-wise count rates for Quadrant A Data is divided into 100 sec bins |
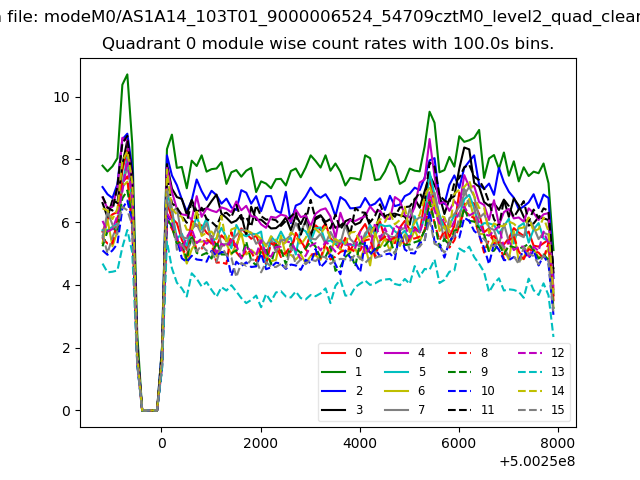 |
 |
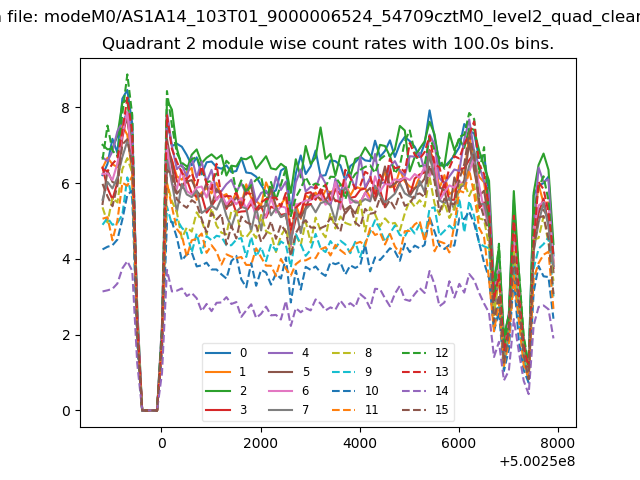
| Module-wise count rates for Quadrant B Data is divided into 100 sec bins |
 |
 |
| Module-wise count rates for Quadrant C Data is divided into 100 sec bins |
 |
 |
| Module-wise count rates for Quadrant D Data is divided into 100 sec bins |
 |
 |
| Parameter | Plot |
|---|---|
| CZT HV Monitor | 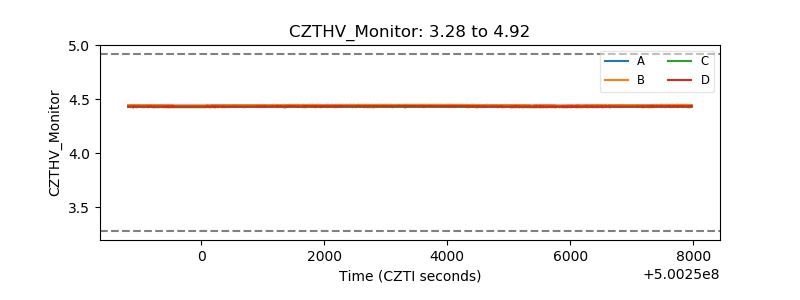 |
| D_VDD | 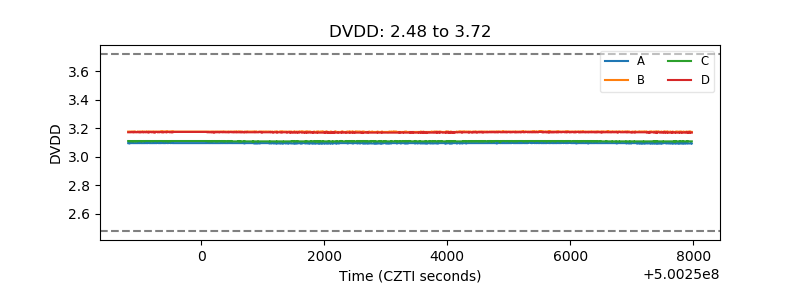 |
| Temperature 1 | 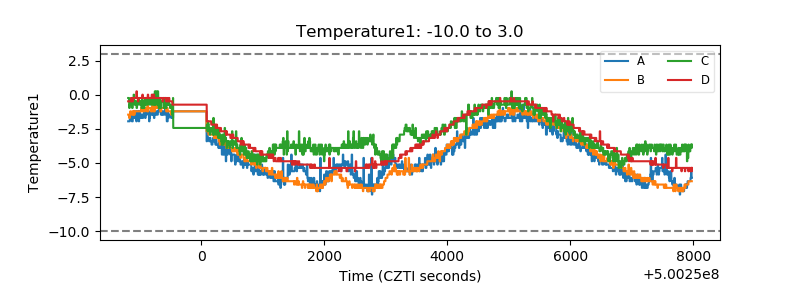 |
| Veto HV Monitor | 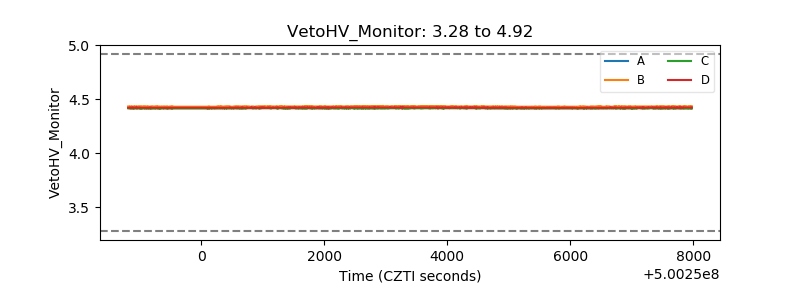 |
| Veto LLD | 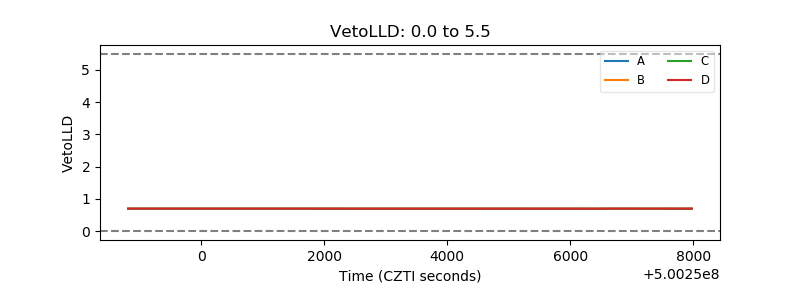 |
| Alpha Counter | 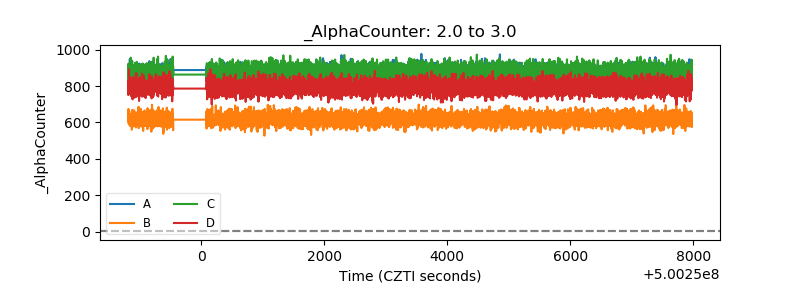 |
| _CPM_Rate | 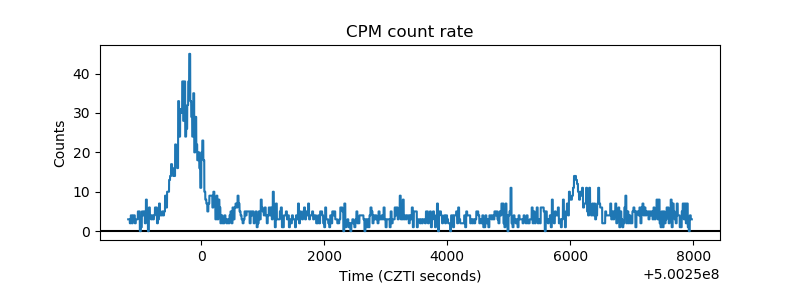 |
| CZT Counter | 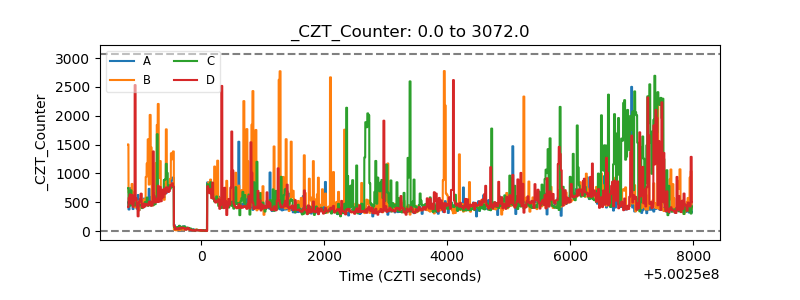 |
| +2.5 Volts monitor |  |
| +5 Volts monitor |  |
| _ROLL_ROT | 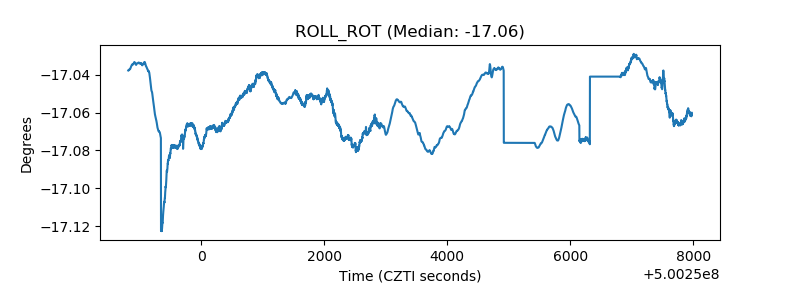 |
| _Roll_DEC | 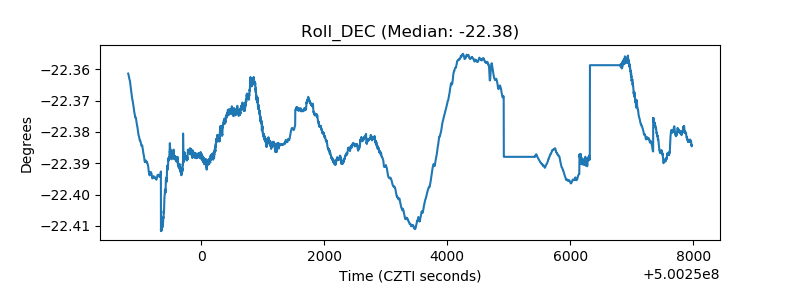 |
| _Roll_RA | 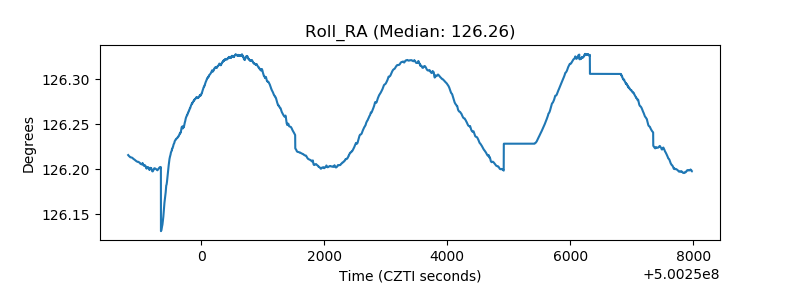 |
| Veto Counter | 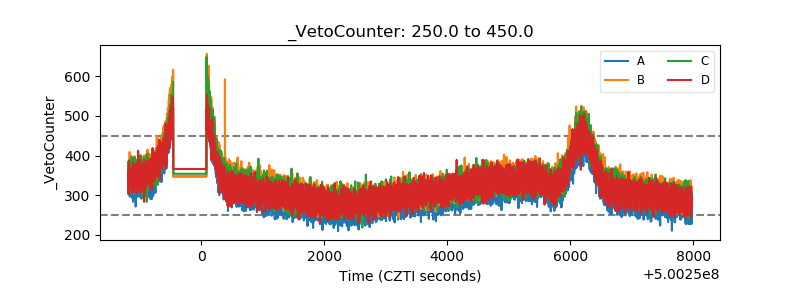 |