| Param | Original file | Final file |
|---|---|---|
| Filename | modeM0/AS1A14_103T01_9000006524_54714cztM0_level2.fits | modeM0/AS1A14_103T01_9000006524_54714cztM0_level2_quad_clean.evt |
| Size (bytes) | 235,474,560 | 44,714,880 |
| Size | 224.6 MB | 42.6 MB |
| Events in quadrant A | 1,721,560 | 308,702 |
| Events in quadrant B | 1,975,103 | 319,990 |
| Events in quadrant C | 2,773,078 | 204,266 |
| Events in quadrant D | 1,969,330 | 268,347 |
| Mode SS | |||
|---|---|---|---|
| Quadrant | BADHDUFLAG | Total packets | Discarded packets |
| A | 0 | 145 | 53 |
| B | 0 | 146 | 65 |
| C | 0 | 148 | 68 |
| D | 0 | 145 | 56 |
| Mode M0 | |||
|---|---|---|---|
| Quadrant | BADHDUFLAG | Total packets | Discarded packets |
| A | 0 | 15776 | 7835 |
| B | 0 | 18776 | 10311 |
| C | 0 | 28633 | 18215 |
| D | 0 | 19394 | 10800 |
| Mode M9 | |||
|---|---|---|---|
| Quadrant | BADHDUFLAG | Total packets | Discarded packets |
| A | 1 | 140045143259176 | 140041703653422 |
| B | 1 | -1 | -1 |
| C | 1 | -1 | -1 |
| D | 1 | -1 | -1 |
| Quadrant | Total seconds | Saturated seconds | Saturation percentage |
|---|---|---|---|
| A | 3735 | 4 | 0.107095% |
| B | 3630 | 28 | 0.771350% |
| C | 3057 | 593 | 19.398103% |
| D | 3643 | 27 | 0.741147% |
Noise dominated data is calculated using 1-second bins in cleaned event files. If a bin has >2000 counts, and if more than 50% of those come from <1% of pixels, then it is considered to be noise-dominated and hence unusable.
| Quadrant | # 1 sec bins | Bins with >0 counts | Bins with >2000 counts | High rate bins dominated by noise | Noise dominated (total time) | Noise dominated (detector-on time) | Marked lightcurve |
|---|---|---|---|---|---|---|---|
| A | 8175 | 4645 | 1 | 1 | 0.01% | 0.02% | 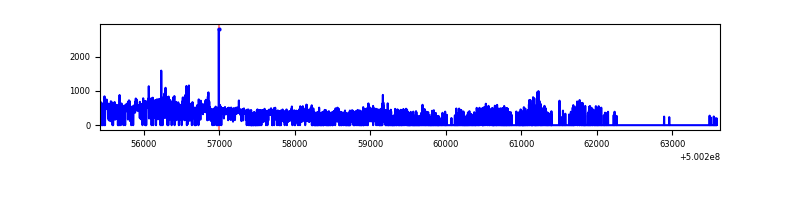 |
| B | 8171 | 4521 | 6 | 6 | 0.07% | 0.13% | 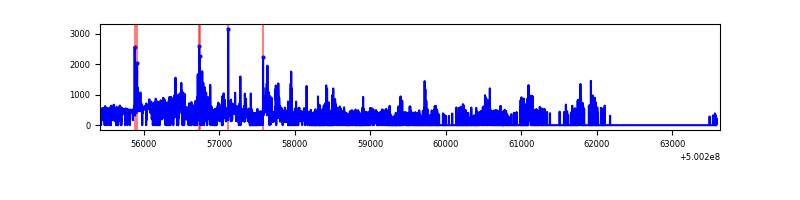 |
| C | 8198 | 3757 | 215 | 215 | 2.62% | 5.72% | 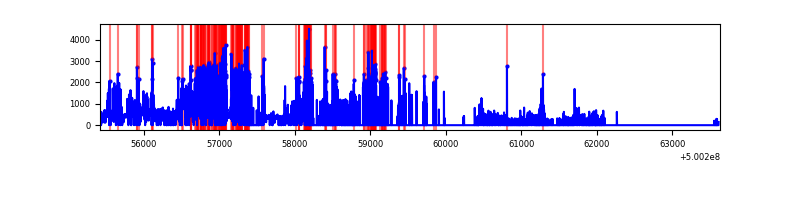 |
| D | 8214 | 4529 | 18 | 18 | 0.22% | 0.40% | 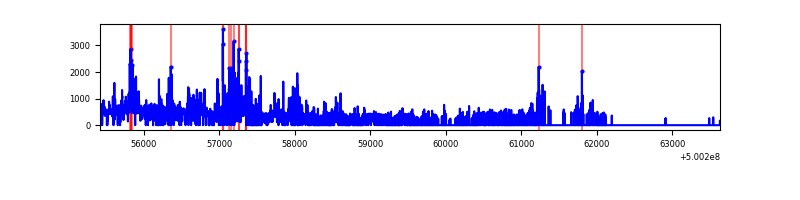 |
Top three noisy pixels from each quadrant. If the there are fewer than three noisy pixels in the level2.evt file, extra rows are filled as -1
| Pixel properties | Quadrant properties | ||||||
|---|---|---|---|---|---|---|---|
| Quadrant | DetID | PixID | Counts | Sigma | Mean | Median | Sigma |
| A | 11 | 3 | 58547 | 589.0 | 393 | 383 | 98.8 |
| A | 3 | 14 | 43418 | 435.79 | 393 | 383 | 98.8 |
| A | 7 | 221 | 26821 | 267.72 | 393 | 383 | 98.8 |
| B | 2 | 249 | 265110 | 3171.89 | 382 | 369 | 83.5 |
| B | 7 | 0 | 100448 | 1199.06 | 382 | 369 | 83.5 |
| B | 10 | 247 | 25348 | 299.28 | 382 | 369 | 83.5 |
| C | 15 | 219 | 1282602 | 15672.53 | 293 | 290 | 81.8 |
| C | 13 | 3 | 152760 | 1863.5 | 293 | 290 | 81.8 |
| C | 6 | 223 | 57887 | 703.95 | 293 | 290 | 81.8 |
| D | 11 | 129 | 197655 | 1861.64 | 370 | 354 | 106.0 |
| D | 3 | 12 | 192749 | 1815.35 | 370 | 354 | 106.0 |
| D | 5 | 173 | 33041 | 308.42 | 370 | 354 | 106.0 |
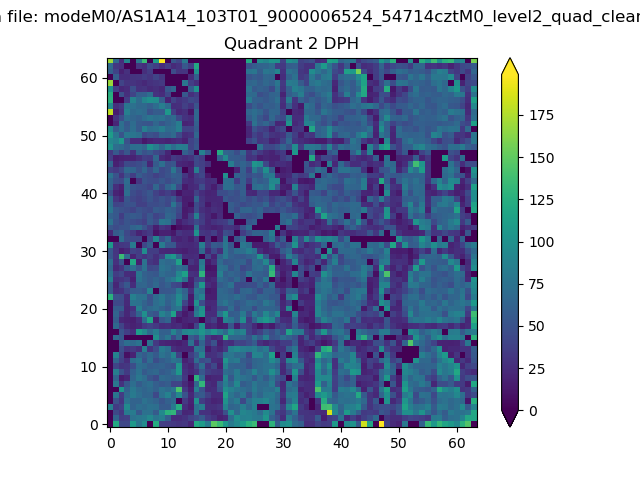
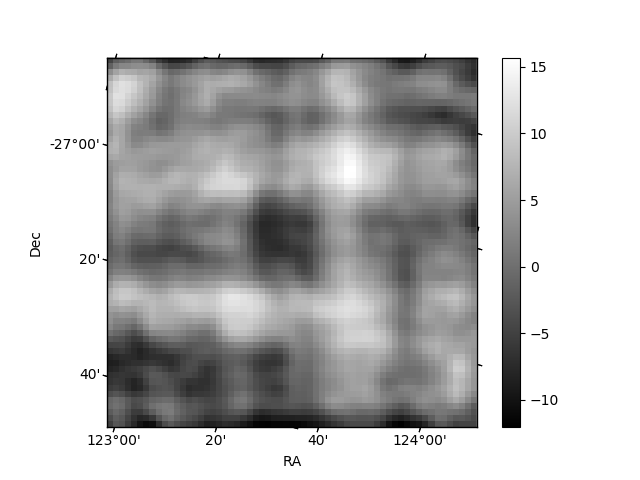
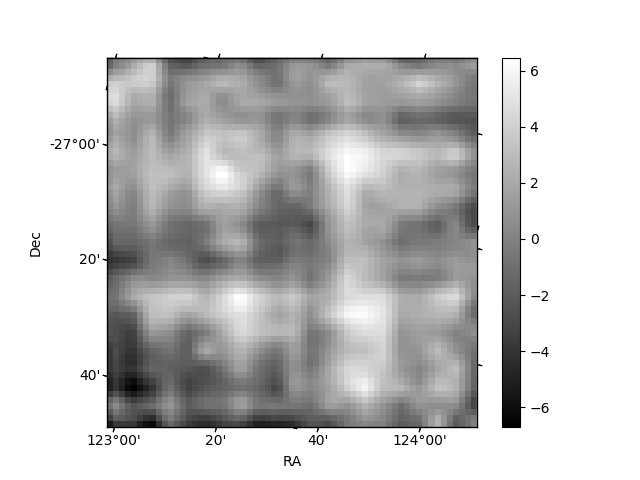
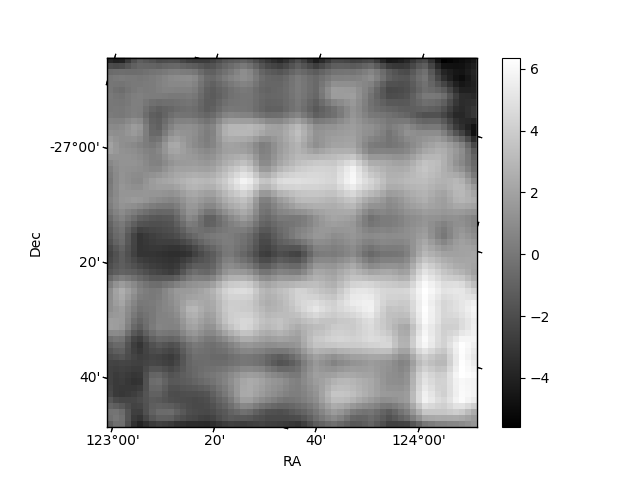
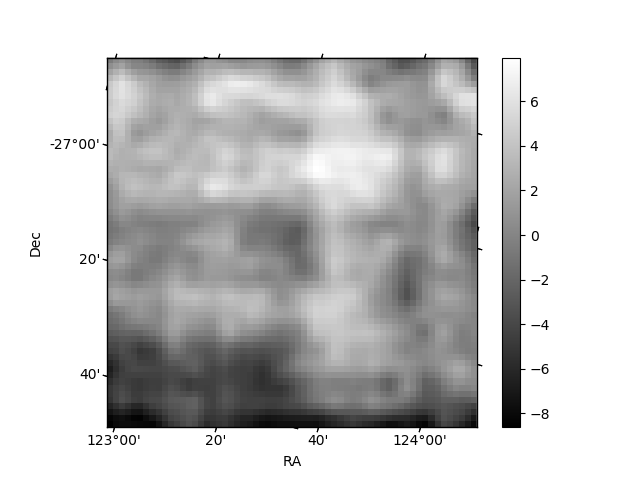
Histogram calculated using DETX and DETY for each event in the final _common_clean file
| Quadrant A | 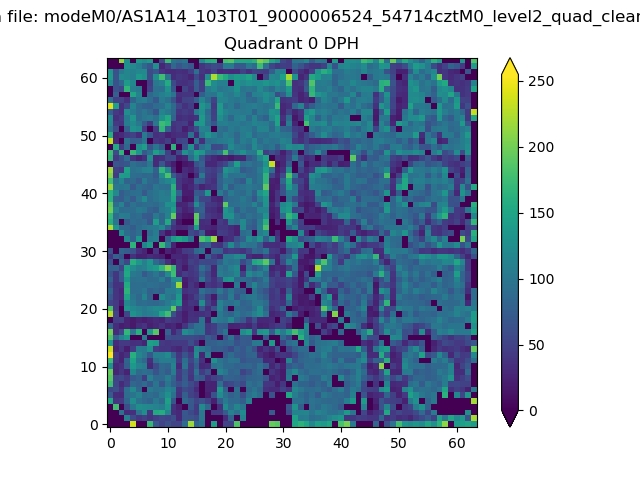 |
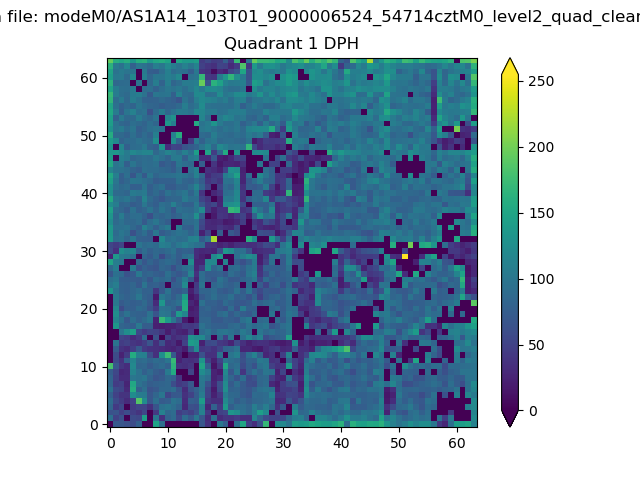 |
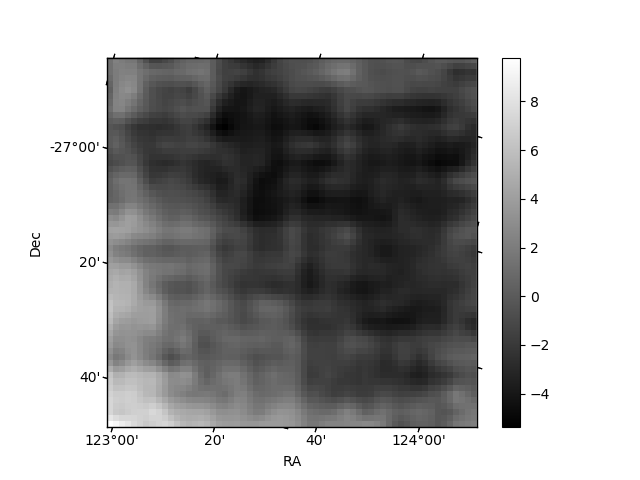
Quadrant B |
|---|---|---|---|
| Quadrant D | 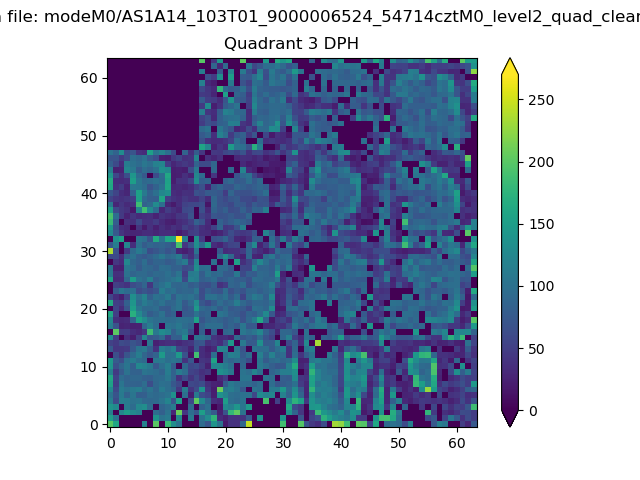 |
 |
Quadrant C |
| Plot type | Count rate plots | Images |
|---|---|---|
| Comparison with Poisson distribution Blue bars denote a histogram of data divided into 1 sec bins. Red curve is a Poisson curve with rate = median count rate of data. |
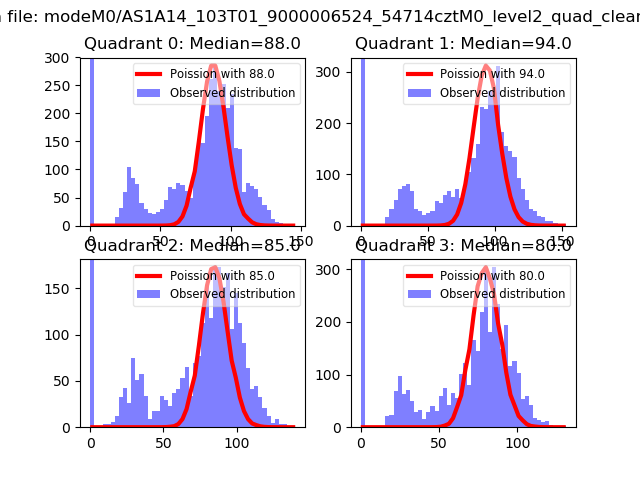 |
 |
| Quadrant-wise count rates Data is divided into 100 sec bins |
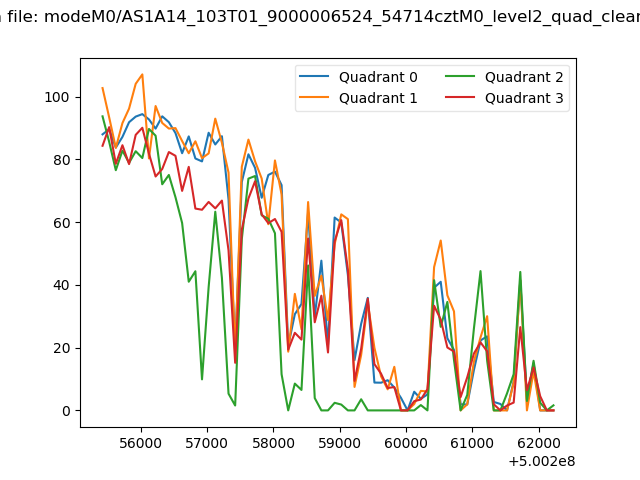 |
|
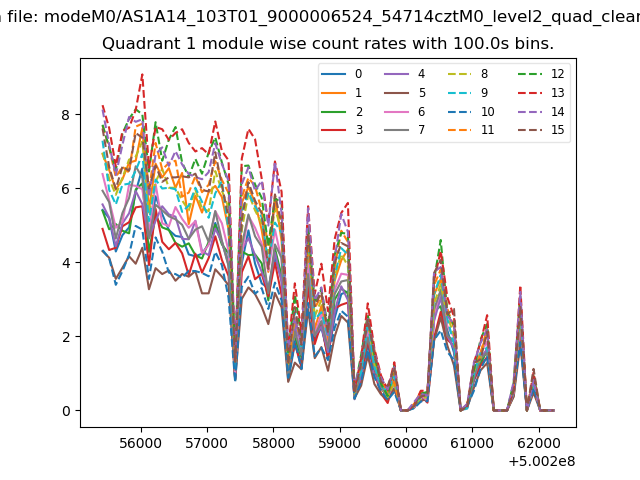
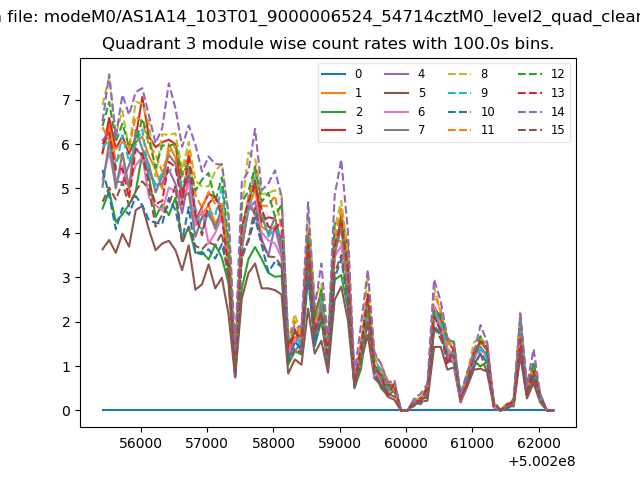
| Module-wise count rates for Quadrant A Data is divided into 100 sec bins |
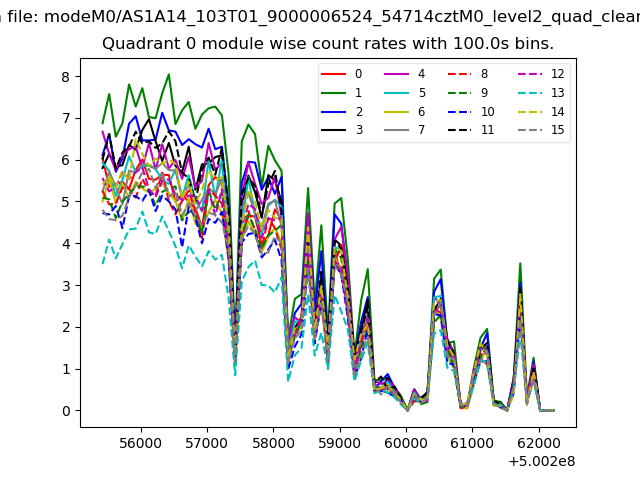 |
 |
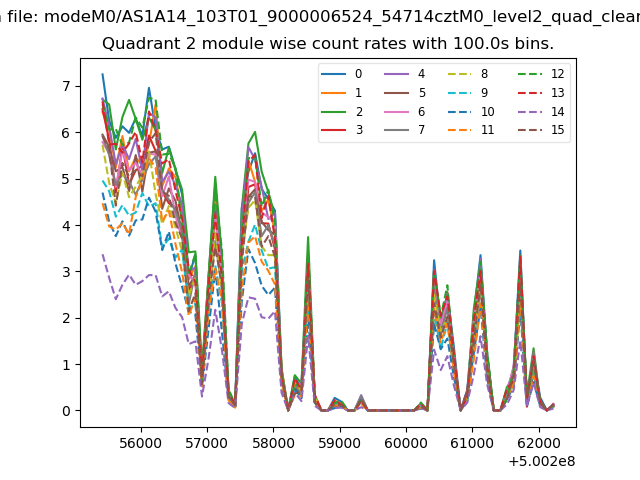
| Module-wise count rates for Quadrant B Data is divided into 100 sec bins |
 |
 |
| Module-wise count rates for Quadrant C Data is divided into 100 sec bins |
 |
 |
| Module-wise count rates for Quadrant D Data is divided into 100 sec bins |
 |
 |
| Parameter | Plot |
|---|---|
| CZT HV Monitor | 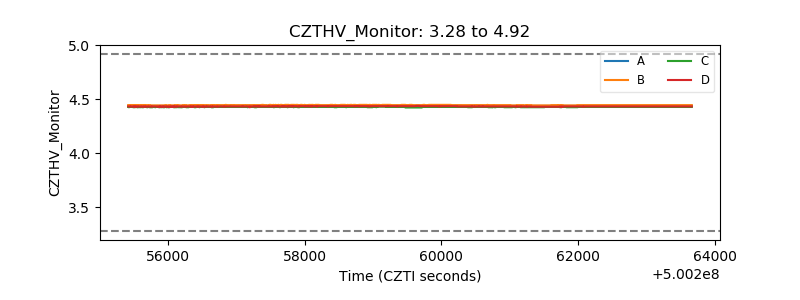 |
| D_VDD | 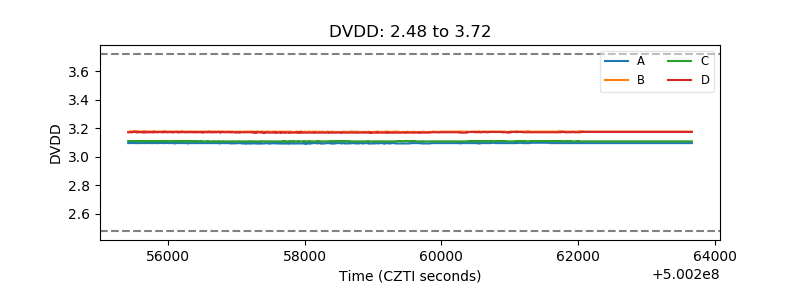 |
| Temperature 1 | 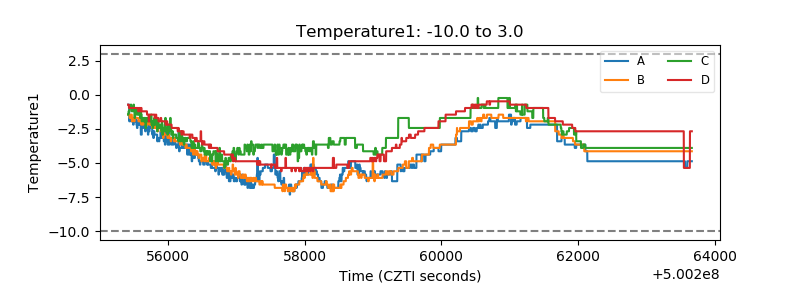 |
| Veto HV Monitor | 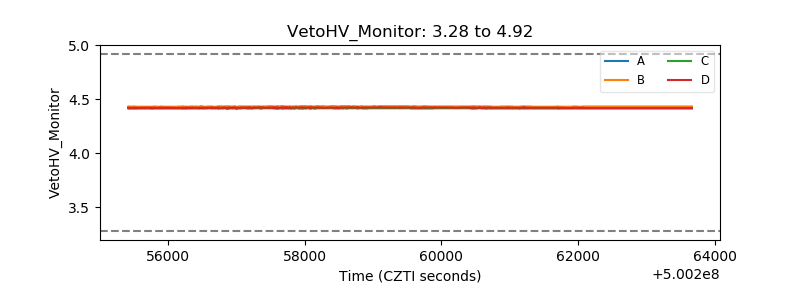 |
| Veto LLD | 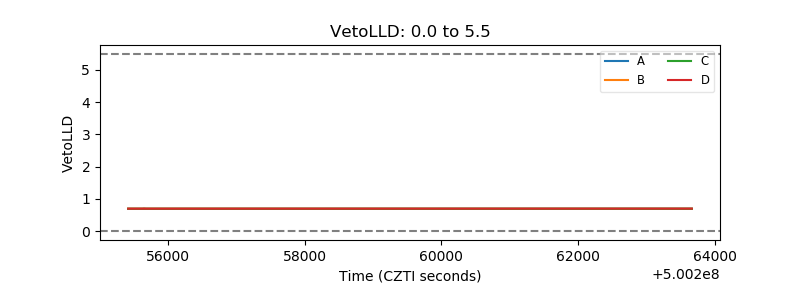 |
| Alpha Counter | 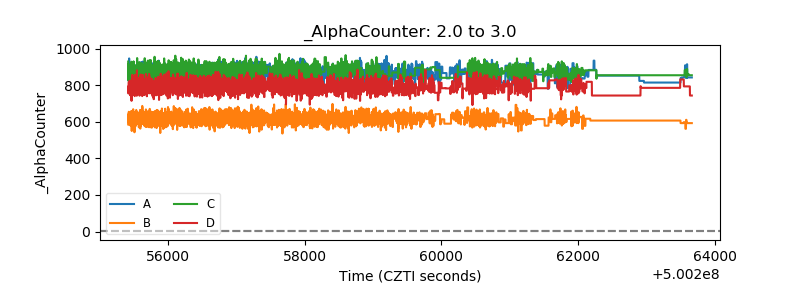 |
| _CPM_Rate | 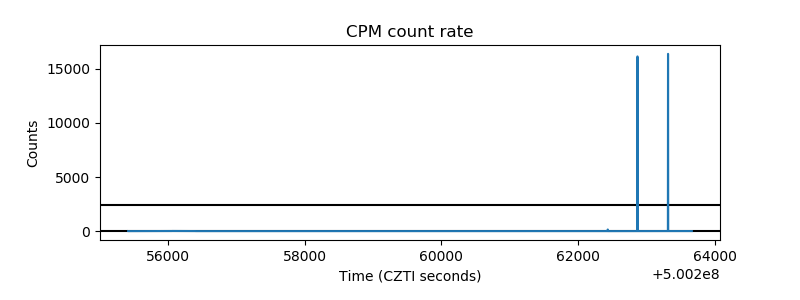 |
| CZT Counter | 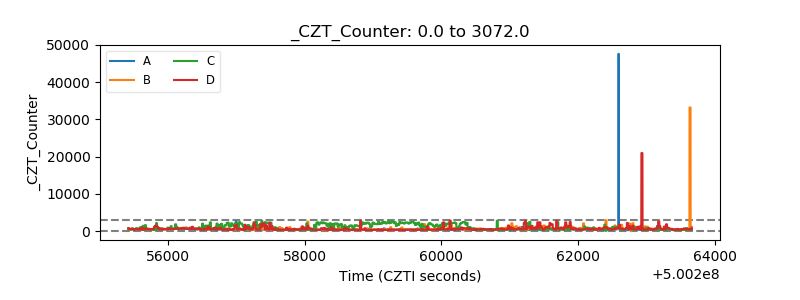 |
| +2.5 Volts monitor | 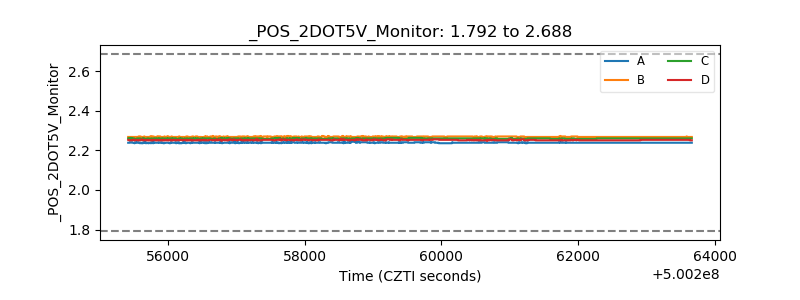 |
| +5 Volts monitor | 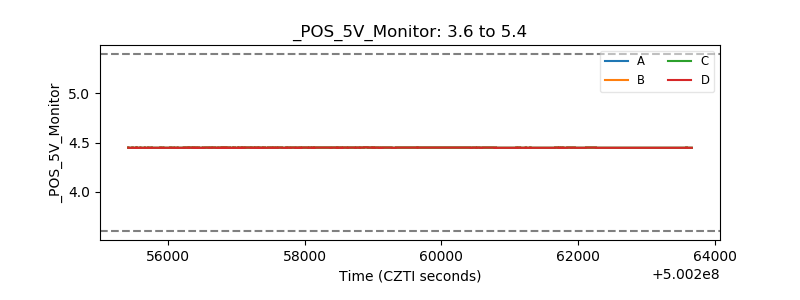 |
| _ROLL_ROT | 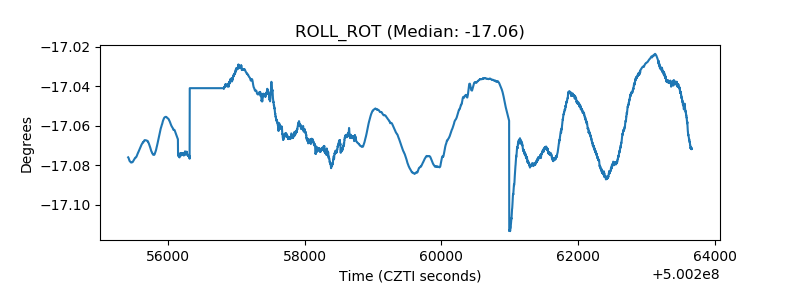 |
| _Roll_DEC | 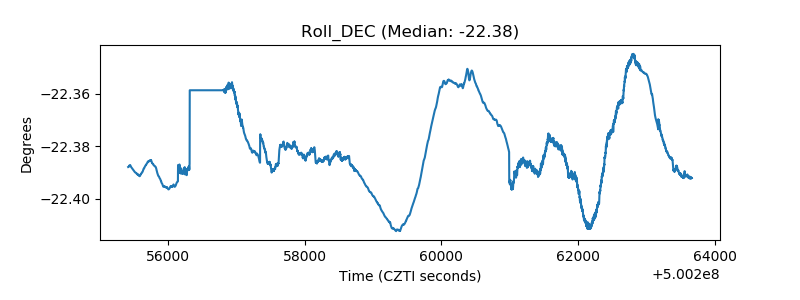 |
| _Roll_RA | 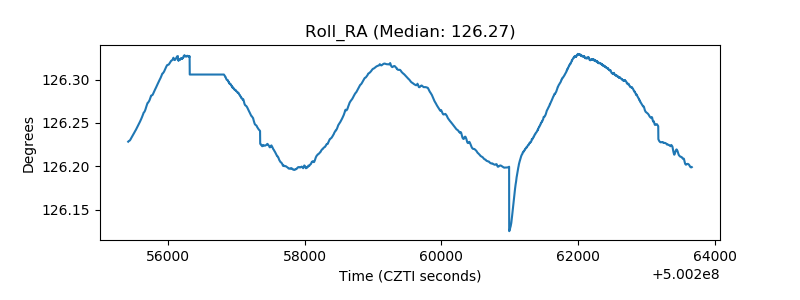 |
| Veto Counter | 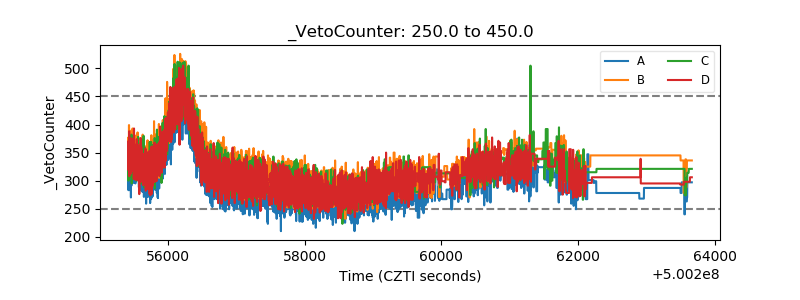 |