| Param | Original file | Final file |
|---|---|---|
| Filename | modeM0/AS1A14_103T01_9000006524_54717cztM0_level2.fits | modeM0/AS1A14_103T01_9000006524_54717cztM0_level2_quad_clean.evt |
| Size (bytes) | 501,724,800 | 95,970,240 |
| Size | 478.5 MB | 91.5 MB |
| Events in quadrant A | 3,408,821 | 641,497 |
| Events in quadrant B | 4,588,121 | 651,719 |
| Events in quadrant C | 4,302,809 | 597,400 |
| Events in quadrant D | 5,740,040 | 538,177 |
| Mode SS | |||
|---|---|---|---|
| Quadrant | BADHDUFLAG | Total packets | Discarded packets |
| A | 0 | 138 | 0 |
| B | 0 | 138 | 0 |
| C | 0 | 138 | 0 |
| D | 0 | 138 | 0 |
| Mode M0 | |||
|---|---|---|---|
| Quadrant | BADHDUFLAG | Total packets | Discarded packets |
| A | 0 | 15164 | 1 |
| B | 0 | 18586 | 3 |
| C | 0 | 17942 | 1 |
| D | 0 | 21778 | 1 |
| Mode M9 | |||
|---|---|---|---|
| Quadrant | BADHDUFLAG | Total packets | Discarded packets |
| A | 0 | 10 | 0 |
| B | 0 | 10 | 0 |
| C | 0 | 10 | 0 |
| D | 0 | 10 | 0 |
| Quadrant | Total seconds | Saturated seconds | Saturation percentage |
|---|---|---|---|
| A | 6850 | 132 | 1.927007% |
| B | 6849 | 476 | 6.949920% |
| C | 6850 | 312 | 4.554745% |
| D | 6850 | 699 | 10.204380% |
Noise dominated data is calculated using 1-second bins in cleaned event files. If a bin has >2000 counts, and if more than 50% of those come from <1% of pixels, then it is considered to be noise-dominated and hence unusable.
| Quadrant | # 1 sec bins | Bins with >0 counts | Bins with >2000 counts | High rate bins dominated by noise | Noise dominated (total time) | Noise dominated (detector-on time) | Marked lightcurve |
|---|---|---|---|---|---|---|---|
| A | 7850 | 6851 | 58 | 58 | 0.74% | 0.85% | 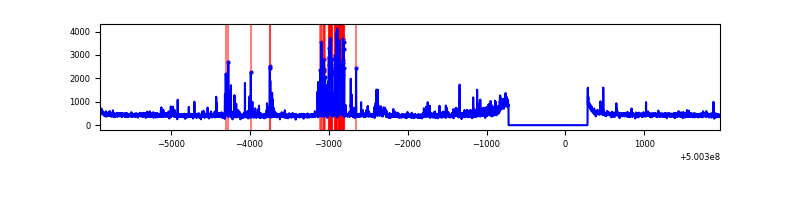 |
| B | 7849 | 6849 | 324 | 324 | 4.13% | 4.73% | 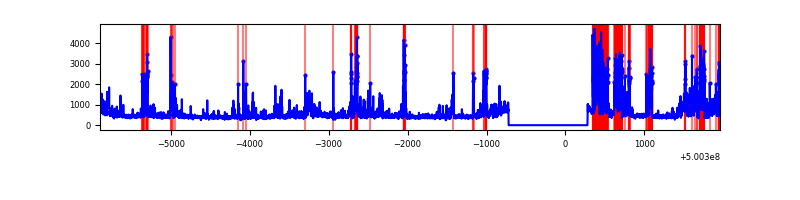 |
| C | 7850 | 6851 | 252 | 252 | 3.21% | 3.68% | 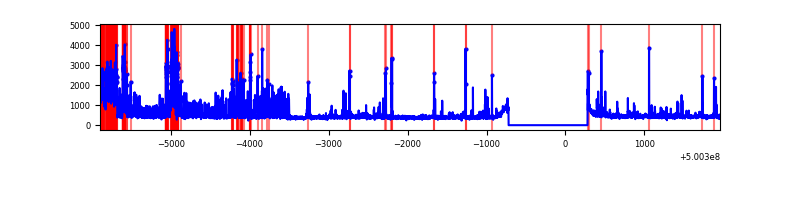 |
| D | 7850 | 6851 | 589 | 589 | 7.50% | 8.60% | 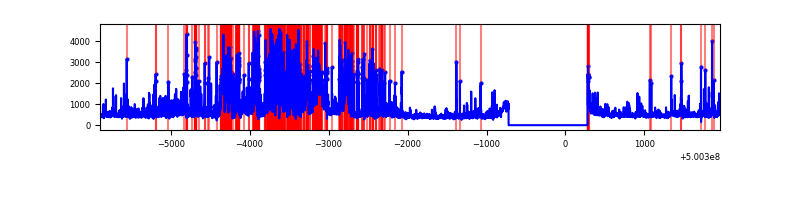 |
Top three noisy pixels from each quadrant. If the there are fewer than three noisy pixels in the level2.evt file, extra rows are filled as -1
| Pixel properties | Quadrant properties | ||||||
|---|---|---|---|---|---|---|---|
| Quadrant | DetID | PixID | Counts | Sigma | Mean | Median | Sigma |
| A | 4 | 206 | 332710 | 1870.61 | 715 | 697 | 177.5 |
| A | 3 | 14 | 123162 | 689.99 | 715 | 697 | 177.5 |
| A | 7 | 190 | 66054 | 368.23 | 715 | 697 | 177.5 |
| B | 2 | 249 | 1487262 | 10115.76 | 690 | 667 | 147.0 |
| B | 4 | 171 | 199126 | 1350.44 | 690 | 667 | 147.0 |
| B | 7 | 252 | 79287 | 534.98 | 690 | 667 | 147.0 |
| C | 9 | 38 | 924826 | 4892.49 | 685 | 680 | 188.9 |
| C | 14 | 254 | 252842 | 1334.96 | 685 | 680 | 188.9 |
| C | 13 | 3 | 132389 | 697.28 | 685 | 680 | 188.9 |
| D | 3 | 12 | 2150269 | 11213.19 | 673 | 645 | 191.7 |
| D | 11 | 129 | 479304 | 2496.85 | 673 | 645 | 191.7 |
| D | 5 | 173 | 59165 | 305.26 | 673 | 645 | 191.7 |
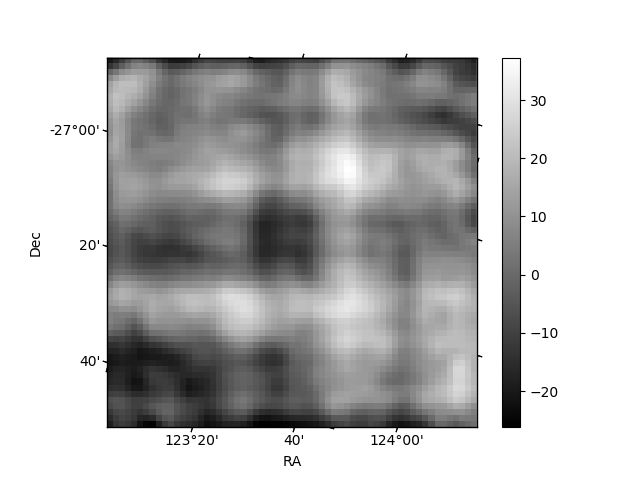
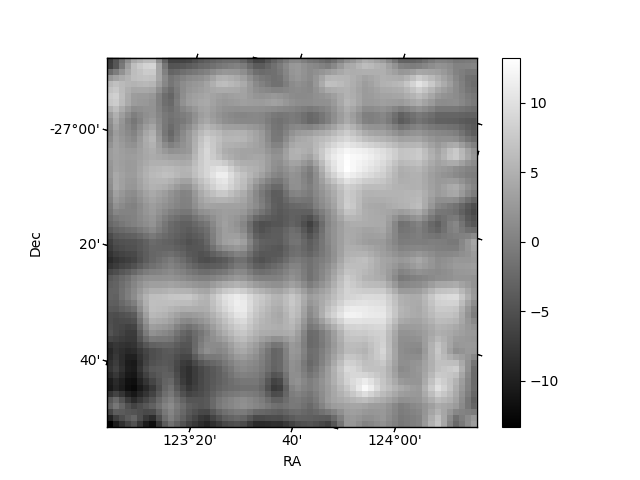
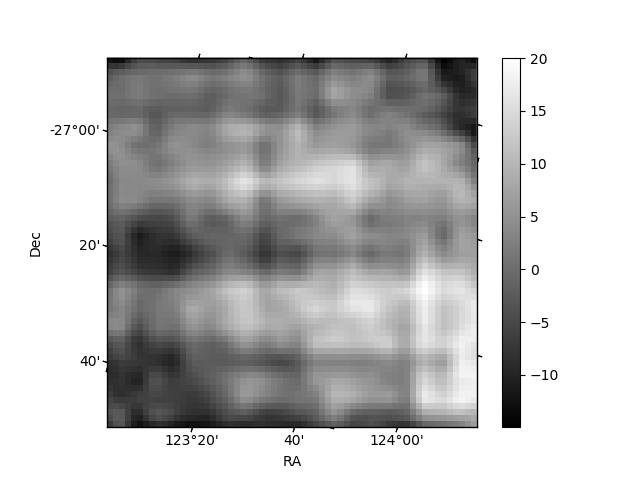
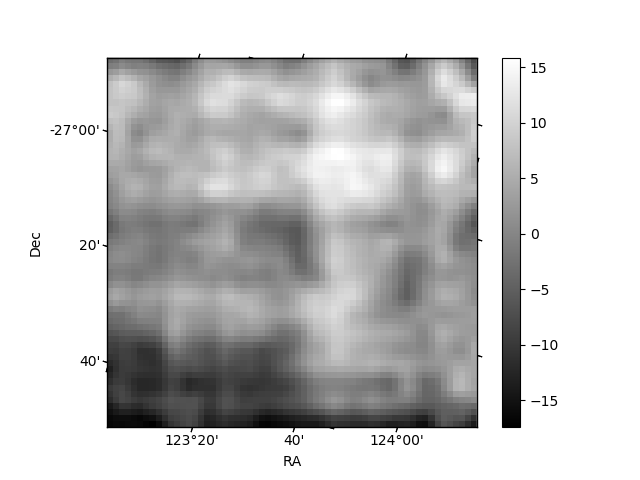
Histogram calculated using DETX and DETY for each event in the final _common_clean file
| Quadrant A | 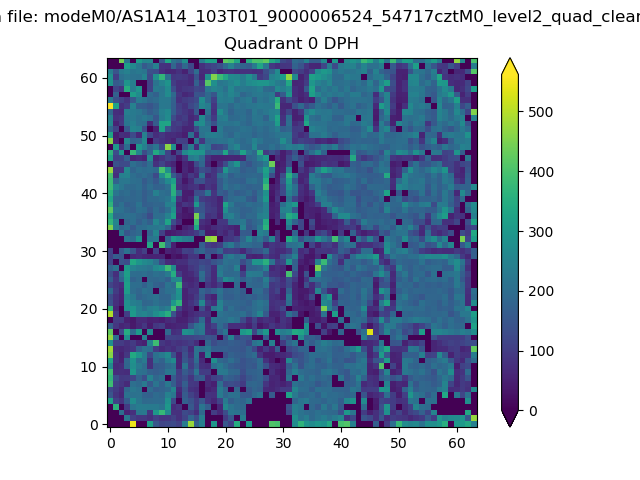 |
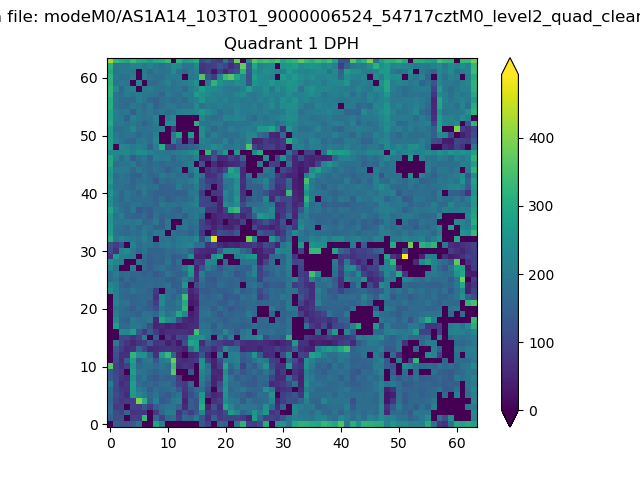 |
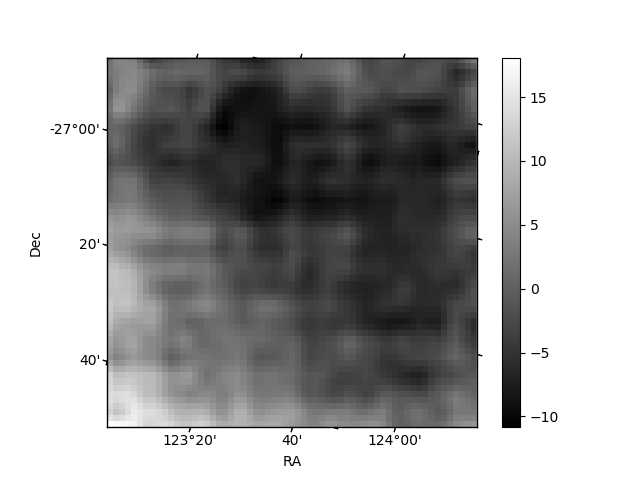
Quadrant B |
|---|---|---|---|
| Quadrant D | 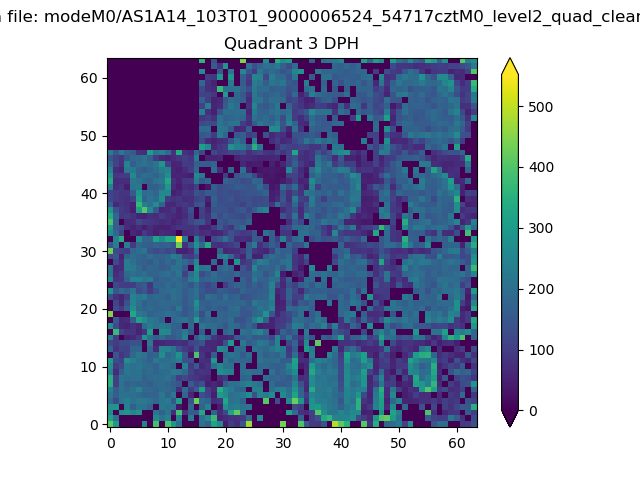 |
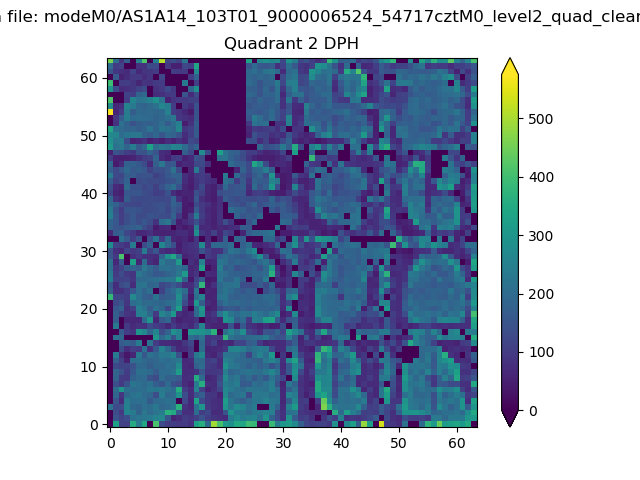 |
Quadrant C |
| Plot type | Count rate plots | Images |
|---|---|---|
| Comparison with Poisson distribution Blue bars denote a histogram of data divided into 1 sec bins. Red curve is a Poisson curve with rate = median count rate of data. |
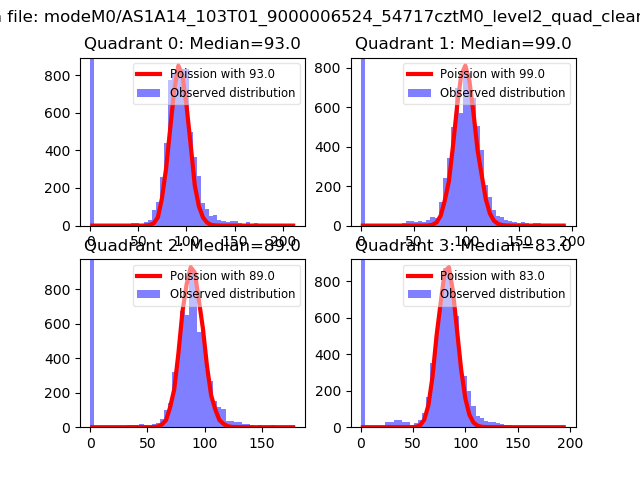 |
 |
| Quadrant-wise count rates Data is divided into 100 sec bins |
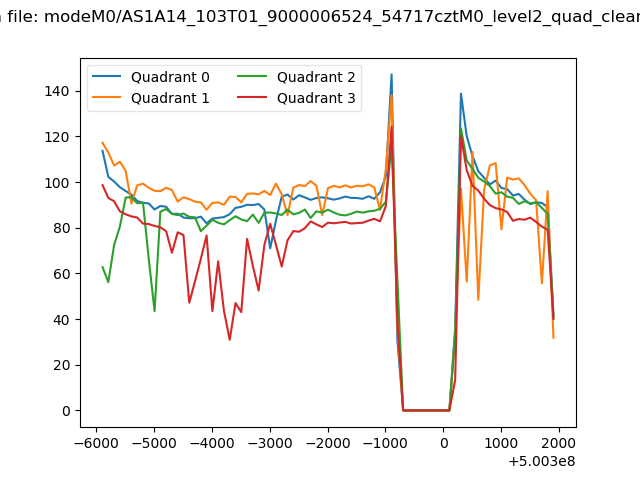 |
|
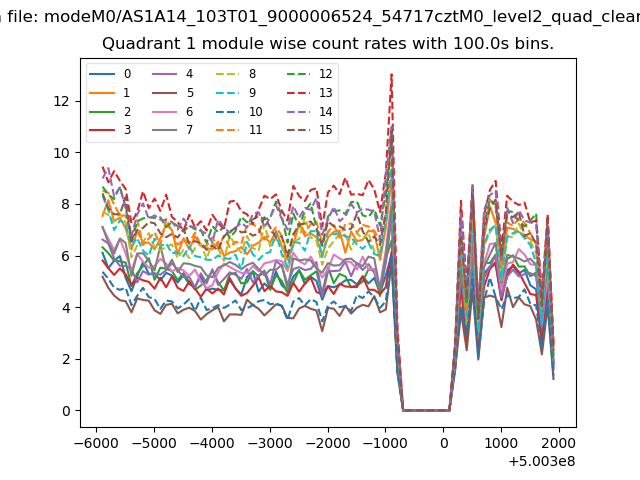
| Module-wise count rates for Quadrant A Data is divided into 100 sec bins |
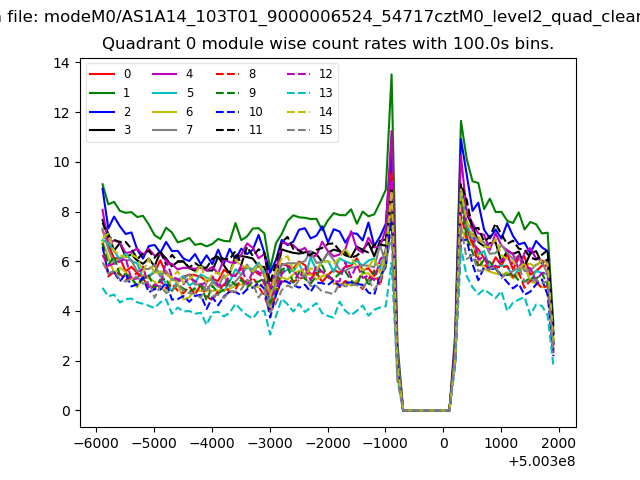 |
 |
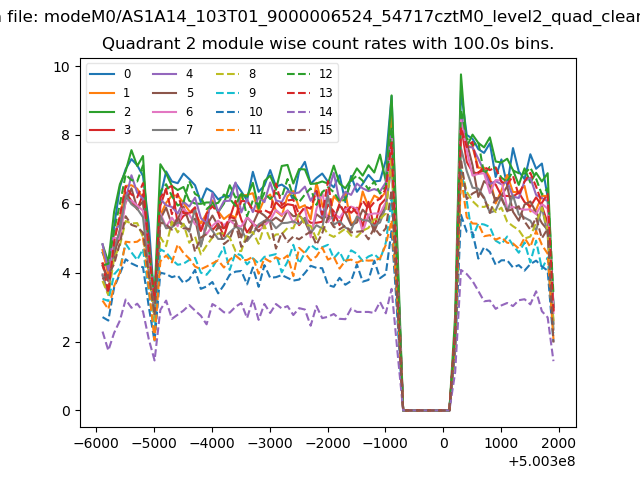
| Module-wise count rates for Quadrant B Data is divided into 100 sec bins |
 |
 |
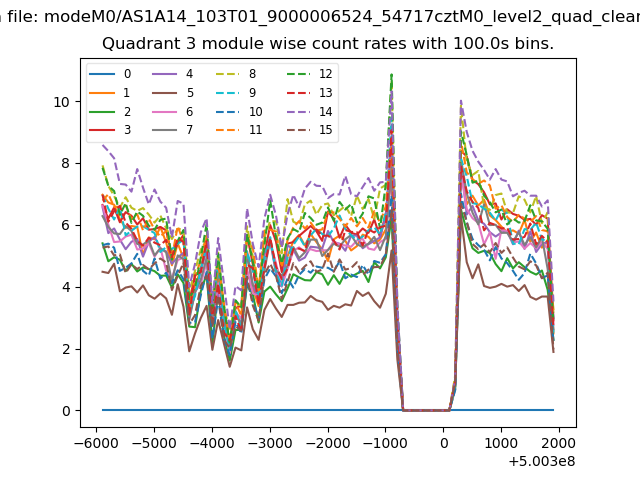
| Module-wise count rates for Quadrant C Data is divided into 100 sec bins |
 |
 |
| Module-wise count rates for Quadrant D Data is divided into 100 sec bins |
 |
 |
| Parameter | Plot |
|---|---|
| CZT HV Monitor | 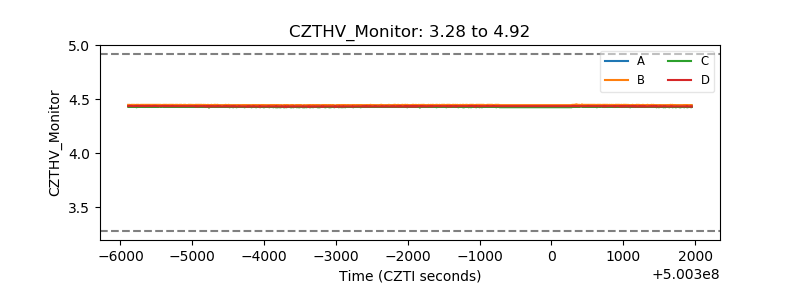 |
| D_VDD | 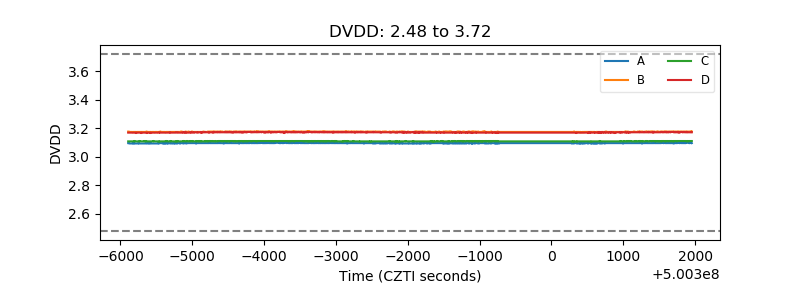 |
| Temperature 1 | 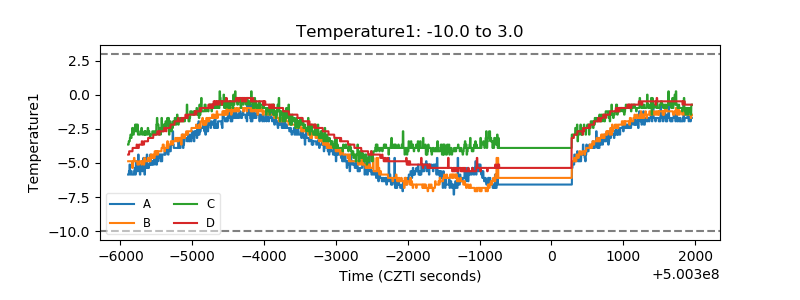 |
| Veto HV Monitor | 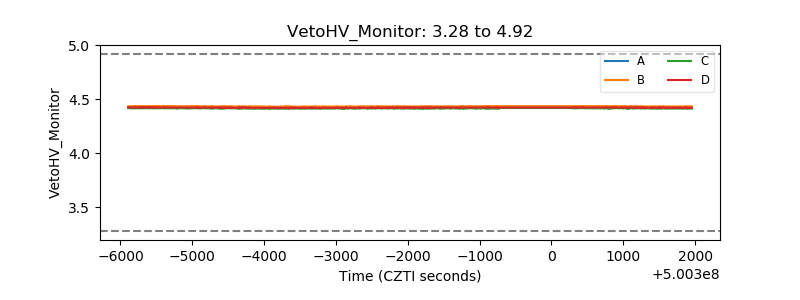 |
| Veto LLD | 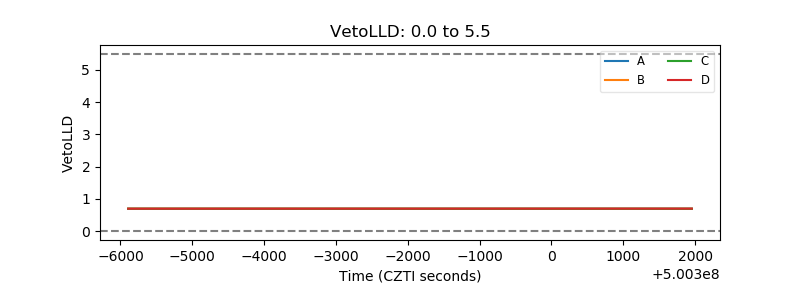 |
| Alpha Counter | 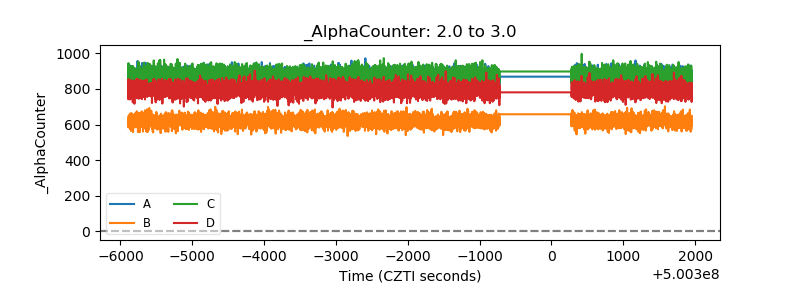 |
| _CPM_Rate | 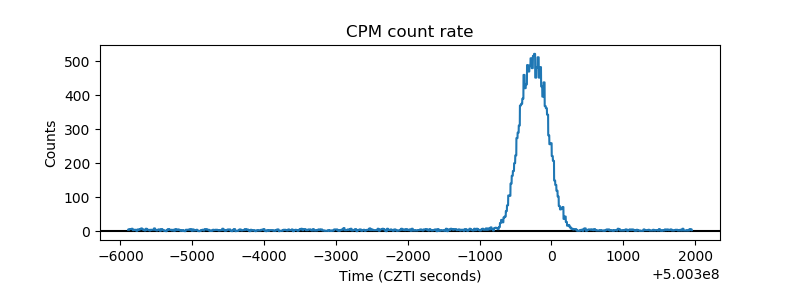 |
| CZT Counter | 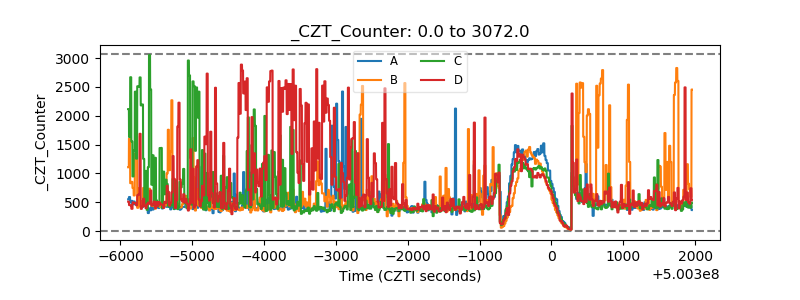 |
| +2.5 Volts monitor | 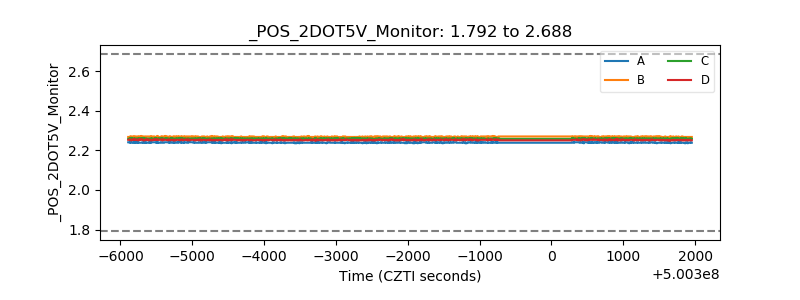 |
| +5 Volts monitor | 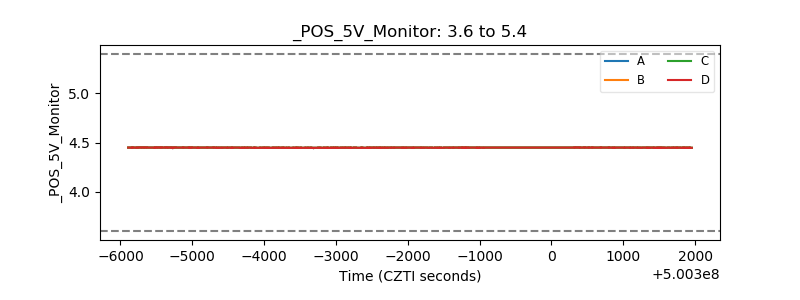 |
| _ROLL_ROT | 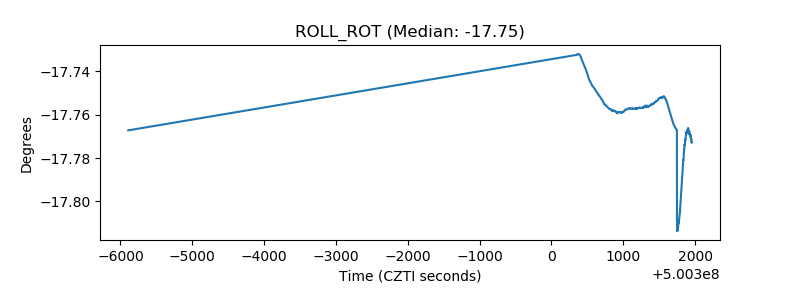 |
| _Roll_DEC | 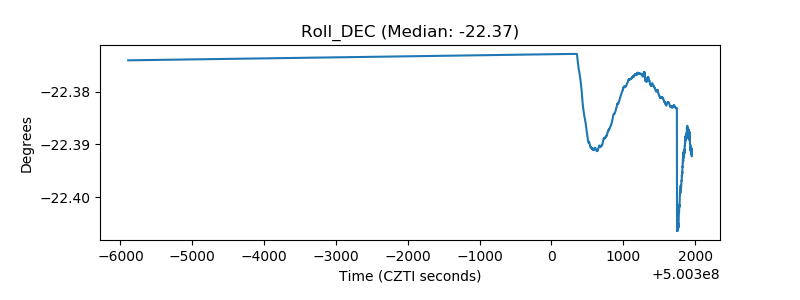 |
| _Roll_RA | 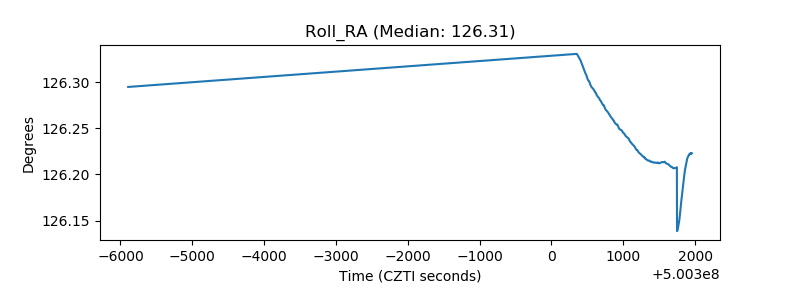 |
| Veto Counter | 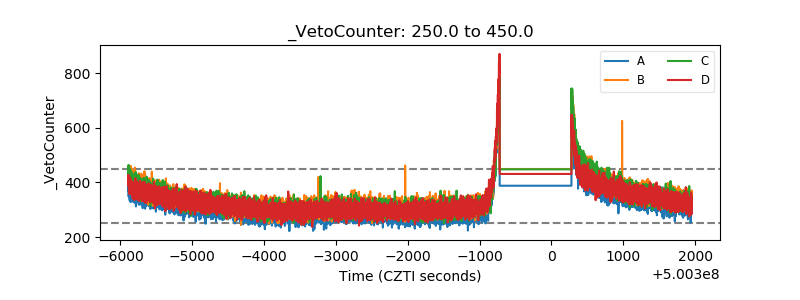 |