| Param | Original file | Final file |
|---|---|---|
| Filename | modeM0/AS1A14_103T01_9000006524_54718cztM0_level2.fits | modeM0/AS1A14_103T01_9000006524_54718cztM0_level2_quad_clean.evt |
| Size (bytes) | 2,440,713,600 | 468,832,320 |
| Size | 2.3 GB | 447.1 MB |
| Events in quadrant A | 17,395,410 | 3,084,639 |
| Events in quadrant B | 24,108,447 | 3,240,094 |
| Events in quadrant C | 21,847,206 | 2,811,851 |
| Events in quadrant D | 24,343,192 | 2,701,628 |
| Mode SS | |||
|---|---|---|---|
| Quadrant | BADHDUFLAG | Total packets | Discarded packets |
| A | 0 | 688 | 0 |
| B | 0 | 688 | 0 |
| C | 0 | 688 | 0 |
| D | 0 | 688 | 0 |
| Mode M0 | |||
|---|---|---|---|
| Quadrant | BADHDUFLAG | Total packets | Discarded packets |
| A | 0 | 77610 | 6 |
| B | 0 | 95726 | 3 |
| C | 0 | 90638 | 3 |
| D | 0 | 97147 | 3 |
| Mode M9 | |||
|---|---|---|---|
| Quadrant | BADHDUFLAG | Total packets | Discarded packets |
| A | 0 | 17 | 0 |
| B | 0 | 17 | 0 |
| C | 0 | 17 | 0 |
| D | 0 | 17 | 0 |
| Quadrant | Total seconds | Saturated seconds | Saturation percentage |
|---|---|---|---|
| A | 34311 | 890 | 2.593920% |
| B | 34314 | 1972 | 5.746925% |
| C | 34314 | 2806 | 8.177420% |
| D | 34314 | 2224 | 6.481320% |
Noise dominated data is calculated using 1-second bins in cleaned event files. If a bin has >2000 counts, and if more than 50% of those come from <1% of pixels, then it is considered to be noise-dominated and hence unusable.
| Quadrant | # 1 sec bins | Bins with >0 counts | Bins with >2000 counts | High rate bins dominated by noise | Noise dominated (total time) | Noise dominated (detector-on time) | Marked lightcurve |
|---|---|---|---|---|---|---|---|
| A | 51317 | 34315 | 576 | 576 | 1.12% | 1.68% | 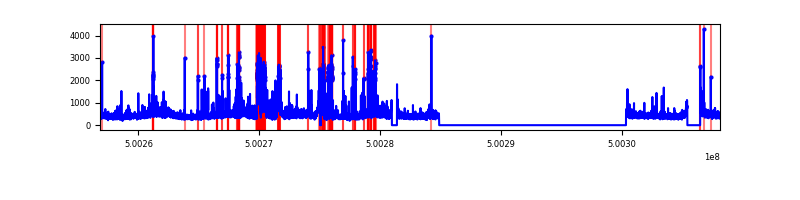 |
| B | 51318 | 34318 | 1261 | 1261 | 2.46% | 3.67% | 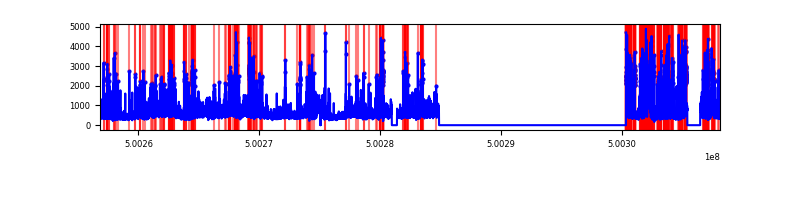 |
| C | 51318 | 34319 | 1354 | 1354 | 2.64% | 3.95% | 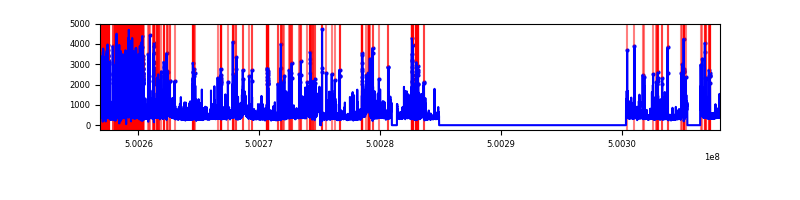 |
| D | 51318 | 34319 | 1781 | 1781 | 3.47% | 5.19% | 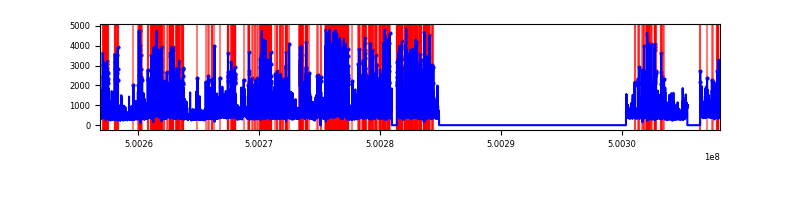 |
Top three noisy pixels from each quadrant. If the there are fewer than three noisy pixels in the level2.evt file, extra rows are filled as -1
| Pixel properties | Quadrant properties | ||||||
|---|---|---|---|---|---|---|---|
| Quadrant | DetID | PixID | Counts | Sigma | Mean | Median | Sigma |
| A | 7 | 14 | 1972686 | 2269.14 | 3507 | 3422 | 867.8 |
| A | 3 | 14 | 587016 | 672.46 | 3507 | 3422 | 867.8 |
| A | 0 | 8 | 575137 | 658.77 | 3507 | 3422 | 867.8 |
| B | 2 | 249 | 6450116 | 8874.59 | 3418 | 3289 | 726.4 |
| B | 7 | 0 | 2927391 | 4025.27 | 3418 | 3289 | 726.4 |
| B | 10 | 247 | 348402 | 475.08 | 3418 | 3289 | 726.4 |
| C | 15 | 219 | 4608499 | 5074.95 | 3312 | 3285 | 907.4 |
| C | 15 | 157 | 811996 | 891.2 | 3312 | 3285 | 907.4 |
| C | 3 | 248 | 527972 | 578.21 | 3312 | 3285 | 907.4 |
| D | 15 | 94 | 4654162 | 4913.52 | 3354 | 3217 | 946.6 |
| D | 11 | 129 | 2470744 | 2606.84 | 3354 | 3217 | 946.6 |
| D | 3 | 12 | 1877835 | 1980.45 | 3354 | 3217 | 946.6 |
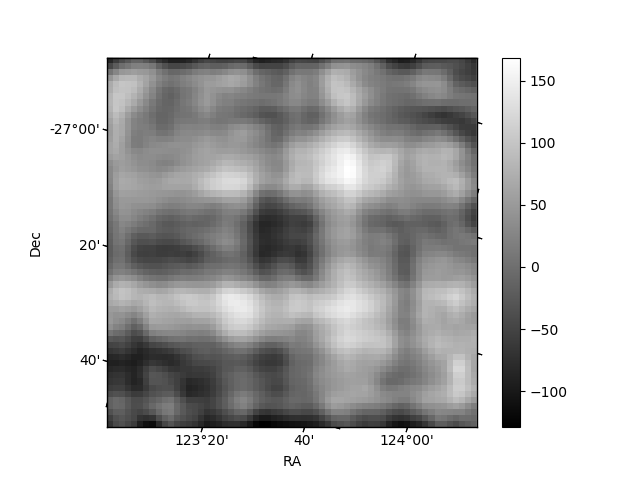
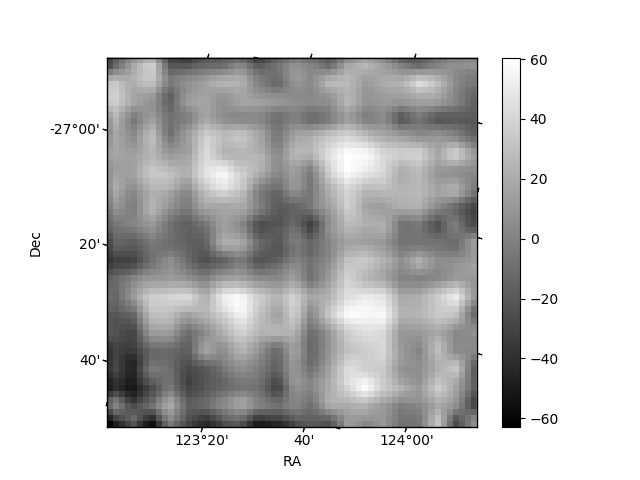
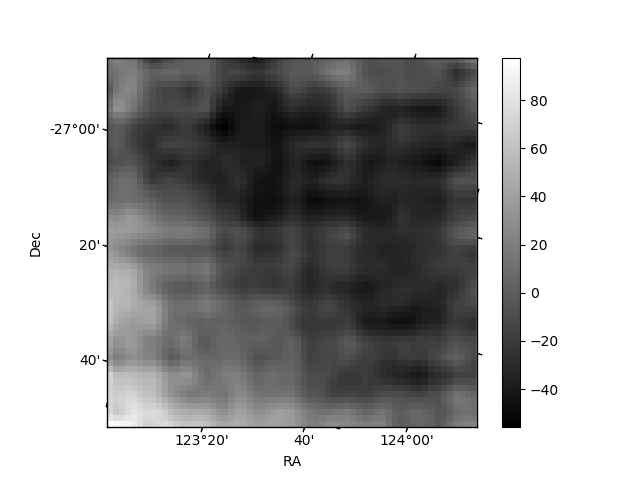
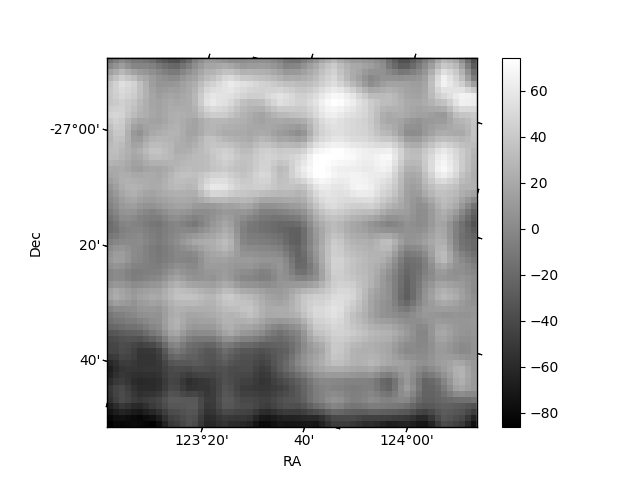
Histogram calculated using DETX and DETY for each event in the final _common_clean file
| Quadrant A | 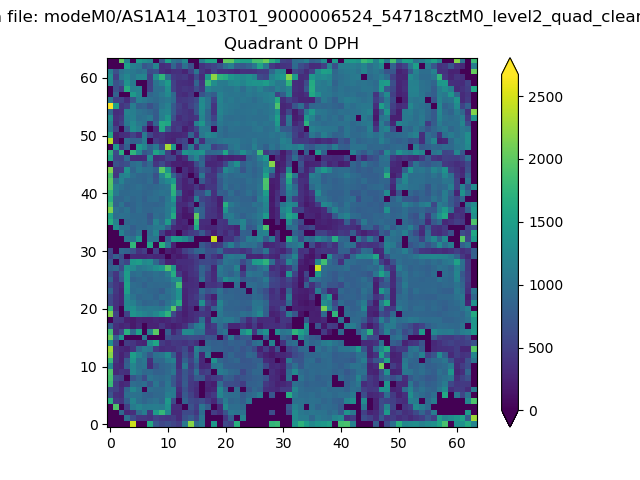 |
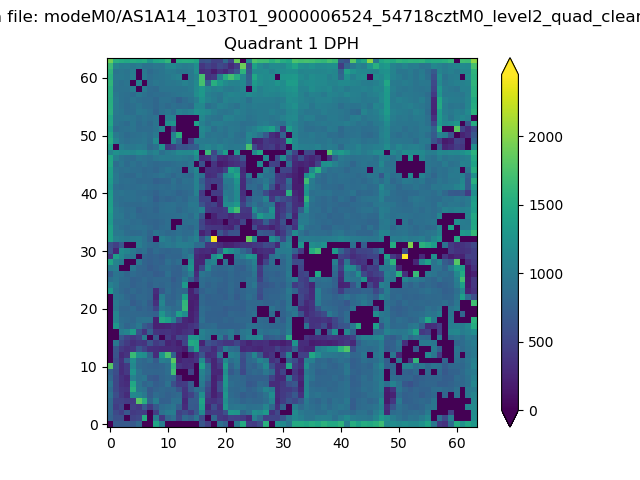 |
Quadrant B |
|---|---|---|---|
| Quadrant D | 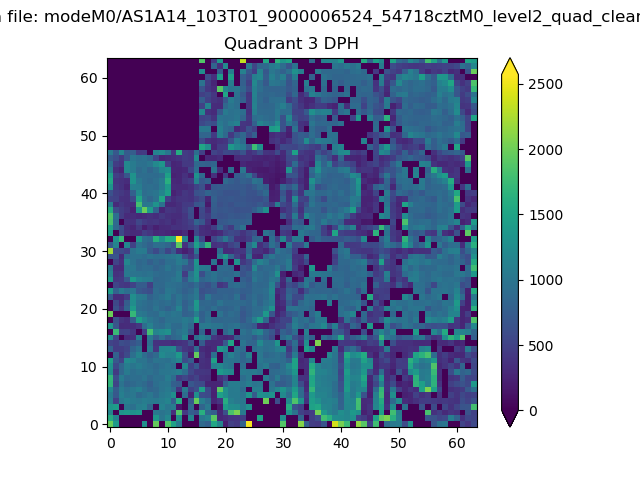 |
 |
Quadrant C |
| Plot type | Count rate plots | Images |
|---|---|---|
| Comparison with Poisson distribution Blue bars denote a histogram of data divided into 1 sec bins. Red curve is a Poisson curve with rate = median count rate of data. |
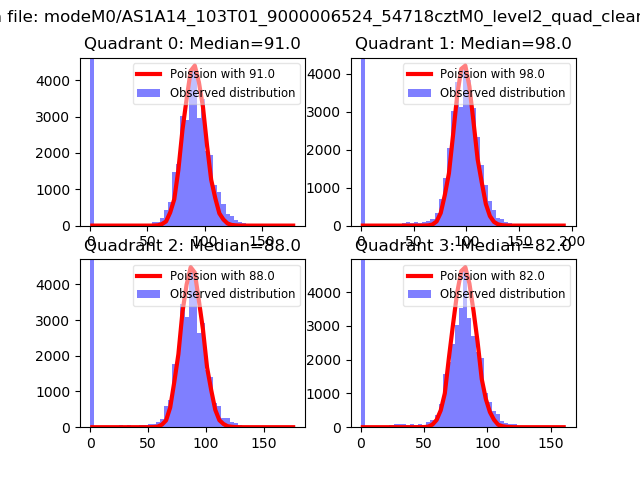 |
 |
| Quadrant-wise count rates Data is divided into 100 sec bins |
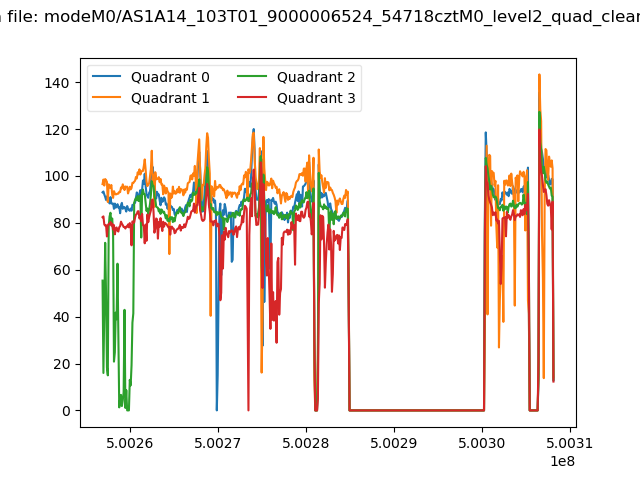 |
|
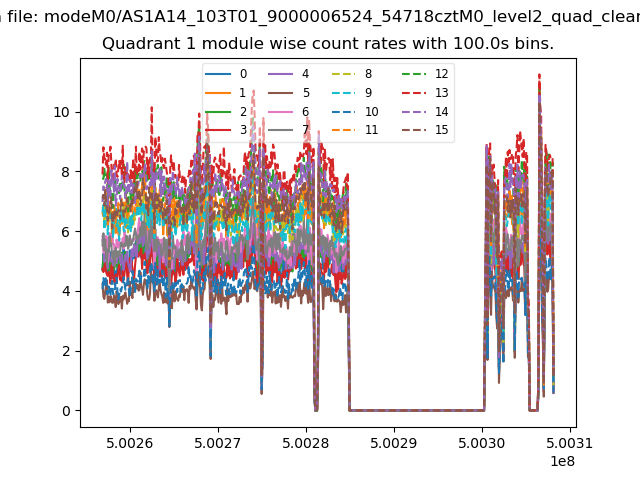
| Module-wise count rates for Quadrant A Data is divided into 100 sec bins |
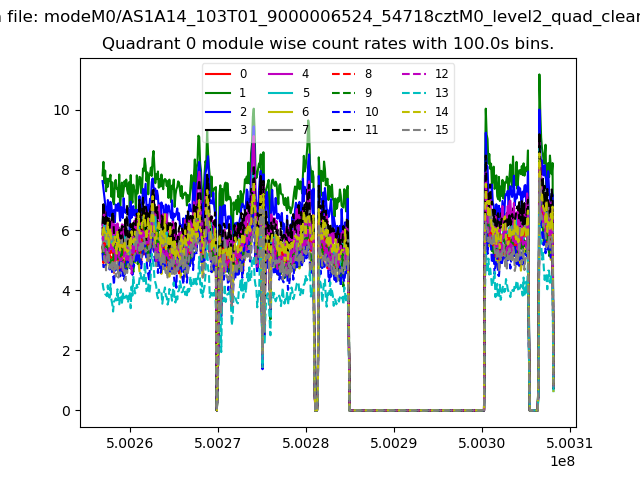 |
 |
| Module-wise count rates for Quadrant B Data is divided into 100 sec bins |
 |
 |
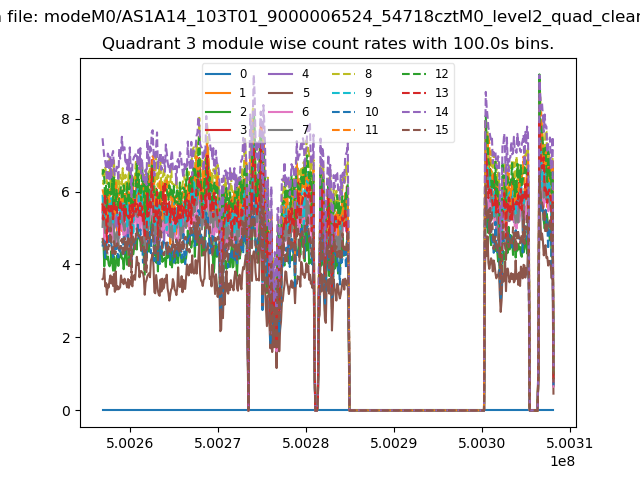
| Module-wise count rates for Quadrant C Data is divided into 100 sec bins |
 |
 |
| Module-wise count rates for Quadrant D Data is divided into 100 sec bins |
 |
 |
| Parameter | Plot |
|---|---|
| CZT HV Monitor | 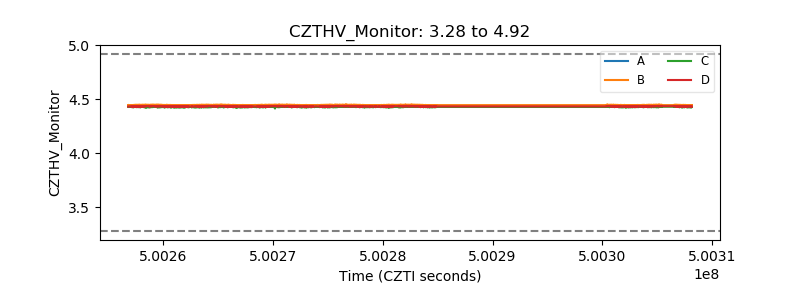 |
| D_VDD | 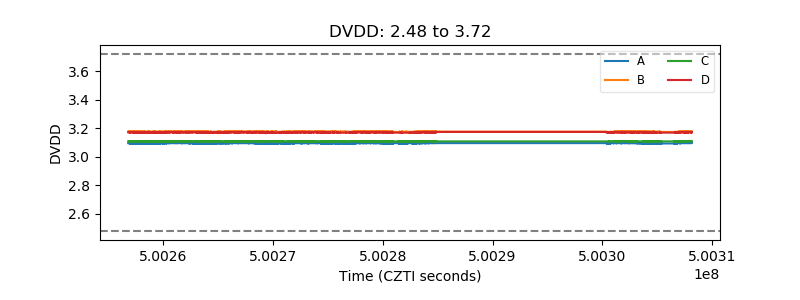 |
| Temperature 1 | 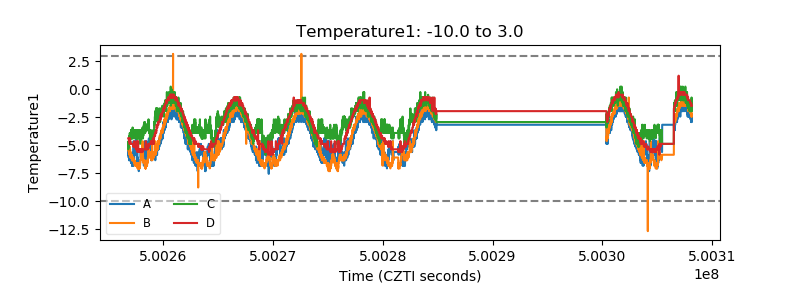 |
| Veto HV Monitor | 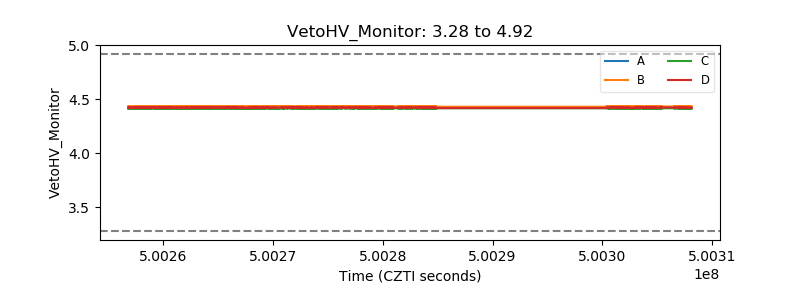 |
| Veto LLD | 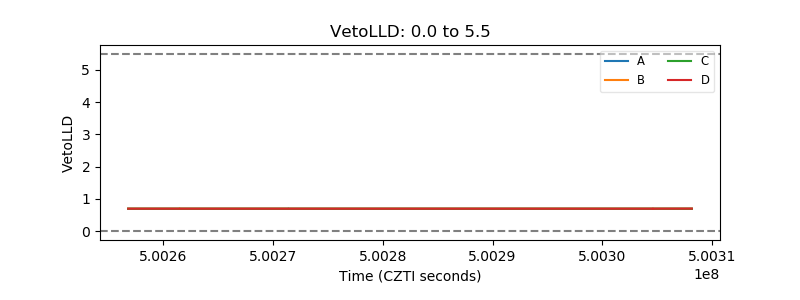 |
| Alpha Counter | 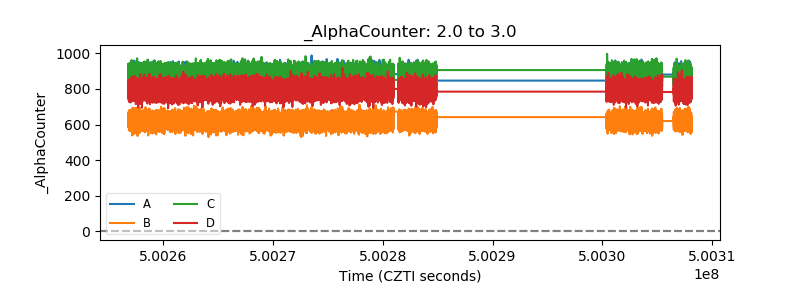 |
| _CPM_Rate | 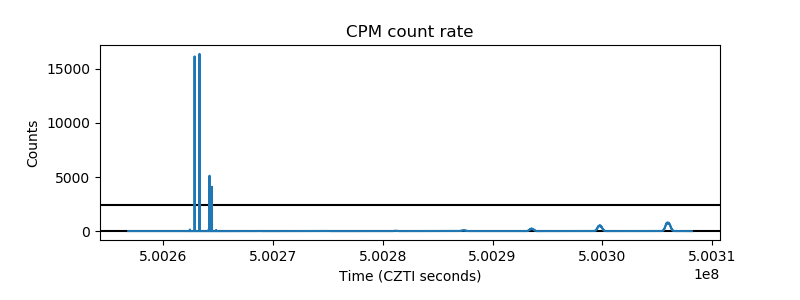 |
| CZT Counter | 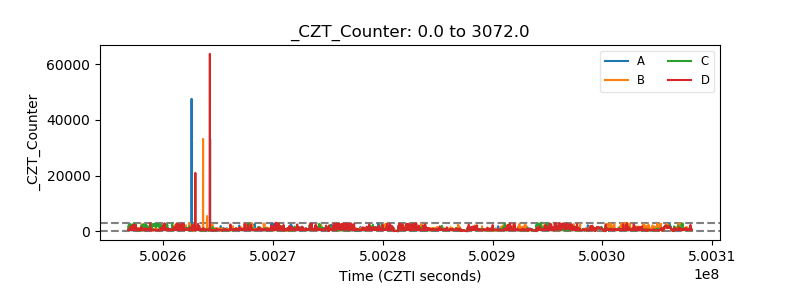 |
| +2.5 Volts monitor |  |
| +5 Volts monitor |  |
| _ROLL_ROT | 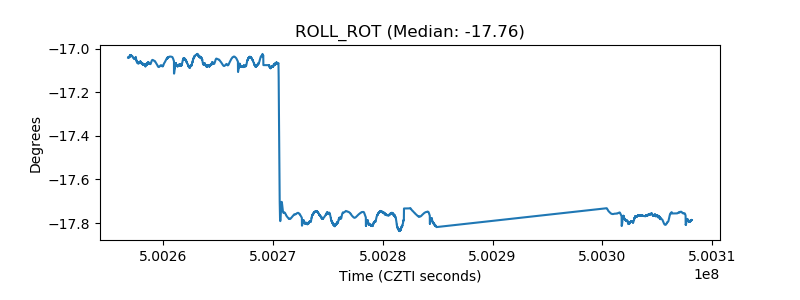 |
| _Roll_DEC | 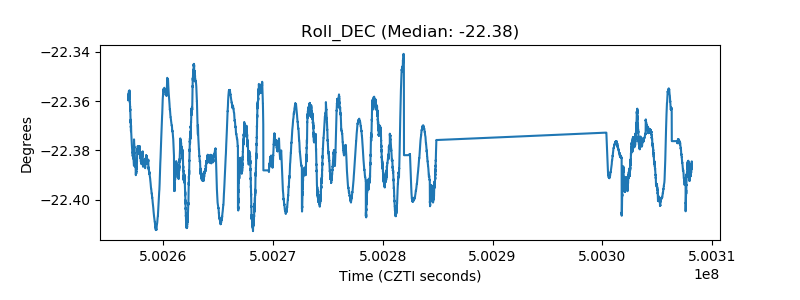 |
| _Roll_RA | 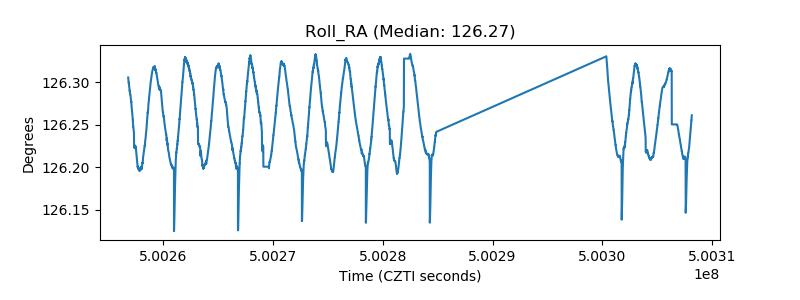 |
| Veto Counter | 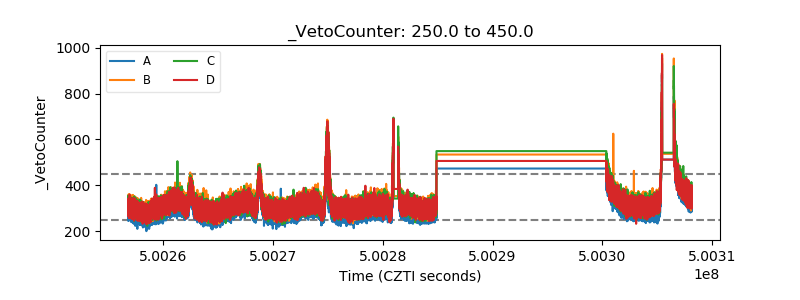 |