| Param | Original file | Final file |
|---|---|---|
| Filename | modeM0/AS1A14_103T01_9000006524_54721cztM0_level2.fits | modeM0/AS1A14_103T01_9000006524_54721cztM0_level2_quad_clean.evt |
| Size (bytes) | 484,050,240 | 94,985,280 |
| Size | 461.6 MB | 90.6 MB |
| Events in quadrant A | 3,220,661 | 635,925 |
| Events in quadrant B | 3,643,222 | 679,990 |
| Events in quadrant C | 4,966,529 | 573,773 |
| Events in quadrant D | 5,574,775 | 526,655 |
| Mode SS | |||
|---|---|---|---|
| Quadrant | BADHDUFLAG | Total packets | Discarded packets |
| A | 0 | 134 | 0 |
| B | 0 | 134 | 0 |
| C | 0 | 134 | 0 |
| D | 0 | 134 | 0 |
| Mode M0 | |||
|---|---|---|---|
| Quadrant | BADHDUFLAG | Total packets | Discarded packets |
| A | 0 | 14536 | 2 |
| B | 0 | 15426 | 2 |
| C | 0 | 19539 | 2 |
| D | 0 | 21179 | 2 |
| Mode M9 | |||
|---|---|---|---|
| Quadrant | BADHDUFLAG | Total packets | Discarded packets |
| A | 0 | 18 | 0 |
| B | 0 | 19 | 0 |
| C | 0 | 19 | 0 |
| D | 0 | 19 | 0 |
| Quadrant | Total seconds | Saturated seconds | Saturation percentage |
|---|---|---|---|
| A | 6596 | 169 | 2.562159% |
| B | 6595 | 220 | 3.335861% |
| C | 6595 | 523 | 7.930250% |
| D | 6595 | 667 | 10.113723% |
Noise dominated data is calculated using 1-second bins in cleaned event files. If a bin has >2000 counts, and if more than 50% of those come from <1% of pixels, then it is considered to be noise-dominated and hence unusable.
| Quadrant | # 1 sec bins | Bins with >0 counts | Bins with >2000 counts | High rate bins dominated by noise | Noise dominated (total time) | Noise dominated (detector-on time) | Marked lightcurve |
|---|---|---|---|---|---|---|---|
| A | 7701 | 6597 | 93 | 93 | 1.21% | 1.41% | 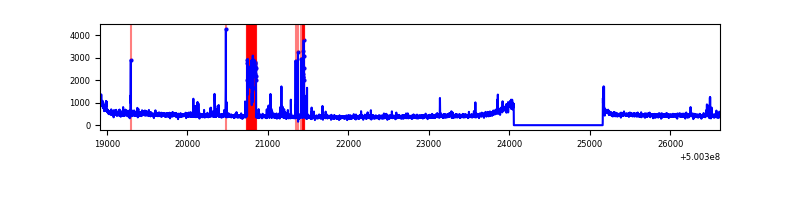 |
| B | 7700 | 6596 | 90 | 90 | 1.17% | 1.36% | 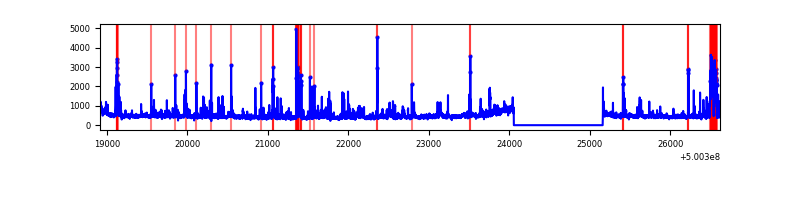 |
| C | 7700 | 6596 | 517 | 517 | 6.71% | 7.84% | 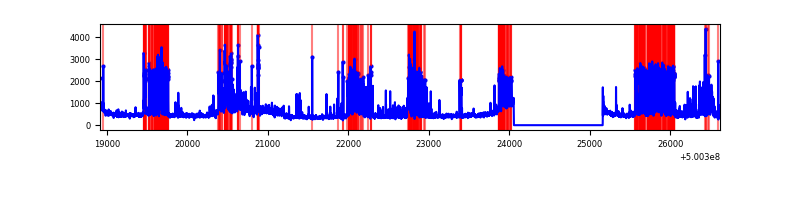 |
| D | 7700 | 6596 | 495 | 495 | 6.43% | 7.50% | 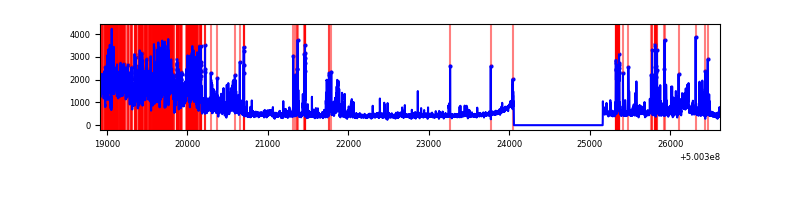 |
Top three noisy pixels from each quadrant. If the there are fewer than three noisy pixels in the level2.evt file, extra rows are filled as -1
| Pixel properties | Quadrant properties | ||||||
|---|---|---|---|---|---|---|---|
| Quadrant | DetID | PixID | Counts | Sigma | Mean | Median | Sigma |
| A | 4 | 249 | 300274 | 1687.48 | 713 | 693 | 177.5 |
| A | 8 | 246 | 45734 | 253.71 | 713 | 693 | 177.5 |
| A | 7 | 190 | 38332 | 212.01 | 713 | 693 | 177.5 |
| B | 2 | 249 | 208156 | 1381.74 | 702 | 678 | 150.2 |
| B | 0 | 173 | 186561 | 1237.92 | 702 | 678 | 150.2 |
| B | 7 | 252 | 114479 | 757.88 | 702 | 678 | 150.2 |
| C | 9 | 38 | 1378435 | 7393.52 | 677 | 670 | 186.3 |
| C | 12 | 252 | 260704 | 1395.42 | 677 | 670 | 186.3 |
| C | 1 | 16 | 232812 | 1245.75 | 677 | 670 | 186.3 |
| D | 2 | 62 | 1398378 | 7367.79 | 664 | 635 | 189.7 |
| D | 11 | 129 | 843047 | 4440.53 | 664 | 635 | 189.7 |
| D | 14 | 52 | 117680 | 616.97 | 664 | 635 | 189.7 |
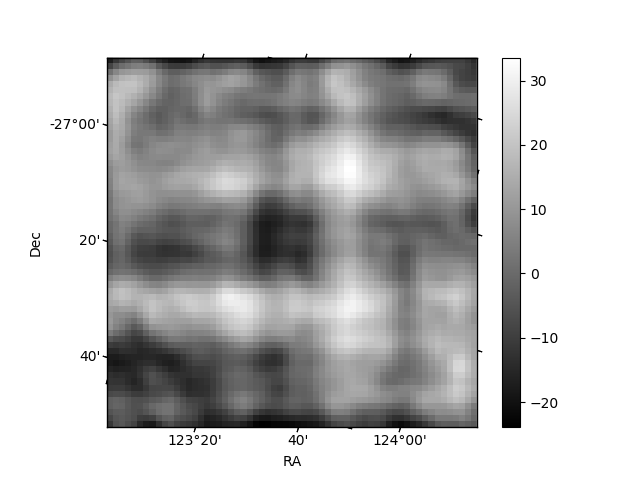
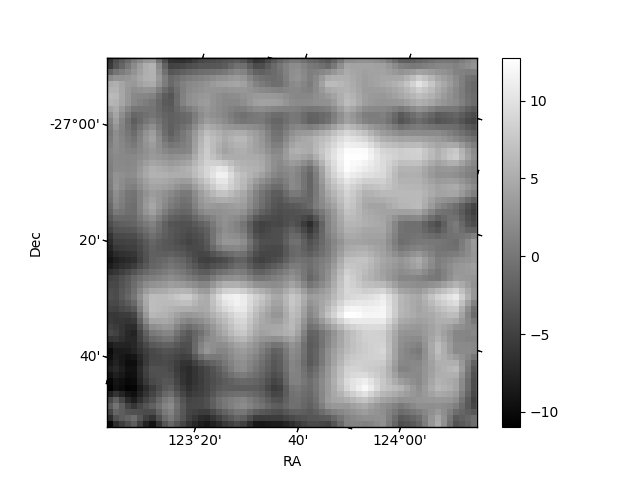
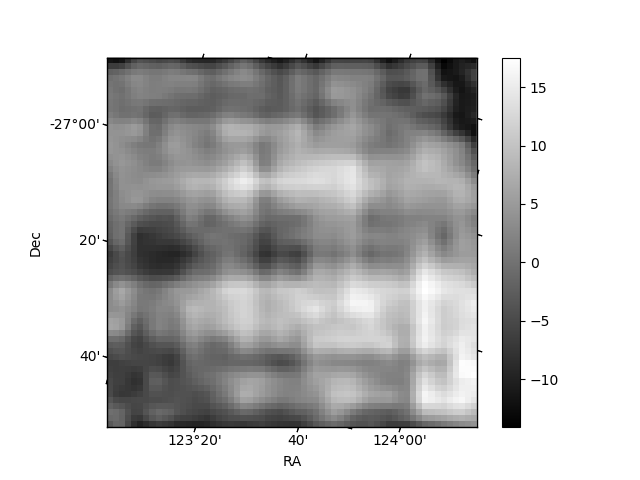
Histogram calculated using DETX and DETY for each event in the final _common_clean file
| Quadrant A | 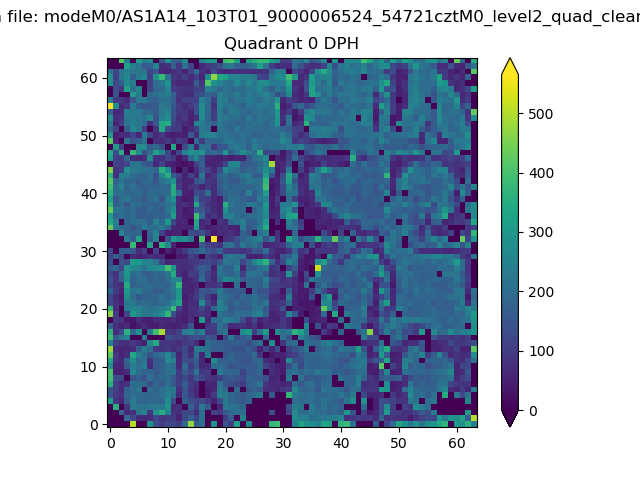 |
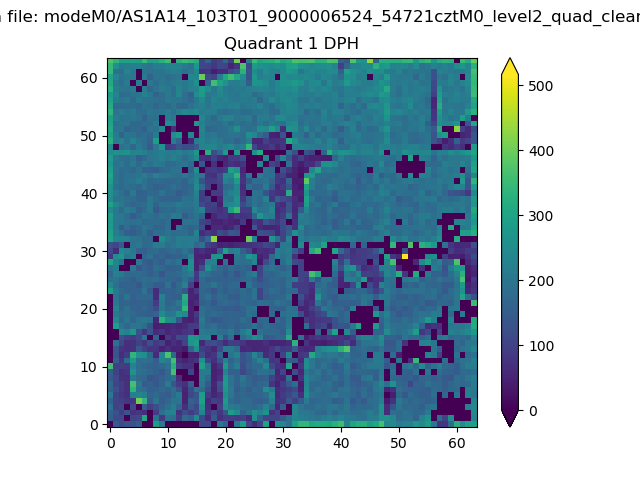 |
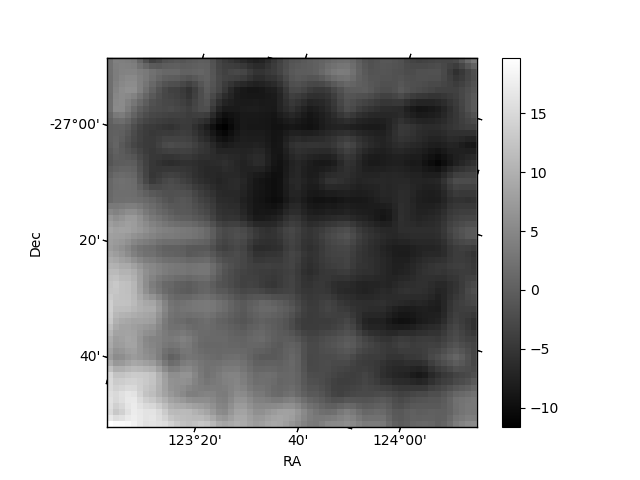
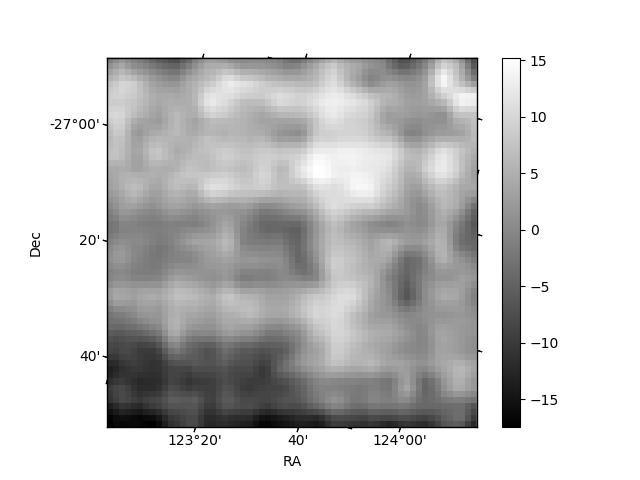
Quadrant B |
|---|---|---|---|
| Quadrant D | 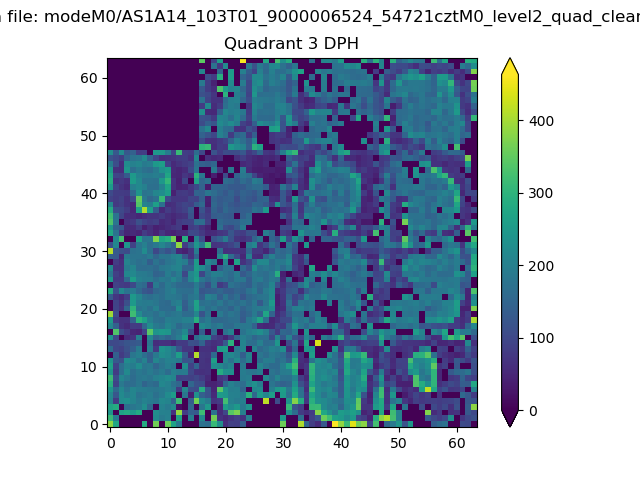 |
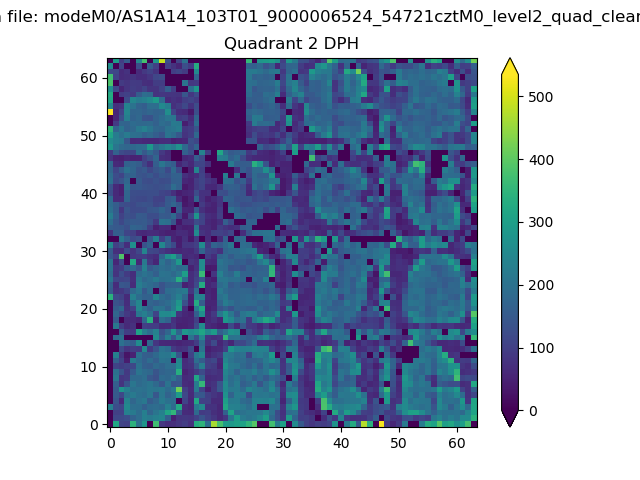 |
Quadrant C |
| Plot type | Count rate plots | Images |
|---|---|---|
| Comparison with Poisson distribution Blue bars denote a histogram of data divided into 1 sec bins. Red curve is a Poisson curve with rate = median count rate of data. |
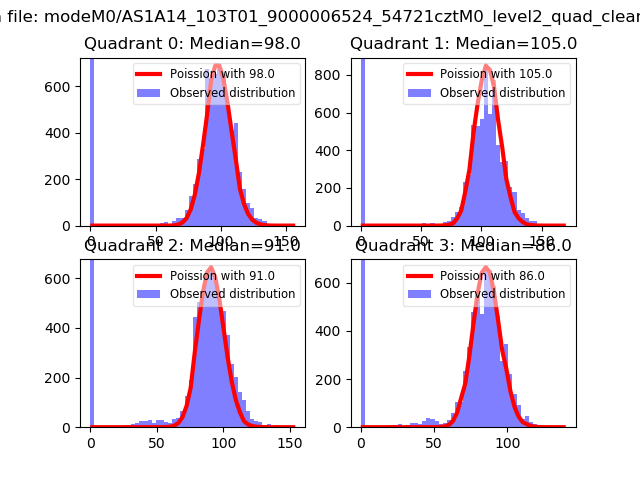 |
 |
| Quadrant-wise count rates Data is divided into 100 sec bins |
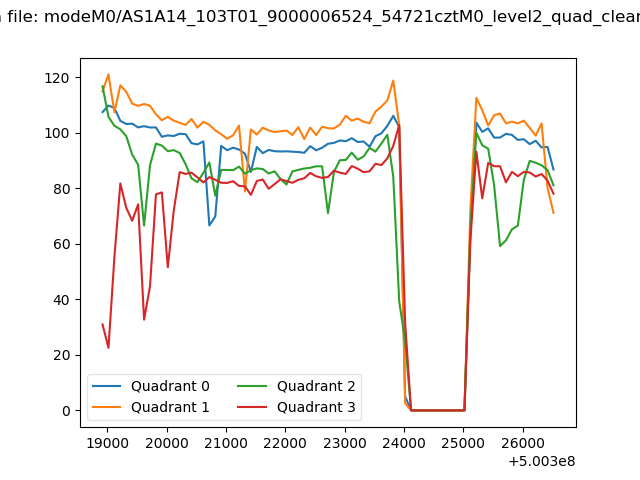 |
|
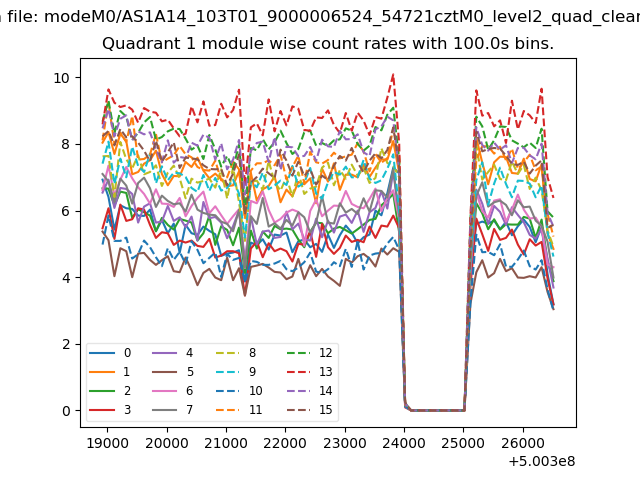
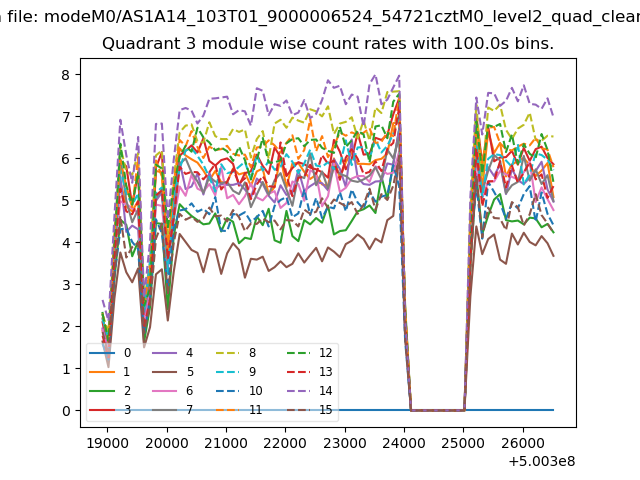
| Module-wise count rates for Quadrant A Data is divided into 100 sec bins |
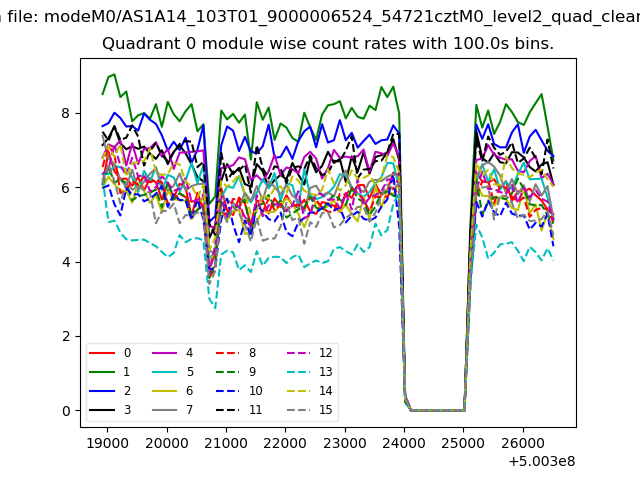 |
 |
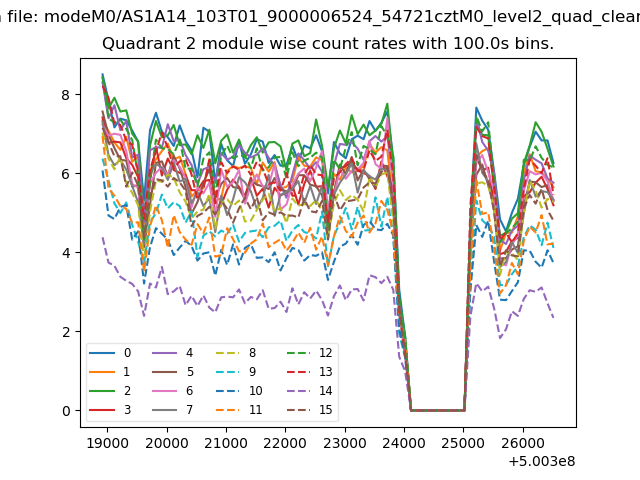
| Module-wise count rates for Quadrant B Data is divided into 100 sec bins |
 |
 |
| Module-wise count rates for Quadrant C Data is divided into 100 sec bins |
 |
 |
| Module-wise count rates for Quadrant D Data is divided into 100 sec bins |
 |
 |
| Parameter | Plot |
|---|---|
| CZT HV Monitor | 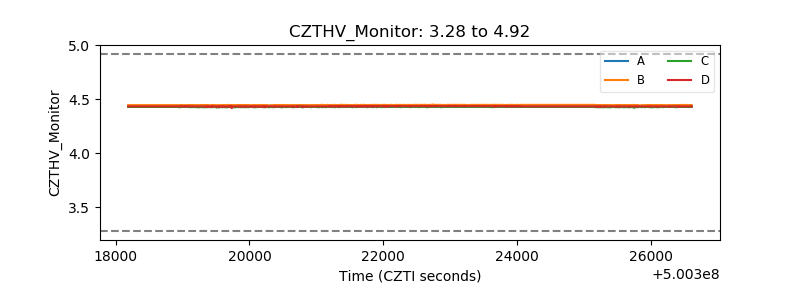 |
| D_VDD | 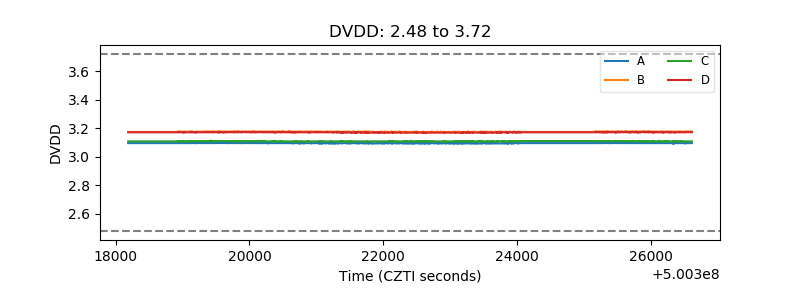 |
| Temperature 1 | 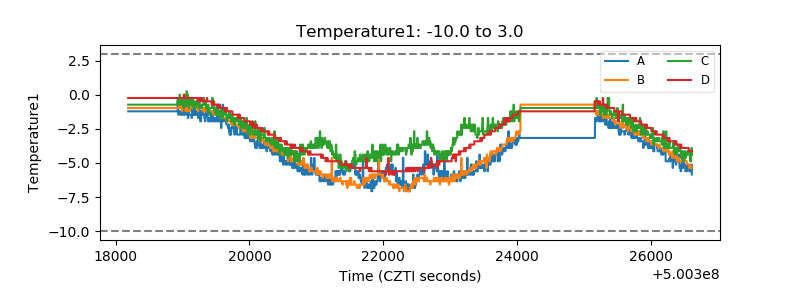 |
| Veto HV Monitor | 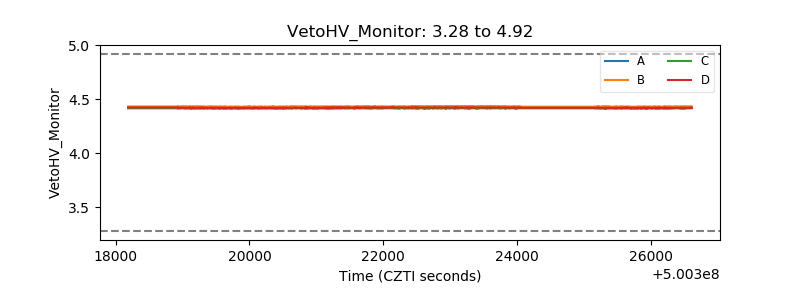 |
| Veto LLD | 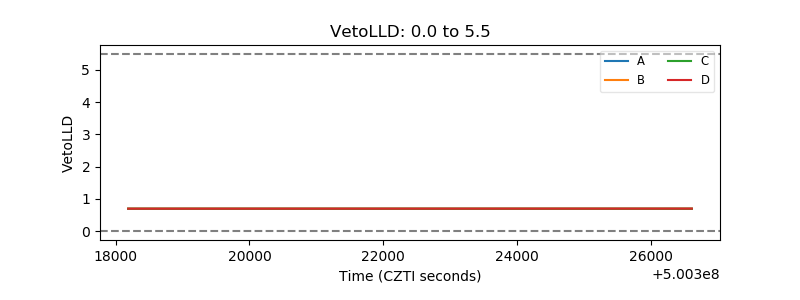 |
| Alpha Counter | 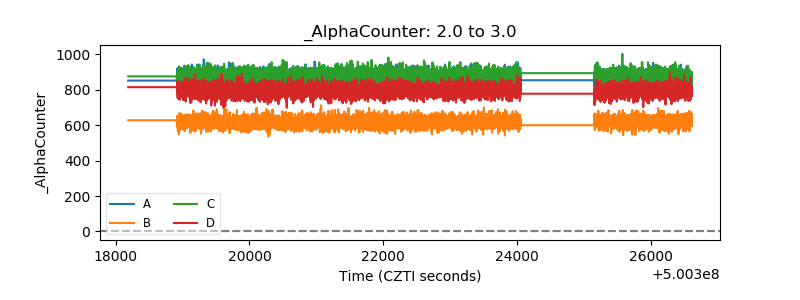 |
| _CPM_Rate | 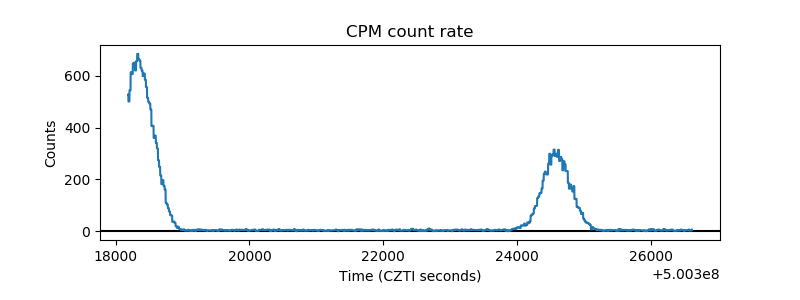 |
| CZT Counter | 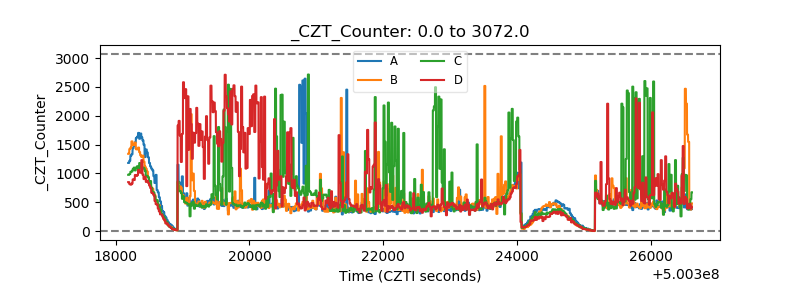 |
| +2.5 Volts monitor | 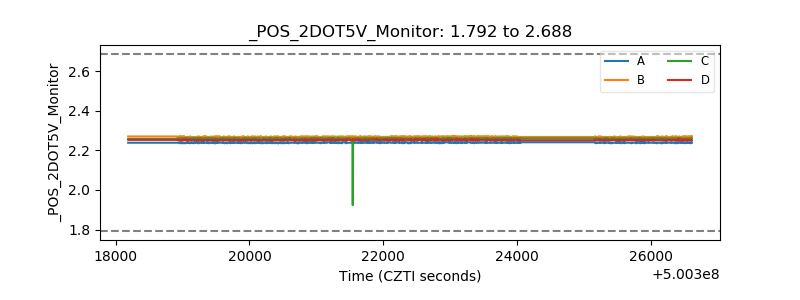 |
| +5 Volts monitor |  |
| _ROLL_ROT | 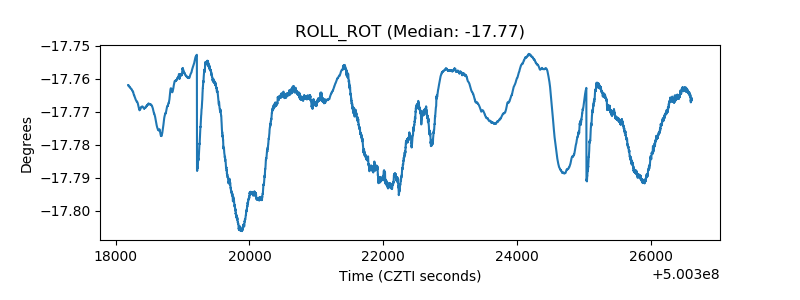 |
| _Roll_DEC | 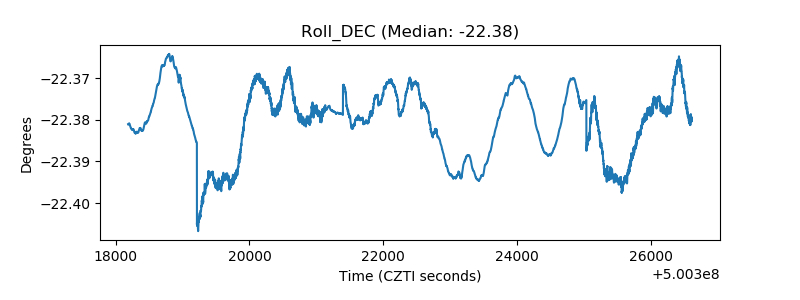 |
| _Roll_RA | 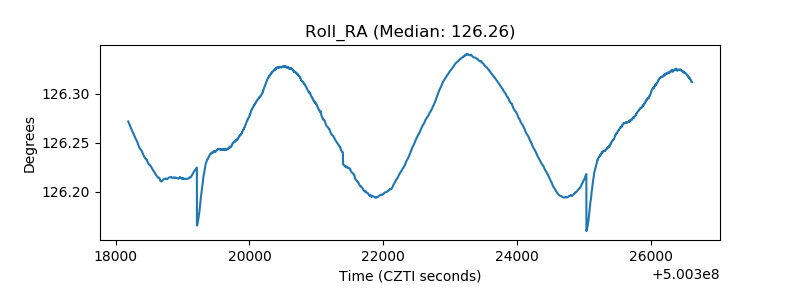 |
| Veto Counter | 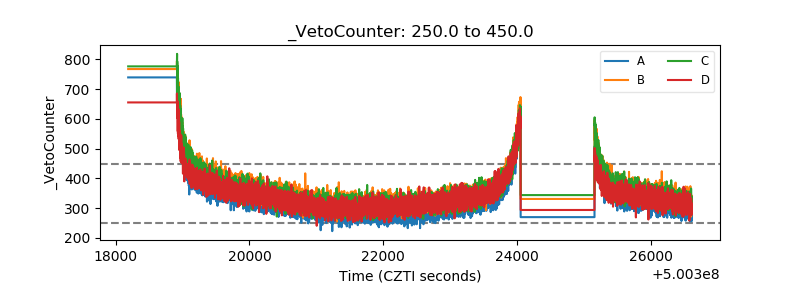 |