| Param | Original file | Final file |
|---|---|---|
| Filename | modeM0/AS1A14_103T01_9000006524_54722cztM0_level2.fits | modeM0/AS1A14_103T01_9000006524_54722cztM0_level2_quad_clean.evt |
| Size (bytes) | 459,158,400 | 95,679,360 |
| Size | 437.9 MB | 91.2 MB |
| Events in quadrant A | 2,929,406 | 639,509 |
| Events in quadrant B | 5,218,208 | 641,289 |
| Events in quadrant C | 4,280,373 | 581,601 |
| Events in quadrant D | 4,043,997 | 564,685 |
| Mode SS | |||
|---|---|---|---|
| Quadrant | BADHDUFLAG | Total packets | Discarded packets |
| A | 0 | 136 | 0 |
| B | 0 | 136 | 0 |
| C | 0 | 136 | 0 |
| D | 0 | 136 | 0 |
| Mode M0 | |||
|---|---|---|---|
| Quadrant | BADHDUFLAG | Total packets | Discarded packets |
| A | 0 | 13927 | 1 |
| B | 0 | 20223 | 1 |
| C | 0 | 17891 | 1 |
| D | 0 | 16711 | 1 |
| Mode M9 | |||
|---|---|---|---|
| Quadrant | BADHDUFLAG | Total packets | Discarded packets |
| A | 0 | 9 | 0 |
| B | 0 | 9 | 0 |
| C | 0 | 9 | 0 |
| D | 0 | 9 | 0 |
| Quadrant | Total seconds | Saturated seconds | Saturation percentage |
|---|---|---|---|
| A | 6745 | 25 | 0.370645% |
| B | 6746 | 568 | 8.419804% |
| C | 6746 | 366 | 5.425437% |
| D | 6746 | 125 | 1.852950% |
Noise dominated data is calculated using 1-second bins in cleaned event files. If a bin has >2000 counts, and if more than 50% of those come from <1% of pixels, then it is considered to be noise-dominated and hence unusable.
| Quadrant | # 1 sec bins | Bins with >0 counts | Bins with >2000 counts | High rate bins dominated by noise | Noise dominated (total time) | Noise dominated (detector-on time) | Marked lightcurve |
|---|---|---|---|---|---|---|---|
| A | 7610 | 6746 | 0 | 0 | 0.00% | 0.00% | 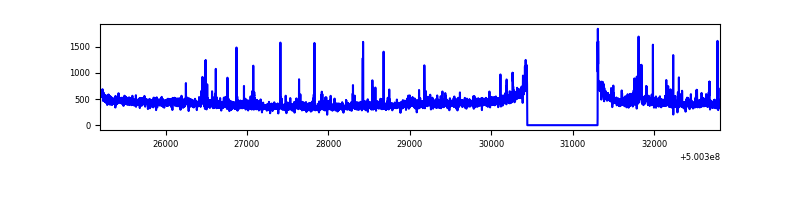 |
| B | 7611 | 6747 | 449 | 449 | 5.90% | 6.65% | 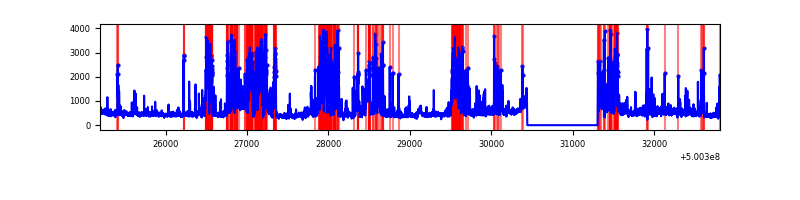 |
| C | 7611 | 6747 | 404 | 404 | 5.31% | 5.99% | 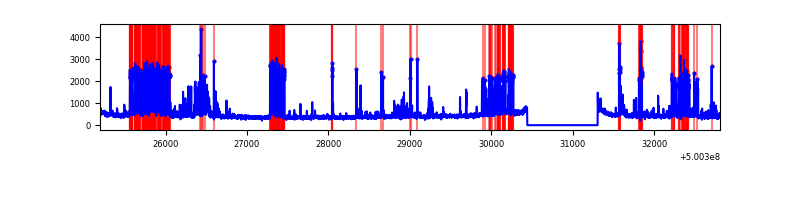 |
| D | 7611 | 6747 | 87 | 87 | 1.14% | 1.29% | 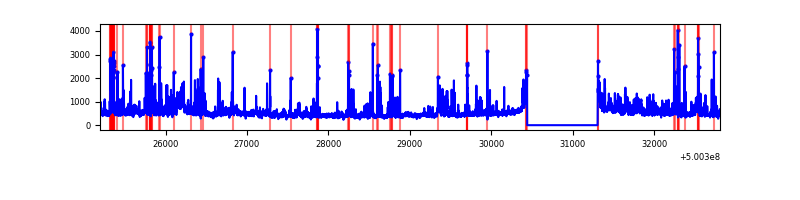 |
Top three noisy pixels from each quadrant. If the there are fewer than three noisy pixels in the level2.evt file, extra rows are filled as -1
| Pixel properties | Quadrant properties | ||||||
|---|---|---|---|---|---|---|---|
| Quadrant | DetID | PixID | Counts | Sigma | Mean | Median | Sigma |
| A | 4 | 206 | 53941 | 307.51 | 700 | 684 | 173.2 |
| A | 4 | 3 | 44224 | 251.4 | 700 | 684 | 173.2 |
| A | 4 | 249 | 28755 | 162.08 | 700 | 684 | 173.2 |
| B | 0 | 173 | 815851 | 5622.29 | 676 | 652 | 145.0 |
| B | 5 | 185 | 767490 | 5288.76 | 676 | 652 | 145.0 |
| B | 2 | 249 | 442928 | 3050.31 | 676 | 652 | 145.0 |
| C | 9 | 38 | 1124909 | 6049.26 | 671 | 662 | 185.8 |
| C | 6 | 223 | 191870 | 1028.84 | 671 | 662 | 185.8 |
| C | 12 | 252 | 109299 | 584.55 | 671 | 662 | 185.8 |
| D | 2 | 62 | 271217 | 1385.27 | 672 | 641 | 195.3 |
| D | 3 | 12 | 190548 | 972.27 | 672 | 641 | 195.3 |
| D | 11 | 129 | 185558 | 946.72 | 672 | 641 | 195.3 |
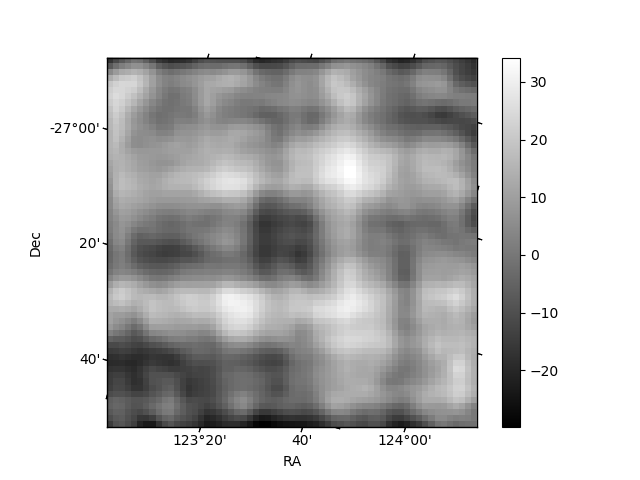
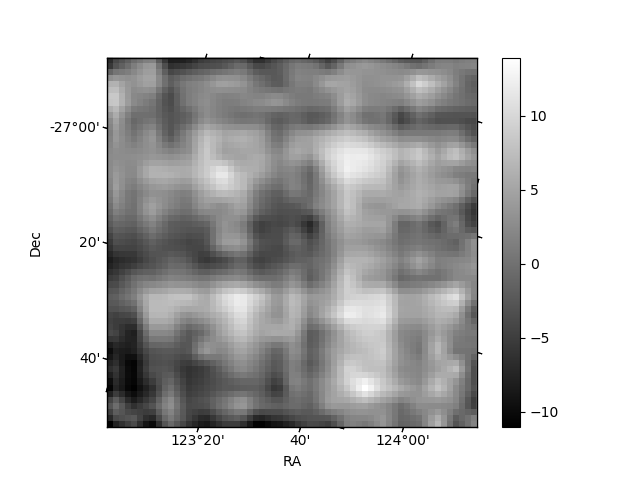
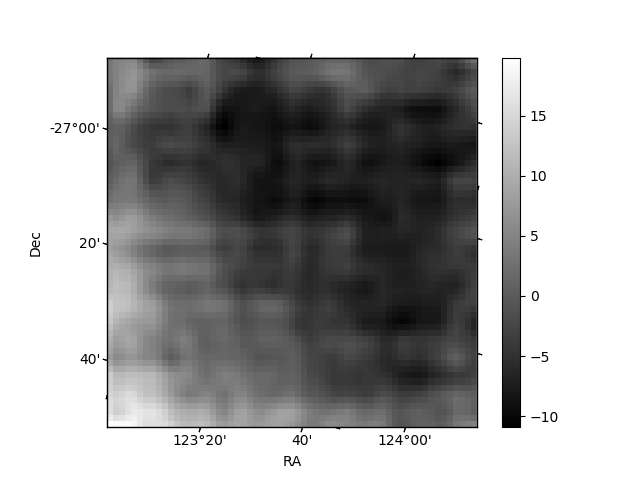
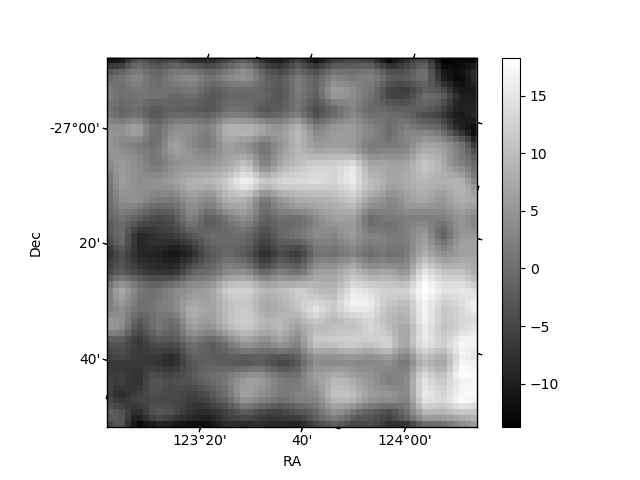
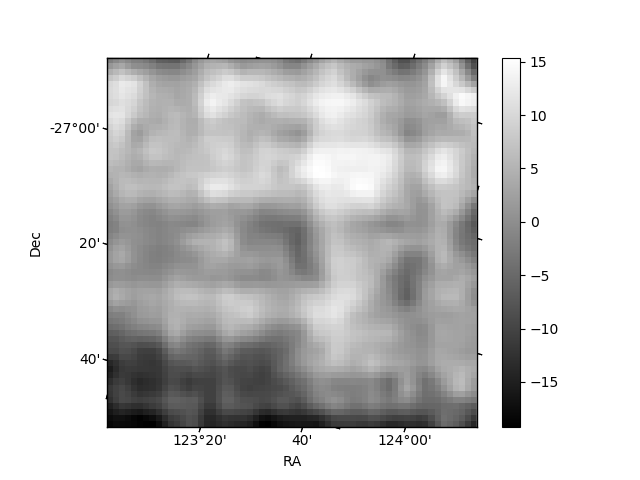
Histogram calculated using DETX and DETY for each event in the final _common_clean file
| Quadrant A | 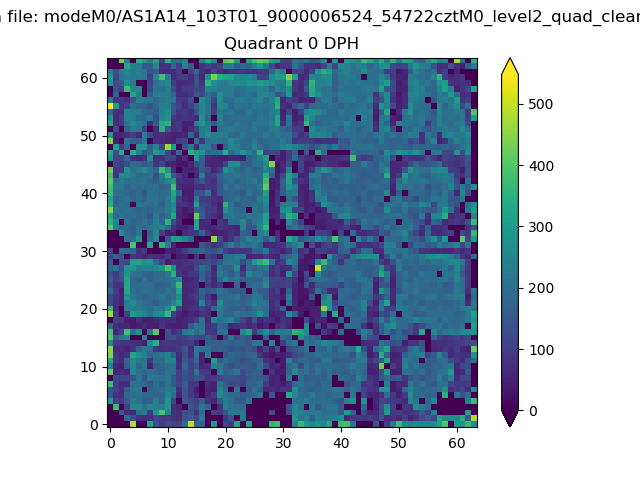 |
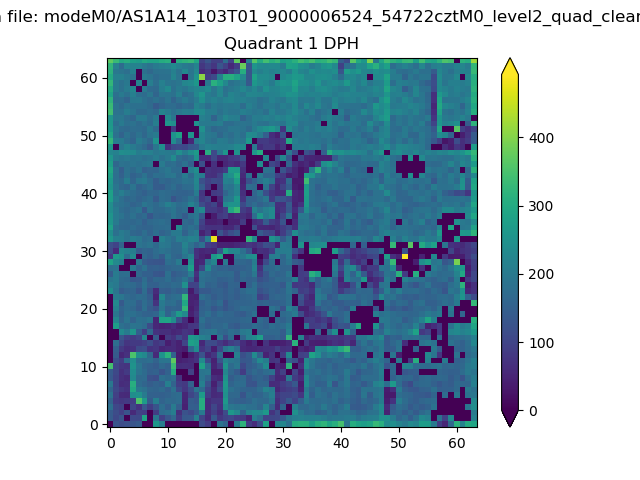 |
Quadrant B |
|---|---|---|---|
| Quadrant D | 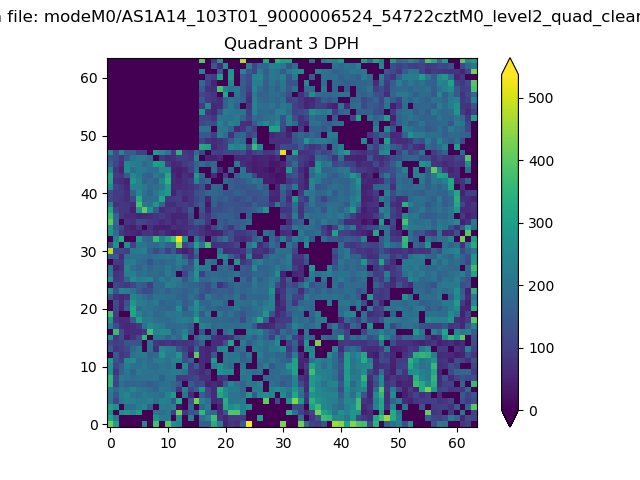 |
 |
Quadrant C |
| Plot type | Count rate plots | Images |
|---|---|---|
| Comparison with Poisson distribution Blue bars denote a histogram of data divided into 1 sec bins. Red curve is a Poisson curve with rate = median count rate of data. |
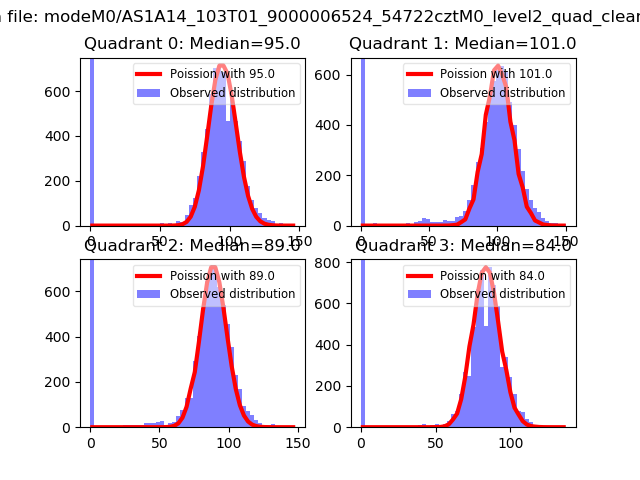 |
 |
| Quadrant-wise count rates Data is divided into 100 sec bins |
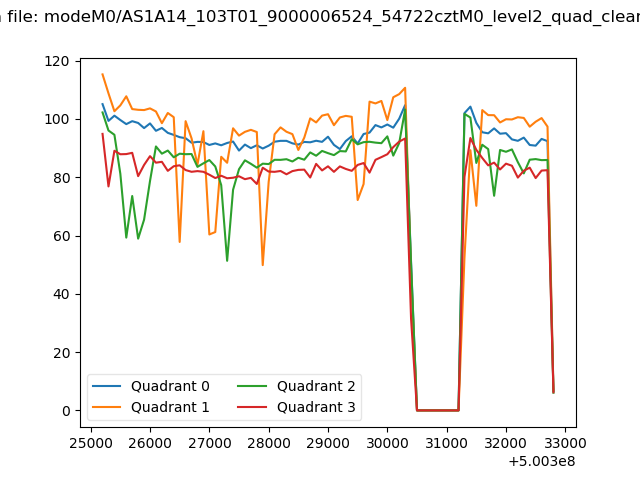 |
|
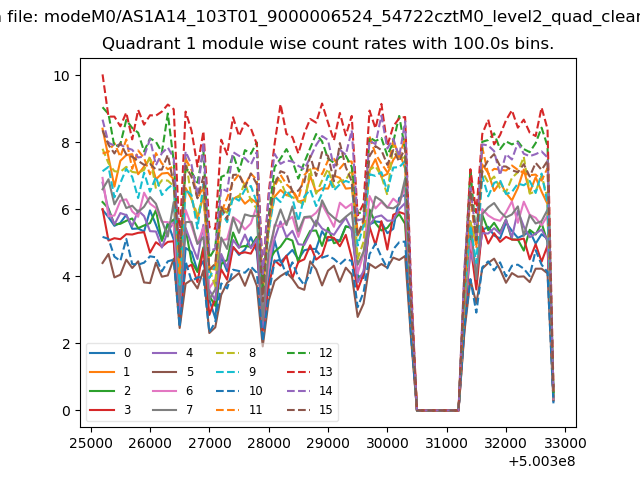
| Module-wise count rates for Quadrant A Data is divided into 100 sec bins |
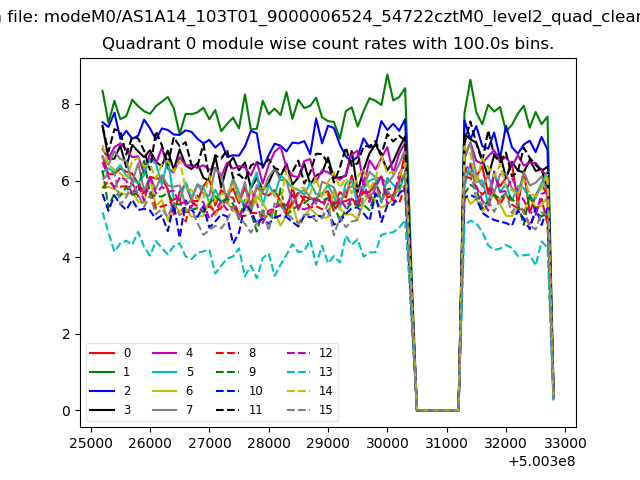 |
 |
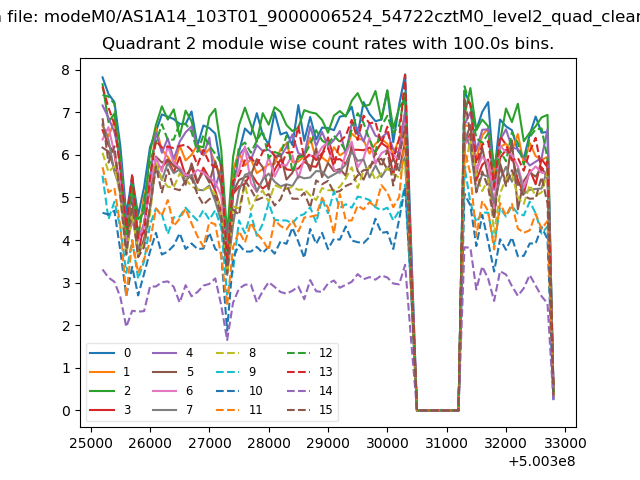
| Module-wise count rates for Quadrant B Data is divided into 100 sec bins |
 |
 |
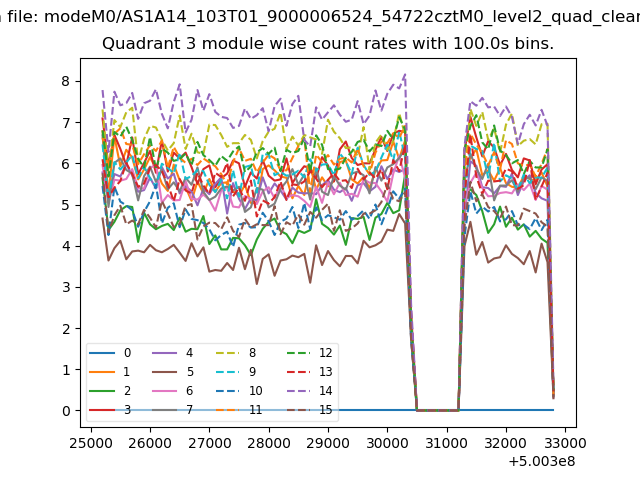
| Module-wise count rates for Quadrant C Data is divided into 100 sec bins |
 |
 |
| Module-wise count rates for Quadrant D Data is divided into 100 sec bins |
 |
 |
| Parameter | Plot |
|---|---|
| CZT HV Monitor | 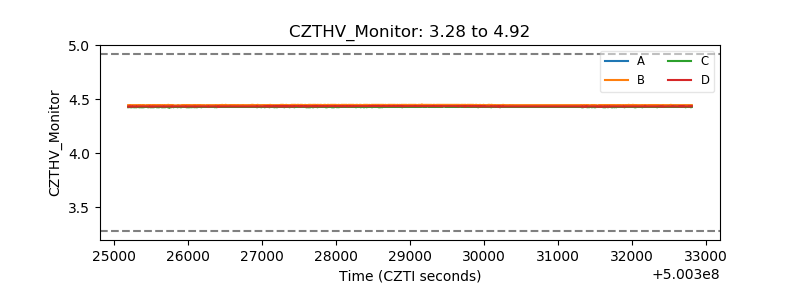 |
| D_VDD | 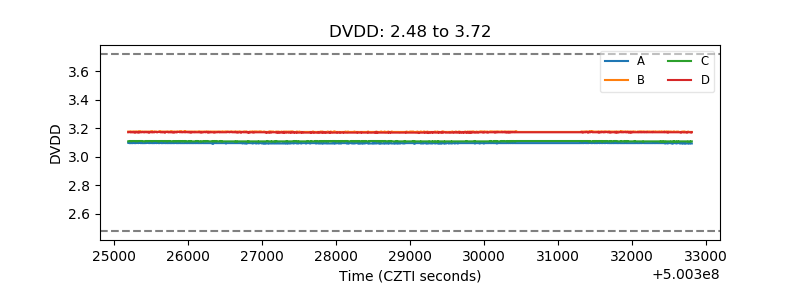 |
| Temperature 1 | 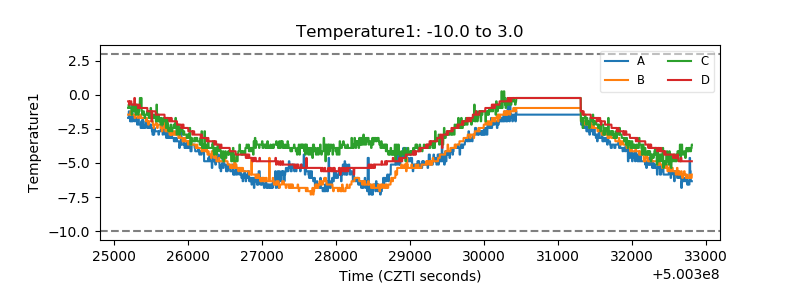 |
| Veto HV Monitor | 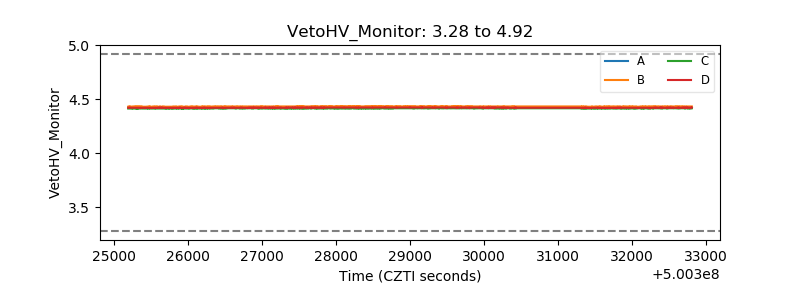 |
| Veto LLD | 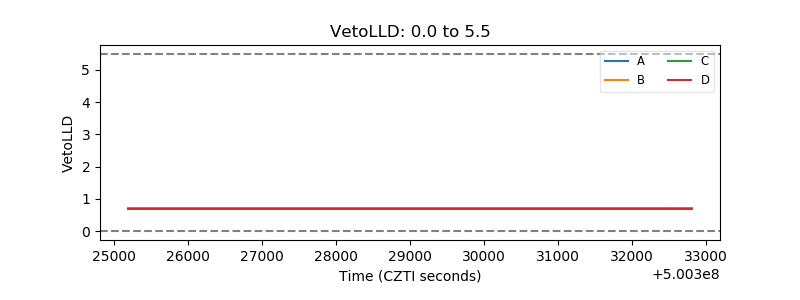 |
| Alpha Counter | 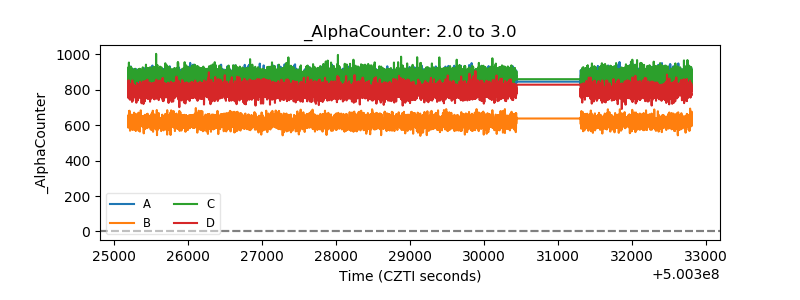 |
| _CPM_Rate | 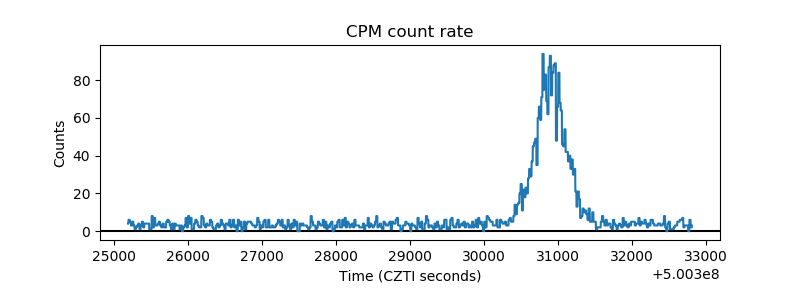 |
| CZT Counter | 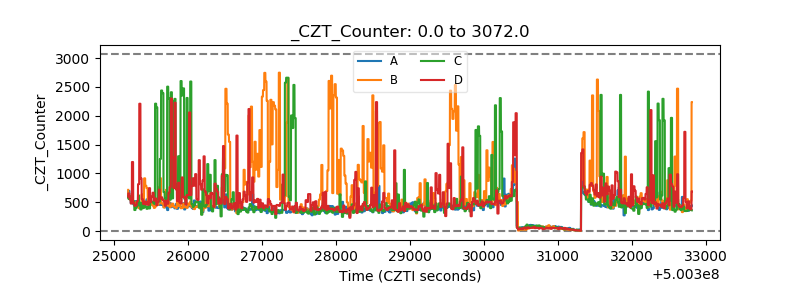 |
| +2.5 Volts monitor |  |
| +5 Volts monitor |  |
| _ROLL_ROT | 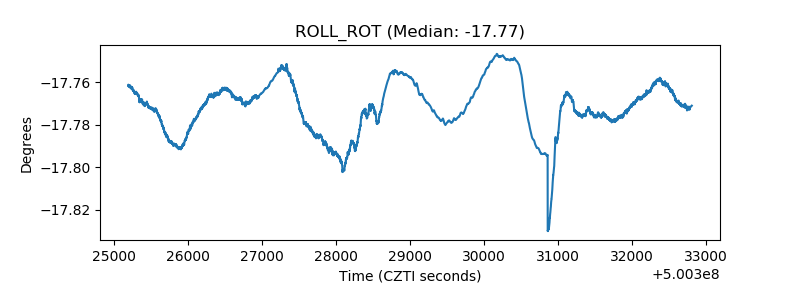 |
| _Roll_DEC | 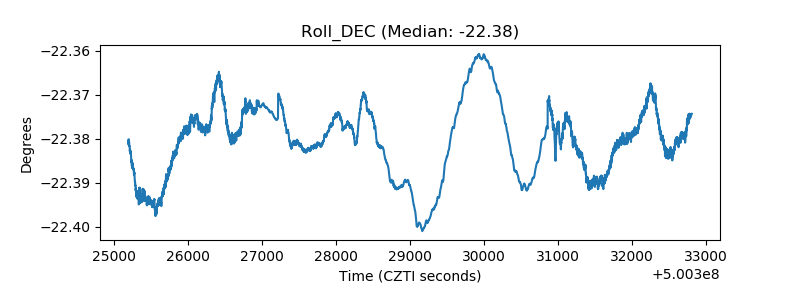 |
| _Roll_RA | 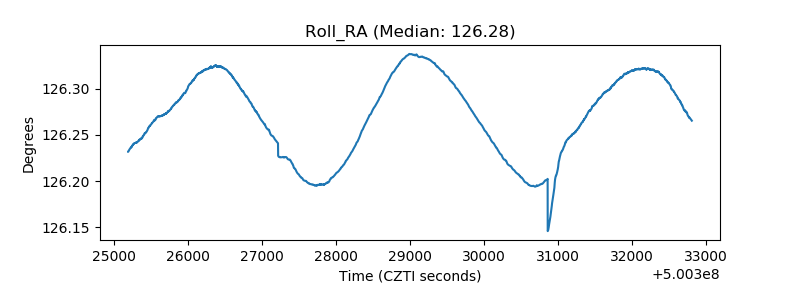 |
| Veto Counter | 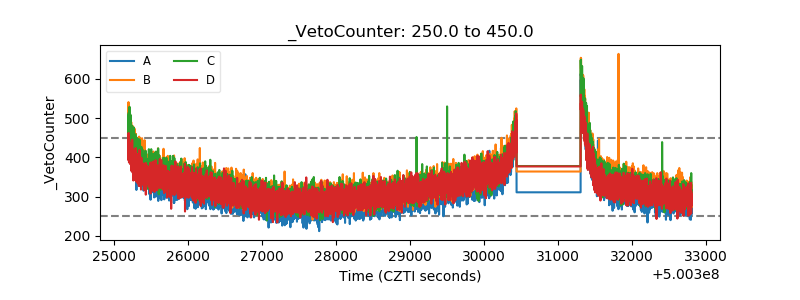 |