| Param | Original file | Final file |
|---|---|---|
| Filename | modeM0/AS1A14_103T01_9000006524_54724cztM0_level2.fits | modeM0/AS1A14_103T01_9000006524_54724cztM0_level2_quad_clean.evt |
| Size (bytes) | 553,942,080 | 117,463,680 |
| Size | 528.3 MB | 112.0 MB |
| Events in quadrant A | 3,784,309 | 771,536 |
| Events in quadrant B | 6,243,850 | 798,328 |
| Events in quadrant C | 5,248,741 | 721,279 |
| Events in quadrant D | 4,579,317 | 684,219 |
| Mode SS | |||
|---|---|---|---|
| Quadrant | BADHDUFLAG | Total packets | Discarded packets |
| A | 0 | 172 | 0 |
| B | 0 | 172 | 0 |
| C | 0 | 172 | 0 |
| D | 0 | 172 | 0 |
| Mode M0 | |||
|---|---|---|---|
| Quadrant | BADHDUFLAG | Total packets | Discarded packets |
| A | 0 | 17653 | 3 |
| B | 0 | 24474 | 3 |
| C | 0 | 21775 | 3 |
| D | 0 | 19845 | 3 |
| Mode M9 | |||
|---|---|---|---|
| Quadrant | BADHDUFLAG | Total packets | Discarded packets |
| A | 0 | 1 | 0 |
| B | 0 | 1 | 0 |
| C | 0 | 1 | 0 |
| D | 0 | 1 | 0 |
| Quadrant | Total seconds | Saturated seconds | Saturation percentage |
|---|---|---|---|
| A | 8357 | 56 | 0.670097% |
| B | 8358 | 542 | 6.484805% |
| C | 8358 | 284 | 3.397942% |
| D | 8358 | 151 | 1.806652% |
Noise dominated data is calculated using 1-second bins in cleaned event files. If a bin has >2000 counts, and if more than 50% of those come from <1% of pixels, then it is considered to be noise-dominated and hence unusable.
| Quadrant | # 1 sec bins | Bins with >0 counts | Bins with >2000 counts | High rate bins dominated by noise | Noise dominated (total time) | Noise dominated (detector-on time) | Marked lightcurve |
|---|---|---|---|---|---|---|---|
| A | 8582 | 8361 | 9 | 9 | 0.10% | 0.11% | 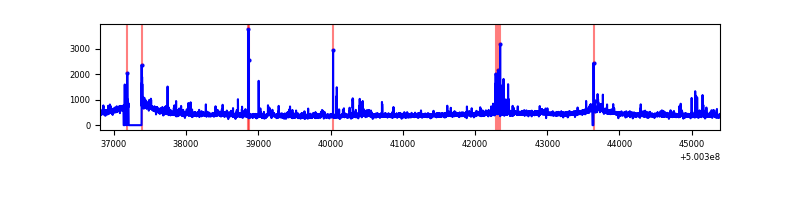 |
| B | 8583 | 8362 | 416 | 416 | 4.85% | 4.97% | 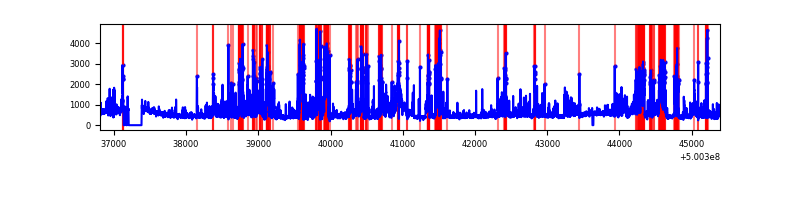 |
| C | 8583 | 8362 | 331 | 331 | 3.86% | 3.96% | 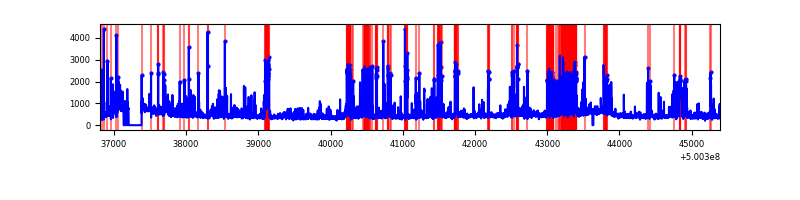 |
| D | 8583 | 8362 | 118 | 118 | 1.37% | 1.41% | 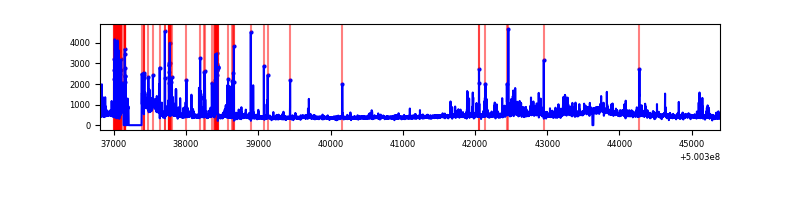 |
Top three noisy pixels from each quadrant. If the there are fewer than three noisy pixels in the level2.evt file, extra rows are filled as -1
| Pixel properties | Quadrant properties | ||||||
|---|---|---|---|---|---|---|---|
| Quadrant | DetID | PixID | Counts | Sigma | Mean | Median | Sigma |
| A | 7 | 190 | 88986 | 404.1 | 878 | 856 | 218.1 |
| A | 4 | 206 | 78422 | 355.66 | 878 | 856 | 218.1 |
| A | 4 | 3 | 42826 | 192.44 | 878 | 856 | 218.1 |
| B | 2 | 249 | 1606747 | 8738.18 | 856 | 826 | 183.8 |
| B | 0 | 173 | 417081 | 2264.94 | 856 | 826 | 183.8 |
| B | 5 | 185 | 377257 | 2048.25 | 856 | 826 | 183.8 |
| C | 9 | 38 | 953255 | 4064.27 | 848 | 840 | 234.3 |
| C | 13 | 3 | 318596 | 1355.97 | 848 | 840 | 234.3 |
| C | 6 | 223 | 218438 | 928.56 | 848 | 840 | 234.3 |
| D | 2 | 172 | 286156 | 1180.38 | 841 | 801 | 241.7 |
| D | 2 | 62 | 220371 | 908.26 | 841 | 801 | 241.7 |
| D | 8 | 240 | 205752 | 847.79 | 841 | 801 | 241.7 |
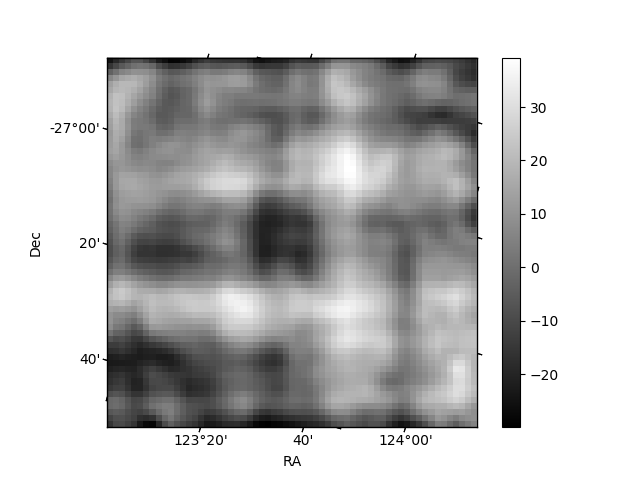
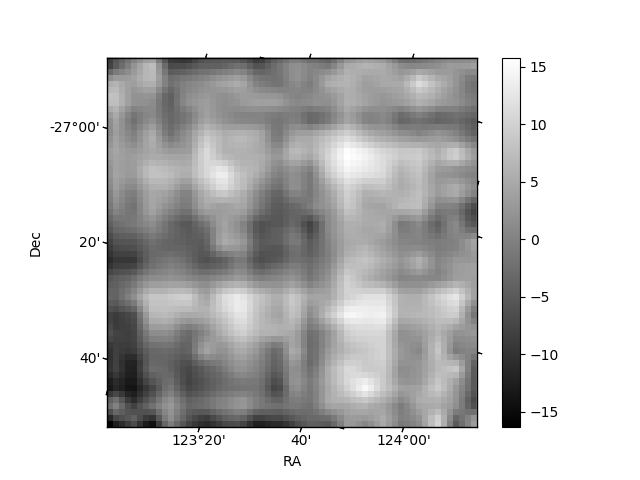
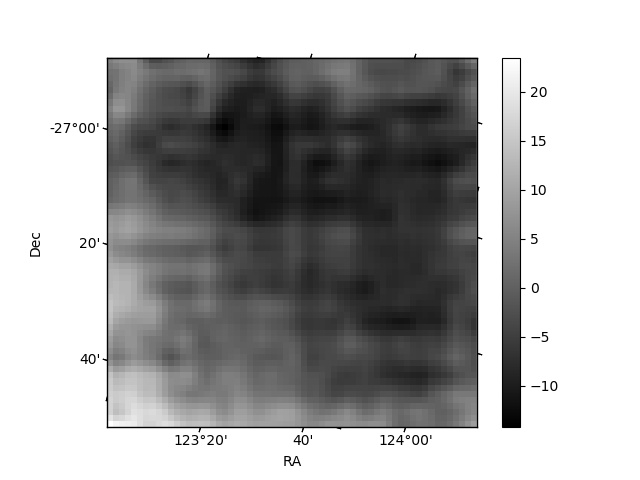
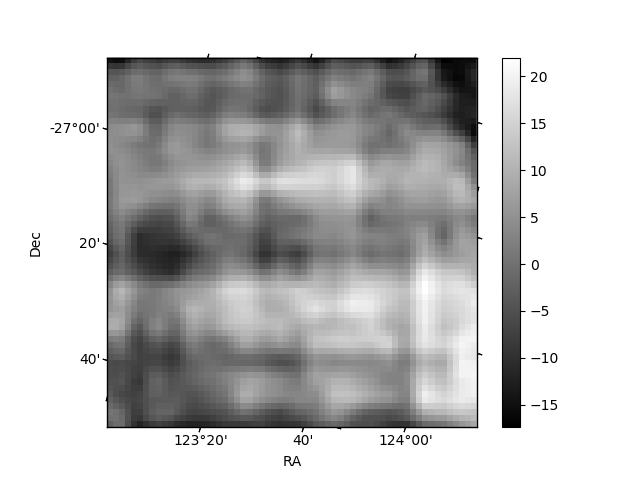
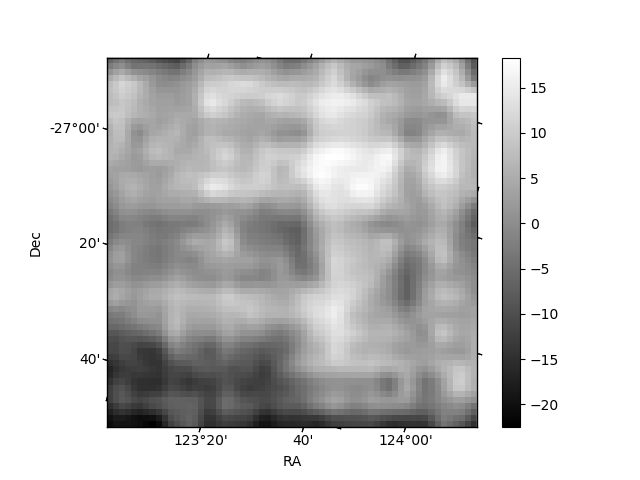
Histogram calculated using DETX and DETY for each event in the final _common_clean file
| Quadrant A | 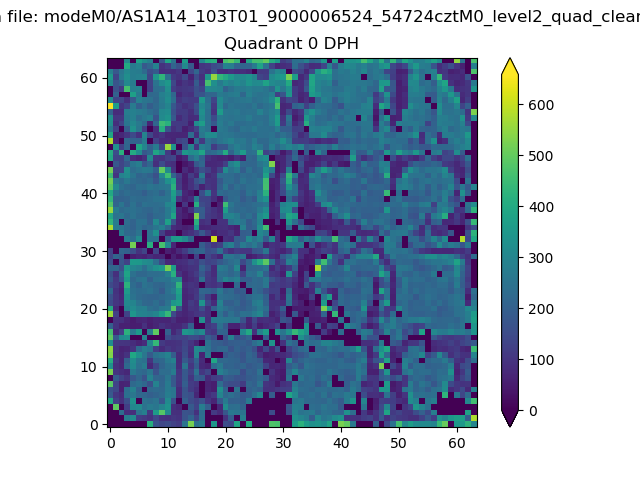 |
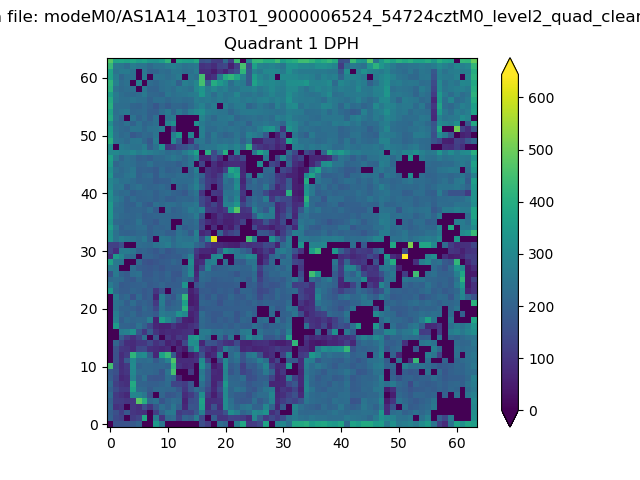 |
Quadrant B |
|---|---|---|---|
| Quadrant D | 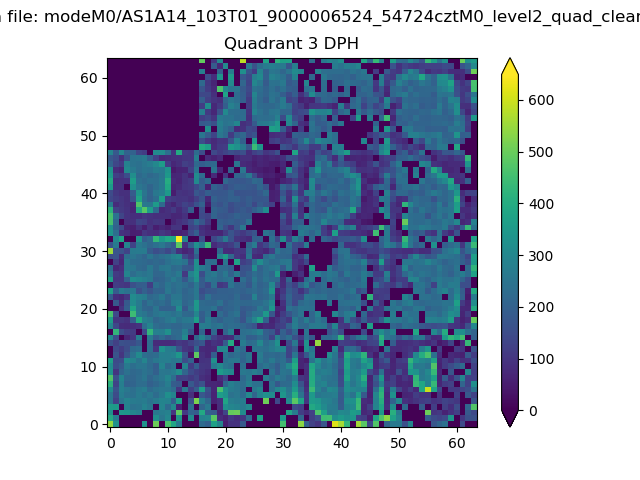 |
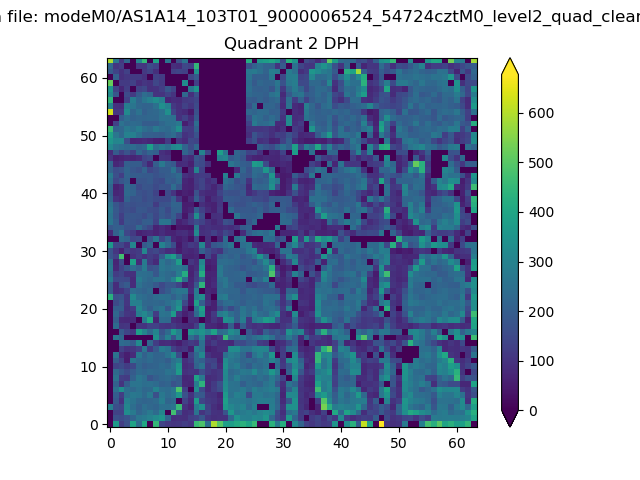 |
Quadrant C |
| Plot type | Count rate plots | Images |
|---|---|---|
| Comparison with Poisson distribution Blue bars denote a histogram of data divided into 1 sec bins. Red curve is a Poisson curve with rate = median count rate of data. |
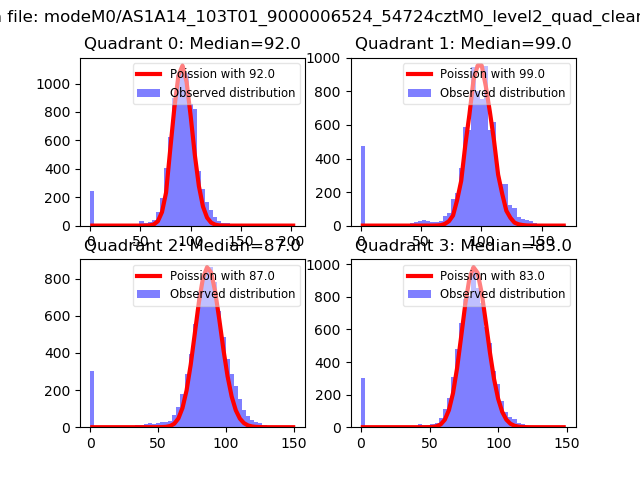 |
 |
| Quadrant-wise count rates Data is divided into 100 sec bins |
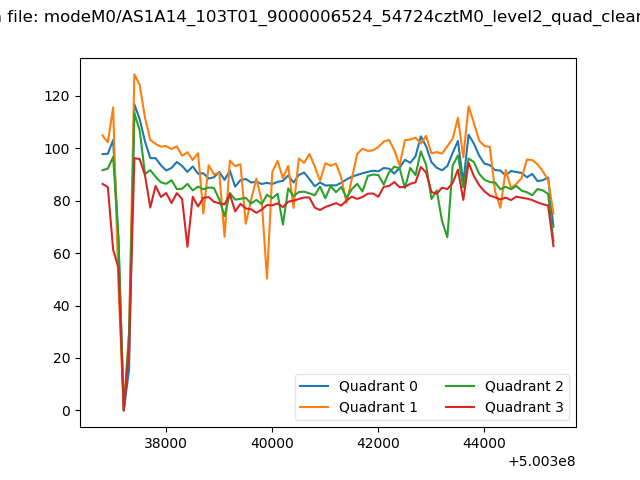 |
|
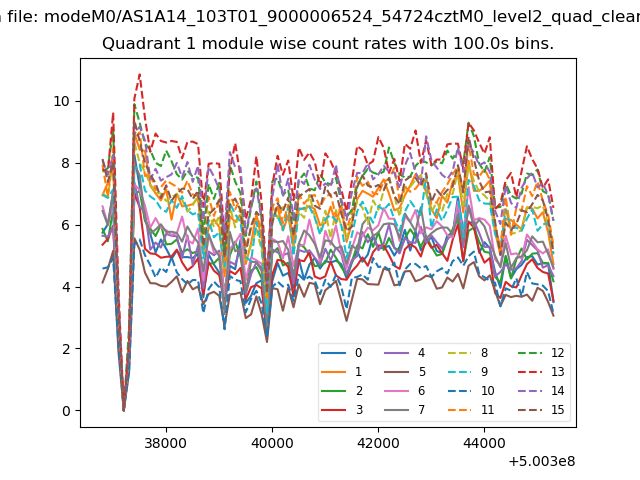
| Module-wise count rates for Quadrant A Data is divided into 100 sec bins |
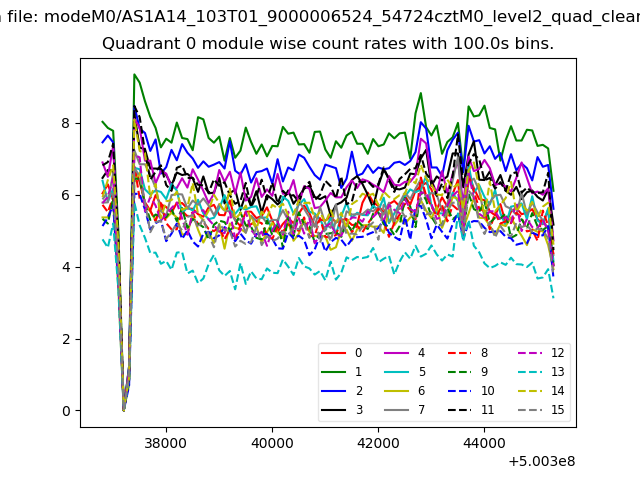 |
 |
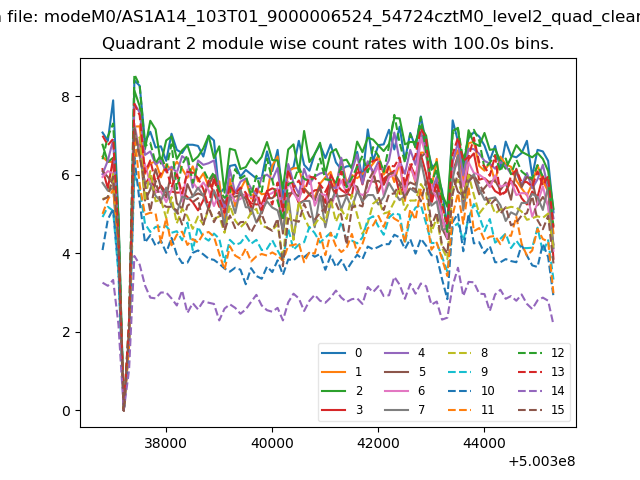
| Module-wise count rates for Quadrant B Data is divided into 100 sec bins |
 |
 |
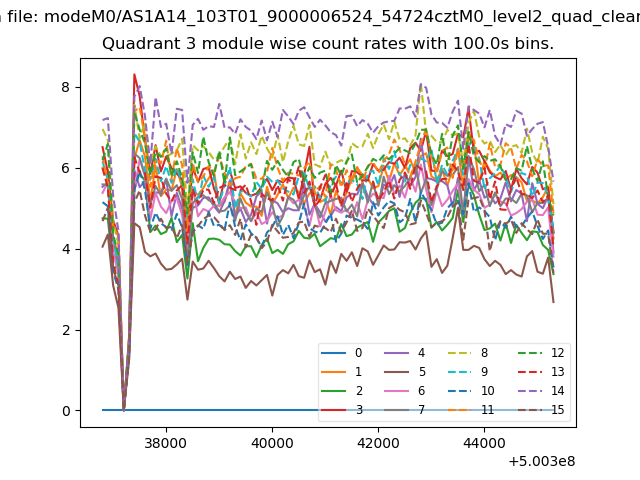
| Module-wise count rates for Quadrant C Data is divided into 100 sec bins |
 |
 |
| Module-wise count rates for Quadrant D Data is divided into 100 sec bins |
 |
 |
| Parameter | Plot |
|---|---|
| CZT HV Monitor | 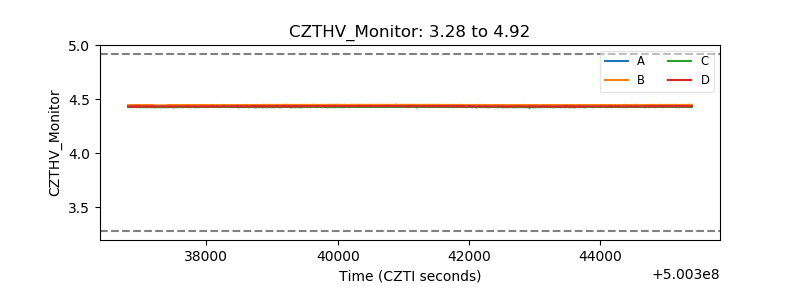 |
| D_VDD | 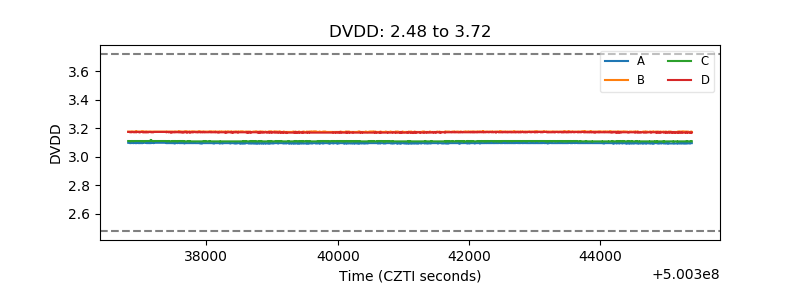 |
| Temperature 1 | 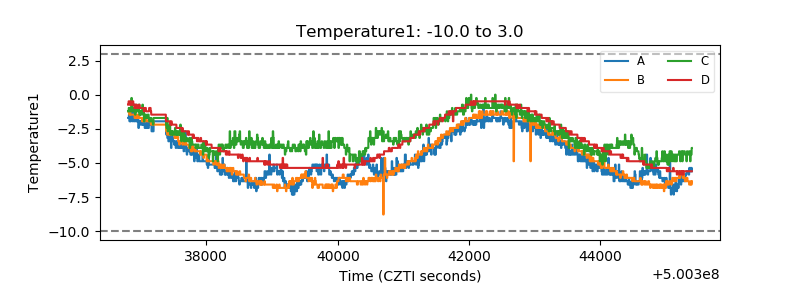 |
| Veto HV Monitor | 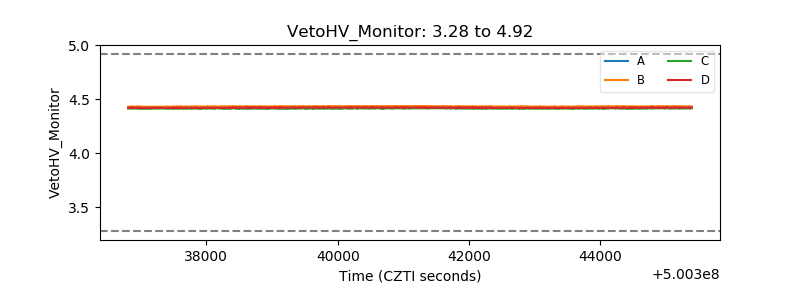 |
| Veto LLD | 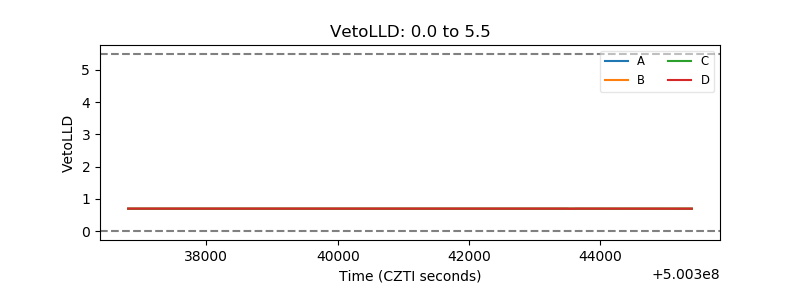 |
| Alpha Counter | 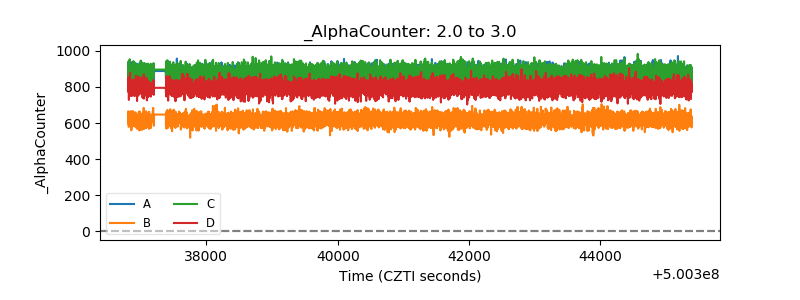 |
| _CPM_Rate | 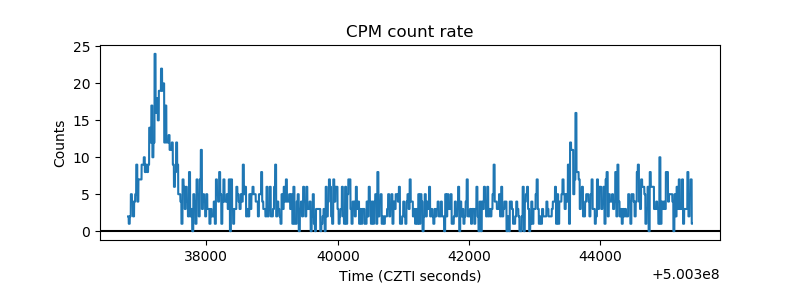 |
| CZT Counter | 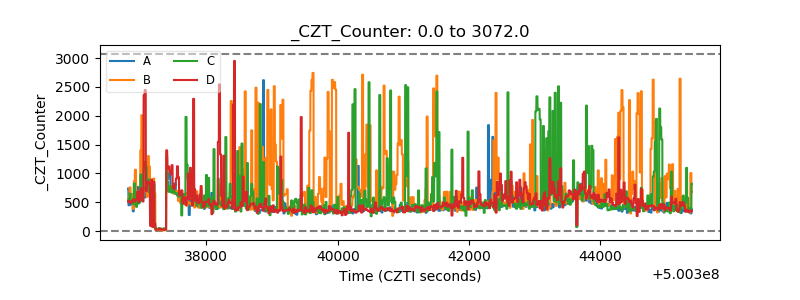 |
| +2.5 Volts monitor |  |
| +5 Volts monitor |  |
| _ROLL_ROT | 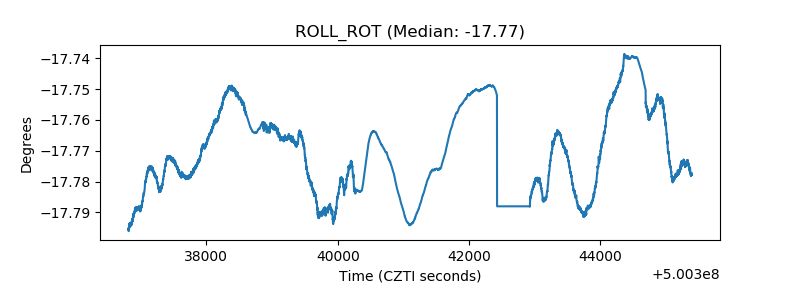 |
| _Roll_DEC | 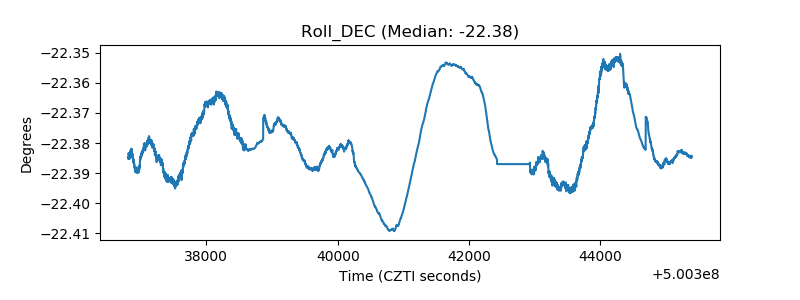 |
| _Roll_RA | 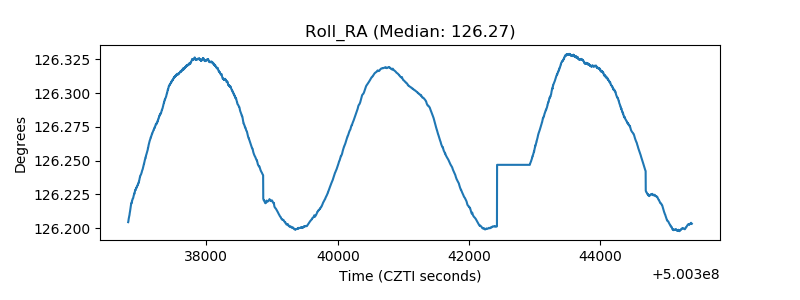 |
| Veto Counter | 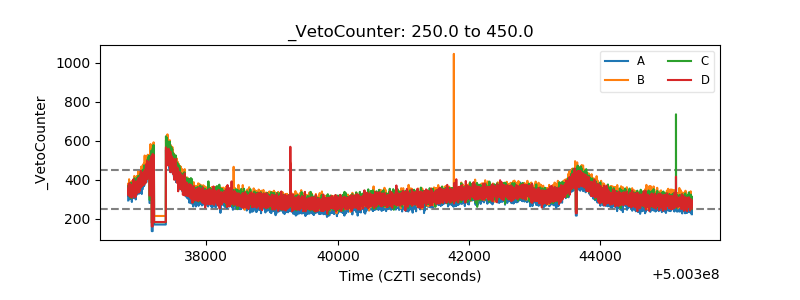 |