| Param | Original file | Final file |
|---|---|---|
| Filename | modeM0/AS1A14_103T01_9000006524_54729cztM0_level2.fits | modeM0/AS1A14_103T01_9000006524_54729cztM0_level2_quad_clean.evt |
| Size (bytes) | 688,861,440 | 133,277,760 |
| Size | 656.9 MB | 127.1 MB |
| Events in quadrant A | 4,530,584 | 883,885 |
| Events in quadrant B | 8,837,411 | 865,803 |
| Events in quadrant C | 6,764,661 | 809,315 |
| Events in quadrant D | 4,608,210 | 798,440 |
| Mode SS | |||
|---|---|---|---|
| Quadrant | BADHDUFLAG | Total packets | Discarded packets |
| A | 0 | 196 | 0 |
| B | 0 | 196 | 0 |
| C | 0 | 196 | 0 |
| D | 0 | 196 | 0 |
| Mode M0 | |||
|---|---|---|---|
| Quadrant | BADHDUFLAG | Total packets | Discarded packets |
| A | 0 | 20983 | 1 |
| B | 0 | 32985 | 1 |
| C | 0 | 27407 | 1 |
| D | 0 | 21306 | 1 |
| Quadrant | Total seconds | Saturated seconds | Saturation percentage |
|---|---|---|---|
| A | 9779 | 68 | 0.695368% |
| B | 9779 | 1176 | 12.025770% |
| C | 9779 | 585 | 5.982207% |
| D | 9780 | 28 | 0.286299% |
Noise dominated data is calculated using 1-second bins in cleaned event files. If a bin has >2000 counts, and if more than 50% of those come from <1% of pixels, then it is considered to be noise-dominated and hence unusable.
| Quadrant | # 1 sec bins | Bins with >0 counts | Bins with >2000 counts | High rate bins dominated by noise | Noise dominated (total time) | Noise dominated (detector-on time) | Marked lightcurve |
|---|---|---|---|---|---|---|---|
| A | 9794 | 9780 | 55 | 55 | 0.56% | 0.56% | 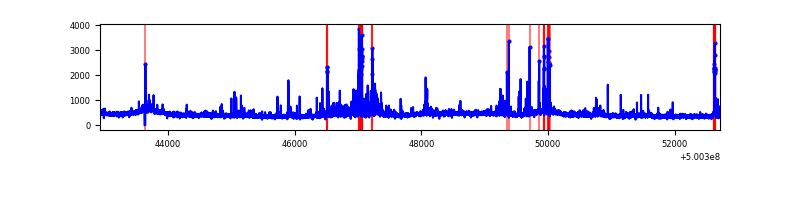 |
| B | 9794 | 9780 | 1105 | 1105 | 11.28% | 11.30% | 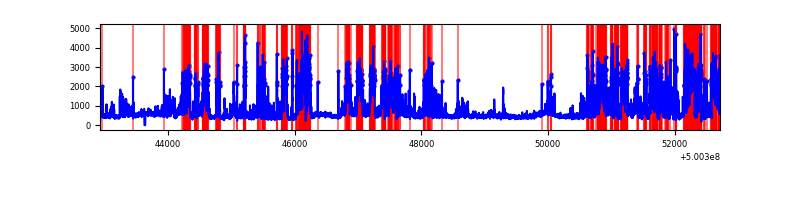 |
| C | 9794 | 9780 | 629 | 629 | 6.42% | 6.43% | 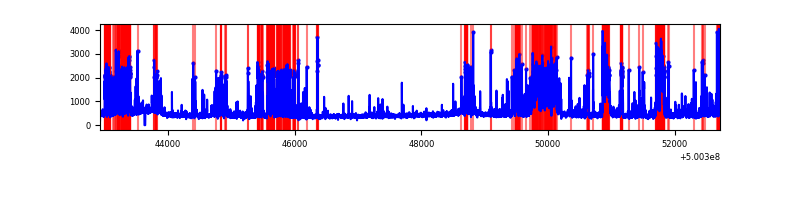 |
| D | 9795 | 9781 | 25 | 25 | 0.26% | 0.26% | 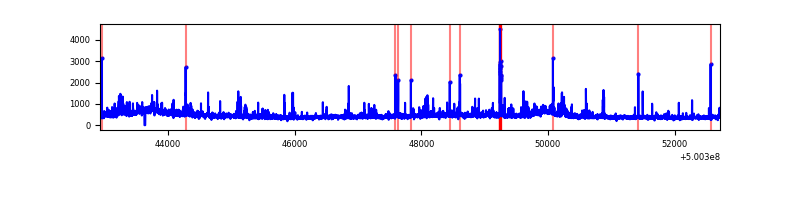 |
Top three noisy pixels from each quadrant. If the there are fewer than three noisy pixels in the level2.evt file, extra rows are filled as -1
| Pixel properties | Quadrant properties | ||||||
|---|---|---|---|---|---|---|---|
| Quadrant | DetID | PixID | Counts | Sigma | Mean | Median | Sigma |
| A | 7 | 190 | 297621 | 1207.73 | 987 | 961 | 245.6 |
| A | 4 | 236 | 176255 | 713.64 | 987 | 961 | 245.6 |
| A | 0 | 8 | 46277 | 184.49 | 987 | 961 | 245.6 |
| B | 2 | 249 | 3685046 | 18023.85 | 946 | 912 | 204.4 |
| B | 0 | 173 | 771287 | 3768.9 | 946 | 912 | 204.4 |
| B | 5 | 185 | 292668 | 1427.35 | 946 | 912 | 204.4 |
| C | 9 | 38 | 1478710 | 5613.9 | 951 | 946 | 263.2 |
| C | 15 | 219 | 655475 | 2486.5 | 951 | 946 | 263.2 |
| C | 14 | 254 | 275715 | 1043.82 | 951 | 946 | 263.2 |
| D | 2 | 62 | 235467 | 863.13 | 958 | 915 | 271.7 |
| D | 5 | 173 | 98307 | 358.39 | 958 | 915 | 271.7 |
| D | 11 | 129 | 93341 | 340.12 | 958 | 915 | 271.7 |
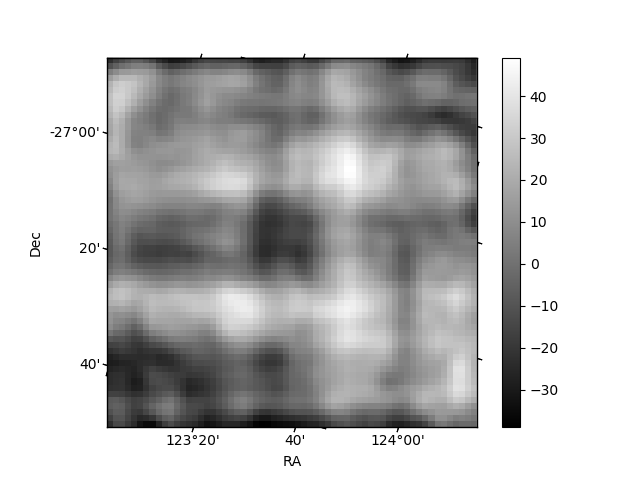
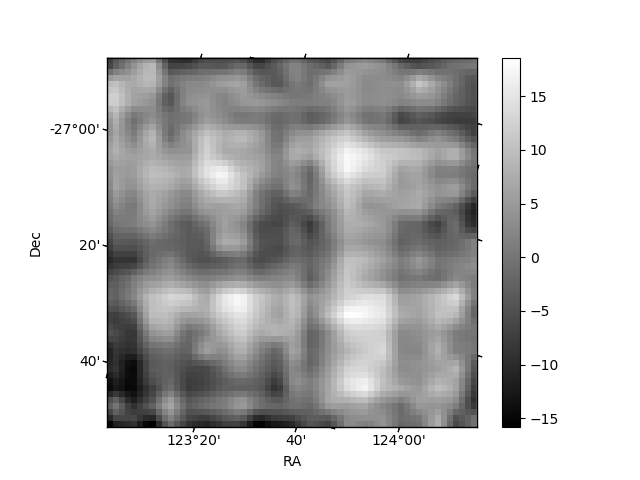
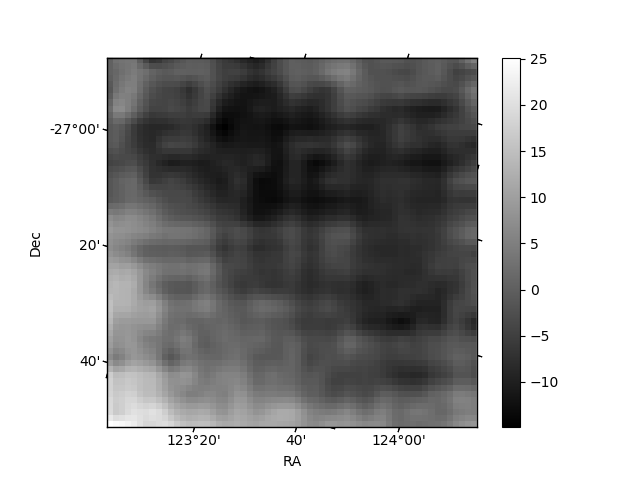
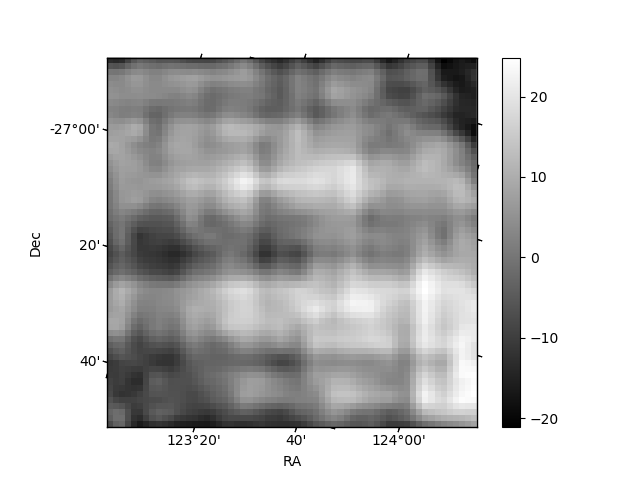
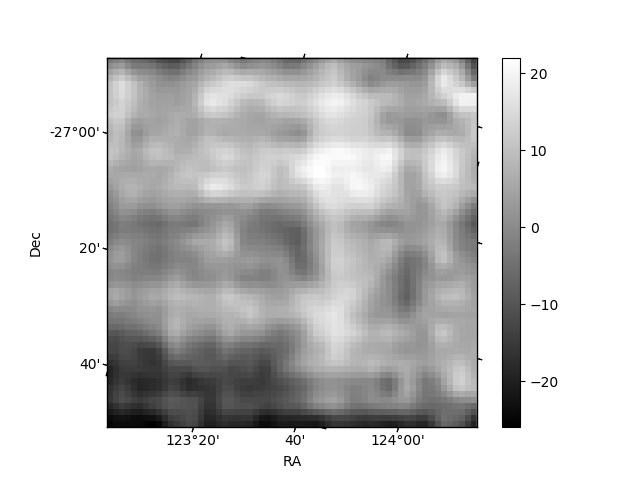
Histogram calculated using DETX and DETY for each event in the final _common_clean file
| Quadrant A | 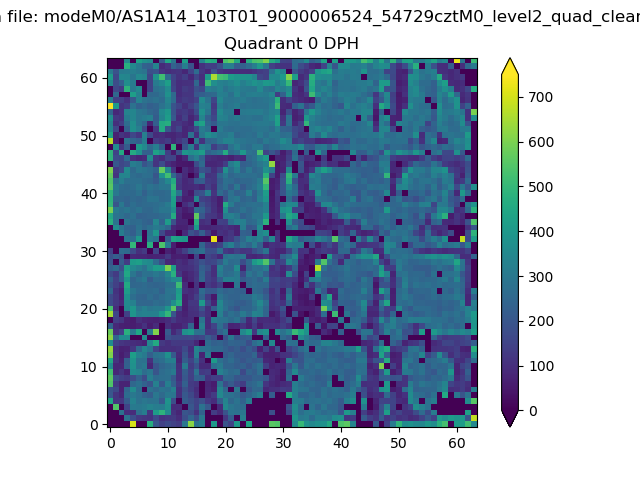 |
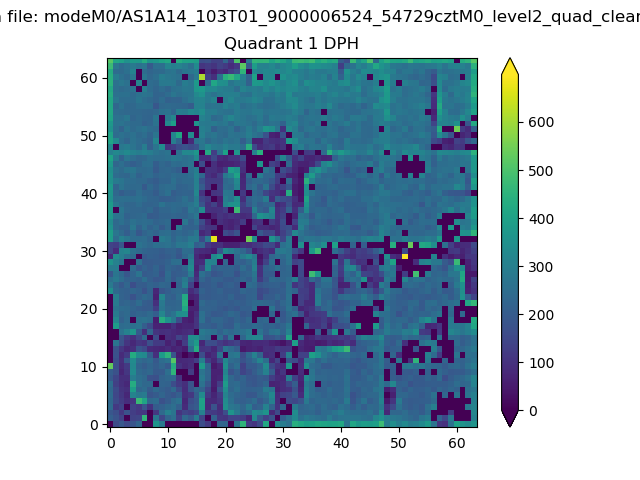 |
Quadrant B |
|---|---|---|---|
| Quadrant D | 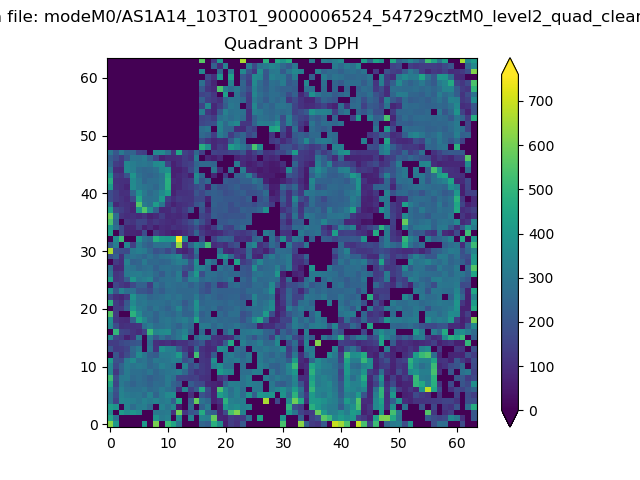 |
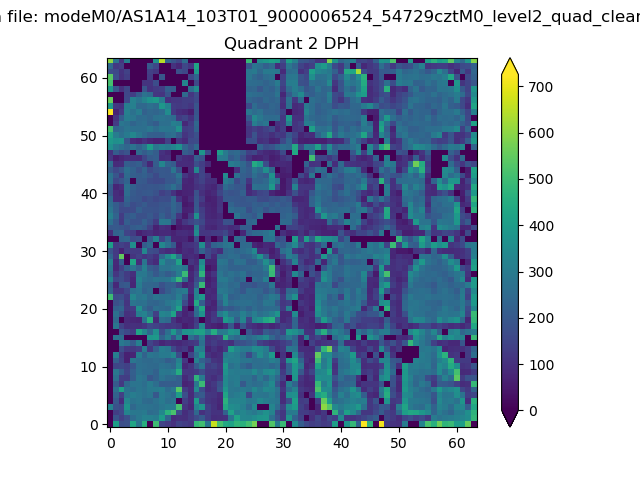 |
Quadrant C |
| Plot type | Count rate plots | Images |
|---|---|---|
| Comparison with Poisson distribution Blue bars denote a histogram of data divided into 1 sec bins. Red curve is a Poisson curve with rate = median count rate of data. |
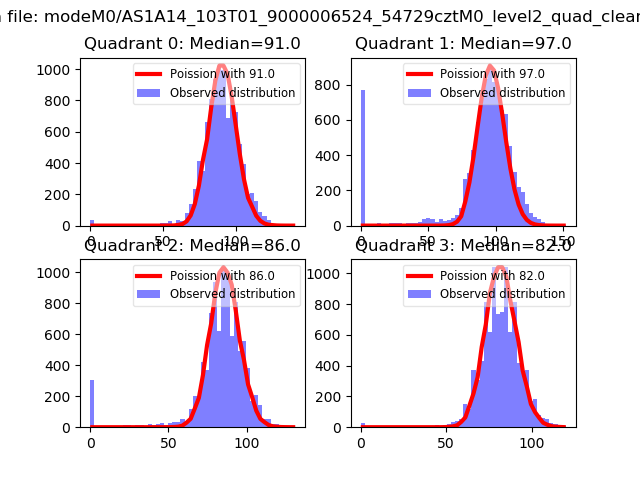 |
 |
| Quadrant-wise count rates Data is divided into 100 sec bins |
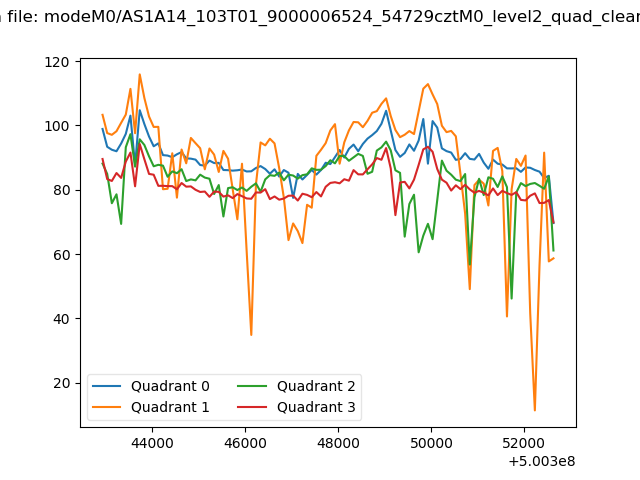 |
|
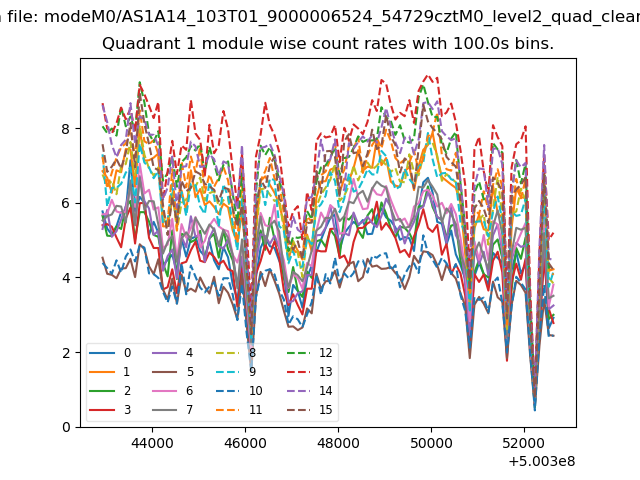
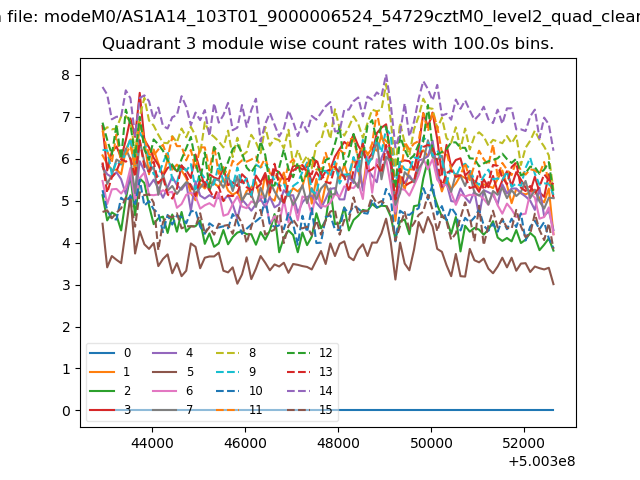
| Module-wise count rates for Quadrant A Data is divided into 100 sec bins |
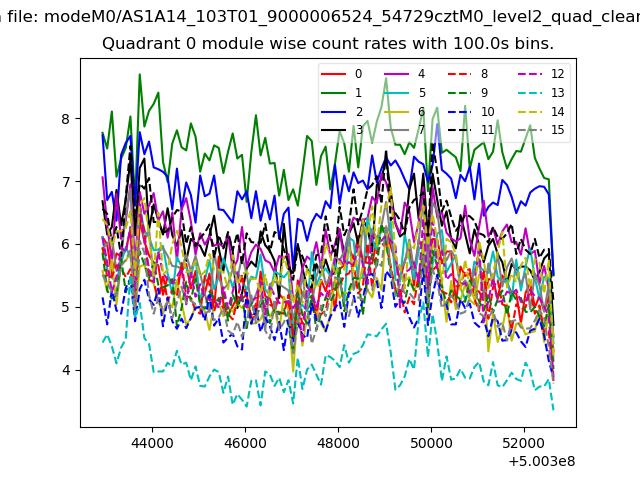 |
 |
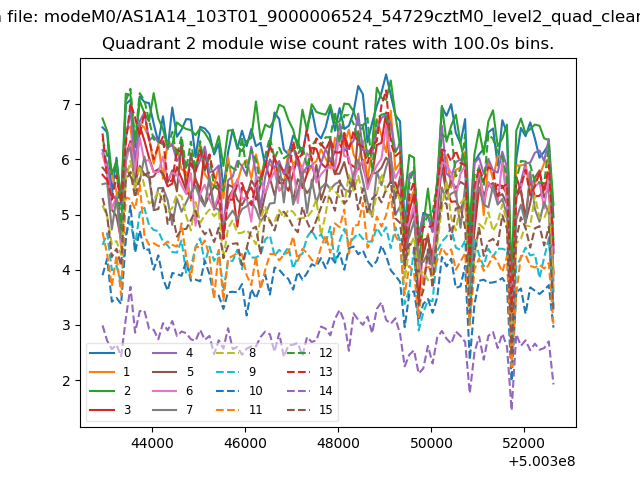
| Module-wise count rates for Quadrant B Data is divided into 100 sec bins |
 |
 |
| Module-wise count rates for Quadrant C Data is divided into 100 sec bins |
 |
 |
| Module-wise count rates for Quadrant D Data is divided into 100 sec bins |
 |
 |
| Parameter | Plot |
|---|---|
| CZT HV Monitor | 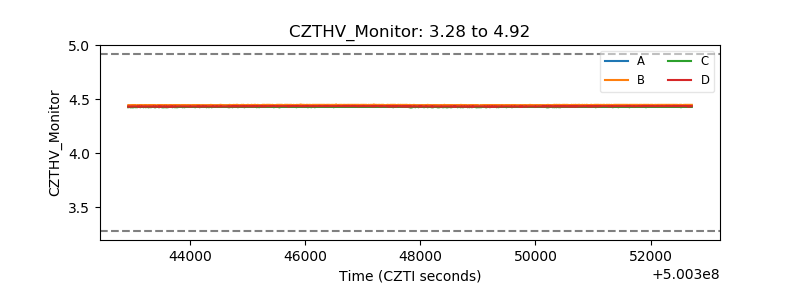 |
| D_VDD | 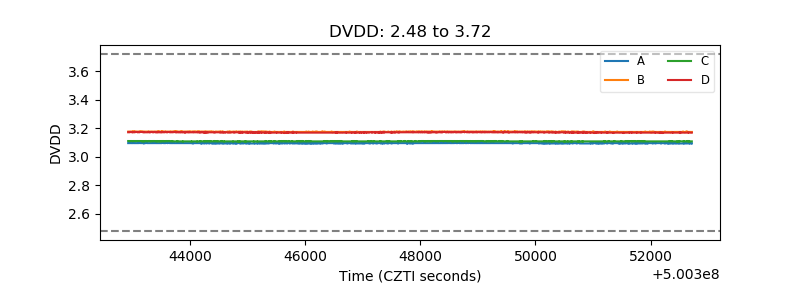 |
| Temperature 1 | 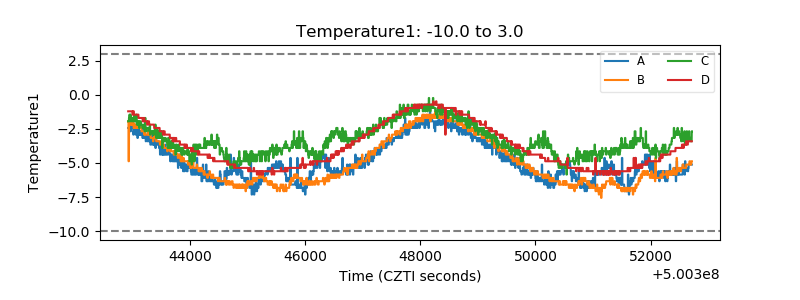 |
| Veto HV Monitor | 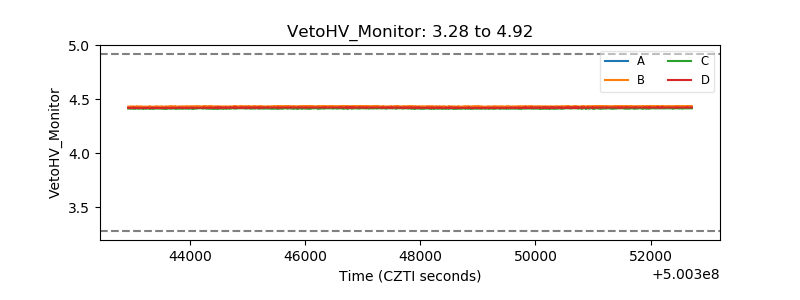 |
| Veto LLD | 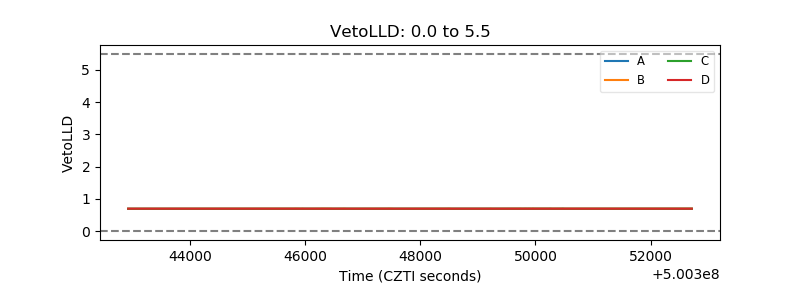 |
| Alpha Counter | 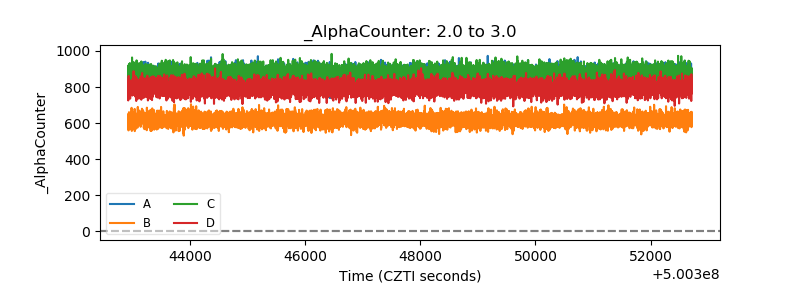 |
| _CPM_Rate | 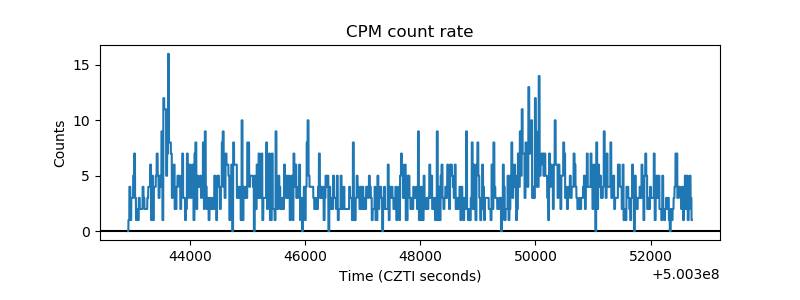 |
| CZT Counter | 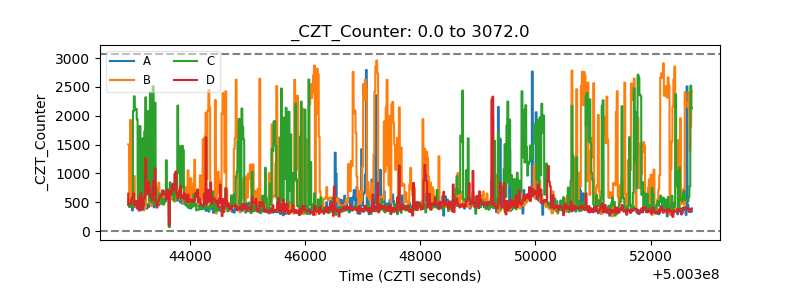 |
| +2.5 Volts monitor | 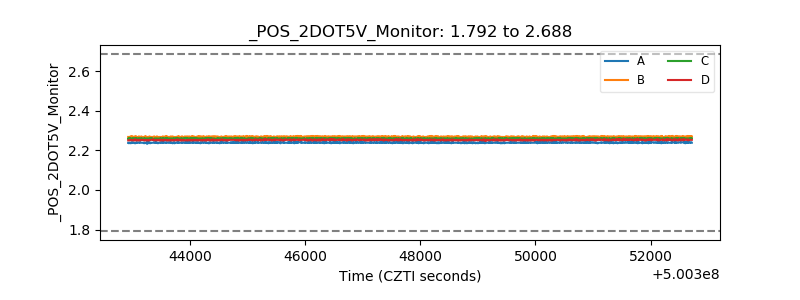 |
| +5 Volts monitor |  |
| _ROLL_ROT | 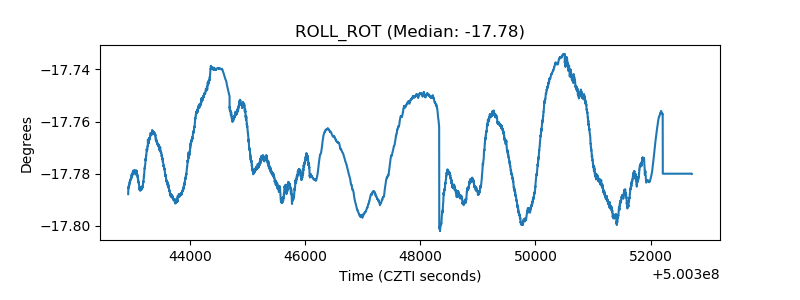 |
| _Roll_DEC | 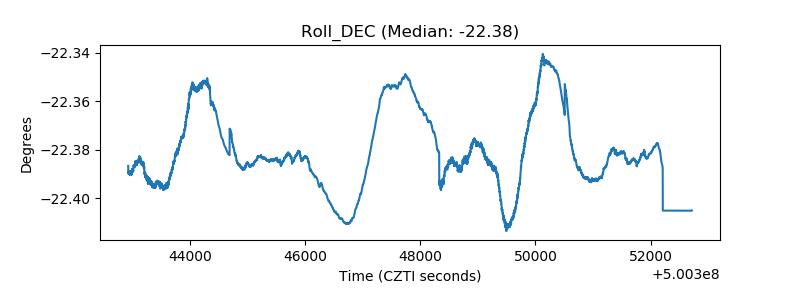 |
| _Roll_RA | 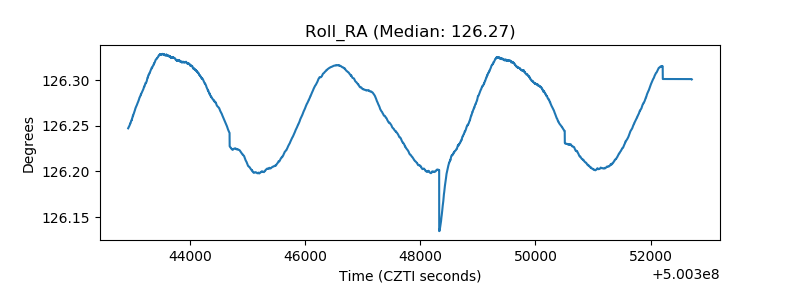 |
| Veto Counter | 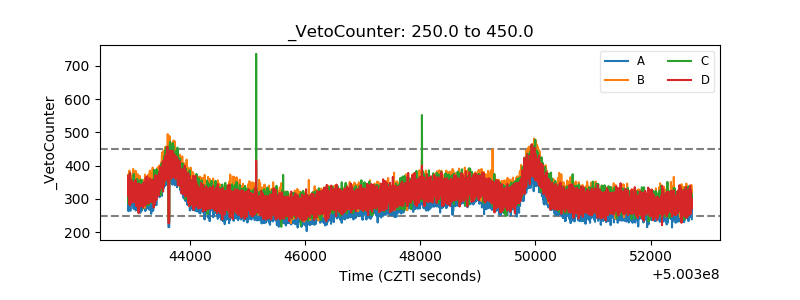 |