| Param | Original file | Final file |
|---|---|---|
| Filename | modeM0/AS1A14_103T01_9000006524_54731cztM0_level2.fits | modeM0/AS1A14_103T01_9000006524_54731cztM0_level2_quad_clean.evt |
| Size (bytes) | 2,265,269,760 | 368,688,960 |
| Size | 2.1 GB | 351.6 MB |
| Events in quadrant A | 13,707,107 | 2,465,337 |
| Events in quadrant B | 23,066,243 | 2,498,799 |
| Events in quadrant C | 16,067,031 | 2,349,492 |
| Events in quadrant D | 28,882,602 | 1,951,682 |
| Mode SS | |||
|---|---|---|---|
| Quadrant | BADHDUFLAG | Total packets | Discarded packets |
| A | 0 | 562 | 0 |
| B | 0 | 562 | 0 |
| C | 0 | 562 | 0 |
| D | 0 | 562 | 0 |
| Mode M0 | |||
|---|---|---|---|
| Quadrant | BADHDUFLAG | Total packets | Discarded packets |
| A | 0 | 61550 | 4 |
| B | 0 | 88044 | 4 |
| C | 0 | 68759 | 4 |
| D | 0 | 105136 | 4 |
| Mode M9 | |||
|---|---|---|---|
| Quadrant | BADHDUFLAG | Total packets | Discarded packets |
| A | 0 | 24 | 0 |
| B | 0 | 24 | 0 |
| C | 0 | 24 | 0 |
| D | 0 | 24 | 0 |
| Quadrant | Total seconds | Saturated seconds | Saturation percentage |
|---|---|---|---|
| A | 27573 | 676 | 2.451674% |
| B | 27574 | 2876 | 10.430115% |
| C | 27574 | 1101 | 3.992892% |
| D | 27574 | 4780 | 17.335171% |
Noise dominated data is calculated using 1-second bins in cleaned event files. If a bin has >2000 counts, and if more than 50% of those come from <1% of pixels, then it is considered to be noise-dominated and hence unusable.
| Quadrant | # 1 sec bins | Bins with >0 counts | Bins with >2000 counts | High rate bins dominated by noise | Noise dominated (total time) | Noise dominated (detector-on time) | Marked lightcurve |
|---|---|---|---|---|---|---|---|
| A | 30084 | 27575 | 226 | 226 | 0.75% | 0.82% | 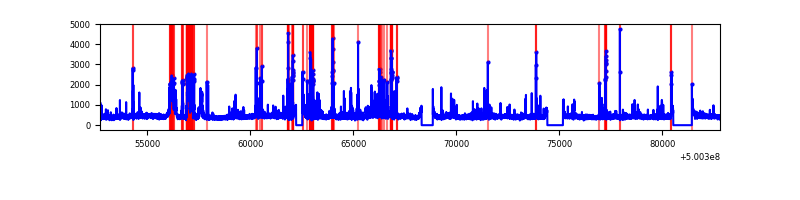 |
| B | 30085 | 27574 | 2100 | 2100 | 6.98% | 7.62% | 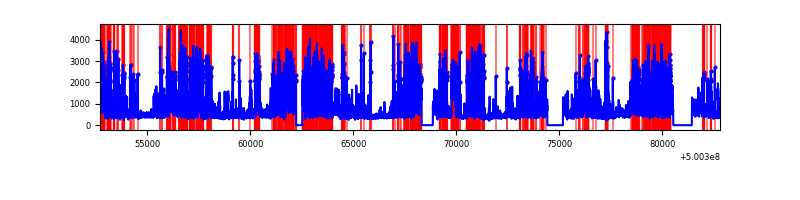 |
| C | 30085 | 27575 | 853 | 853 | 2.84% | 3.09% | 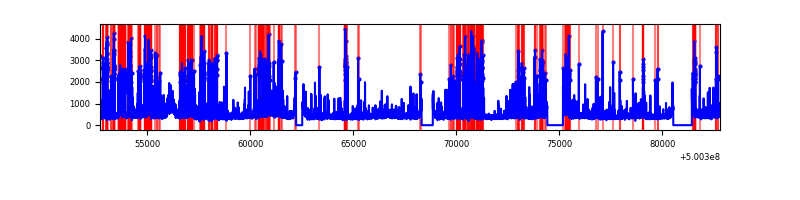 |
| D | 30085 | 27575 | 4245 | 4245 | 14.11% | 15.39% | 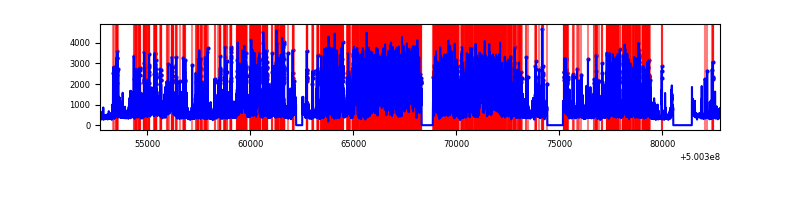 |
Top three noisy pixels from each quadrant. If the there are fewer than three noisy pixels in the level2.evt file, extra rows are filled as -1
| Pixel properties | Quadrant properties | ||||||
|---|---|---|---|---|---|---|---|
| Quadrant | DetID | PixID | Counts | Sigma | Mean | Median | Sigma |
| A | 7 | 14 | 983146 | 1402.29 | 2848 | 2775 | 699.1 |
| A | 0 | 8 | 675515 | 962.27 | 2848 | 2775 | 699.1 |
| A | 7 | 190 | 348905 | 495.09 | 2848 | 2775 | 699.1 |
| B | 2 | 249 | 6470262 | 11091.2 | 2734 | 2636 | 583.1 |
| B | 0 | 173 | 3410392 | 5843.89 | 2734 | 2636 | 583.1 |
| B | 5 | 185 | 1535636 | 2628.91 | 2734 | 2636 | 583.1 |
| C | 14 | 254 | 1376583 | 1822.55 | 2759 | 2728 | 753.8 |
| C | 1 | 16 | 982777 | 1300.13 | 2759 | 2728 | 753.8 |
| C | 9 | 38 | 932422 | 1233.32 | 2759 | 2728 | 753.8 |
| D | 15 | 94 | 9833047 | 13404.92 | 2604 | 2490 | 733.4 |
| D | 11 | 129 | 6510781 | 8874.69 | 2604 | 2490 | 733.4 |
| D | 2 | 62 | 661633 | 898.81 | 2604 | 2490 | 733.4 |
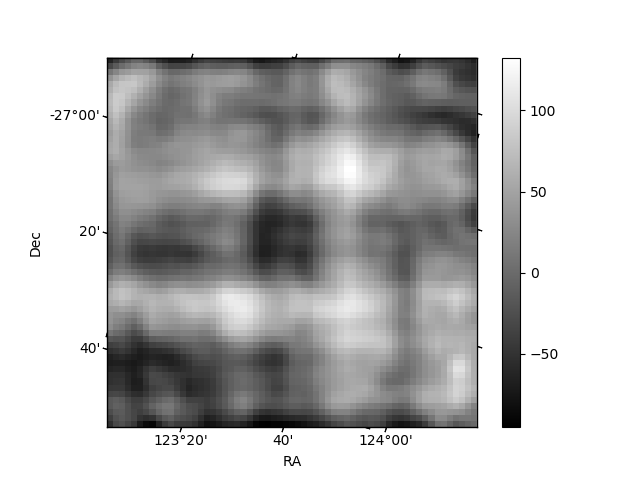
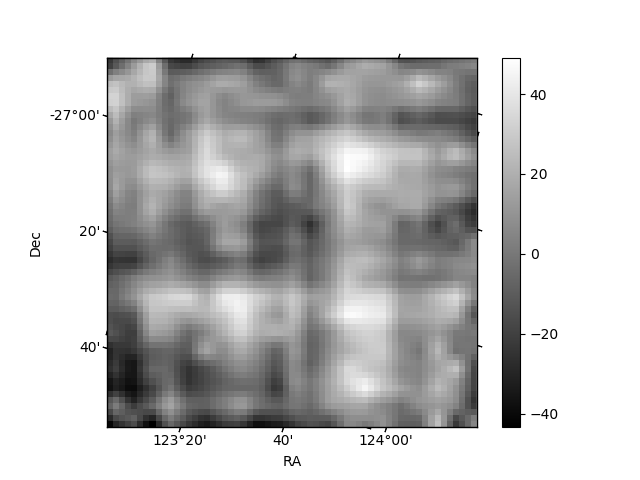
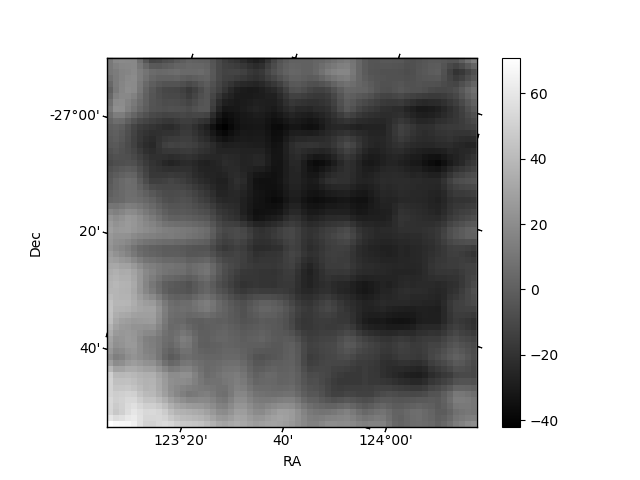
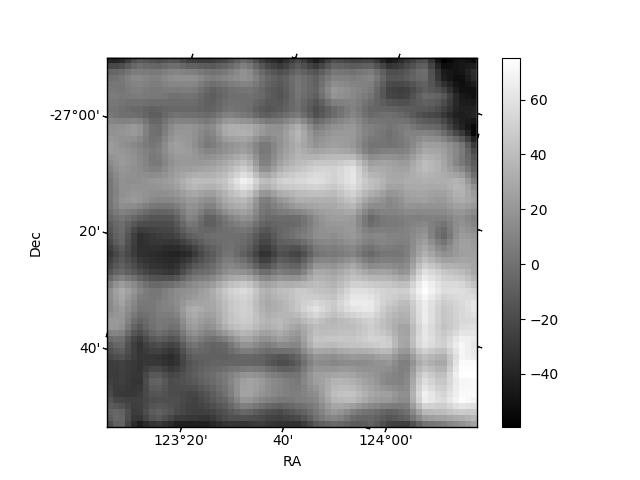
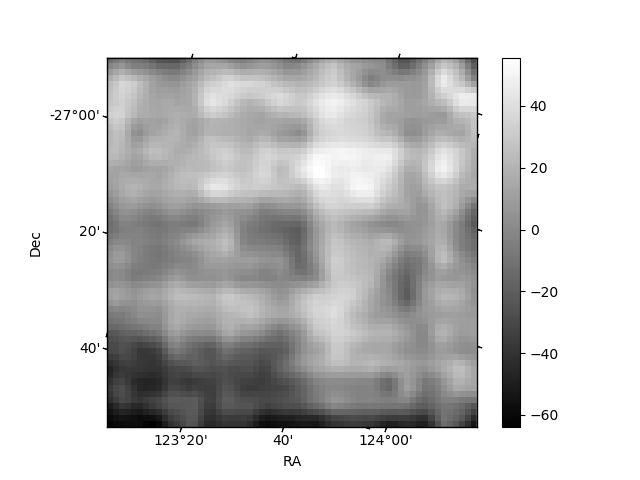
Histogram calculated using DETX and DETY for each event in the final _common_clean file
| Quadrant A | 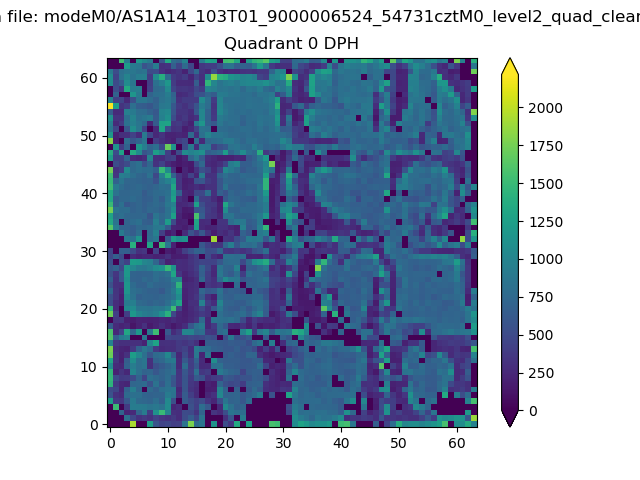 |
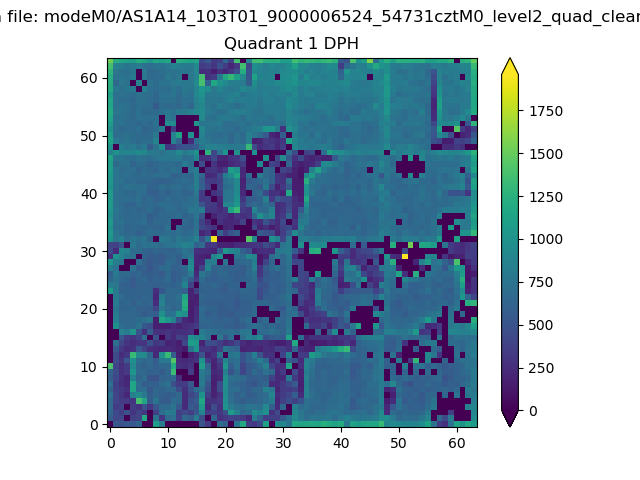 |
Quadrant B |
|---|---|---|---|
| Quadrant D | 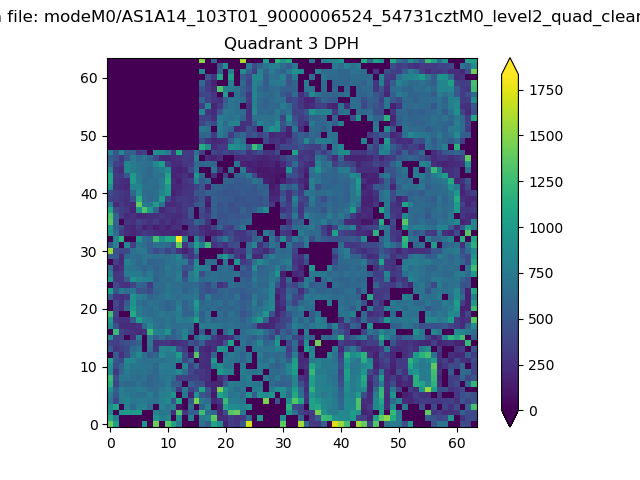 |
 |
Quadrant C |
| Plot type | Count rate plots | Images |
|---|---|---|
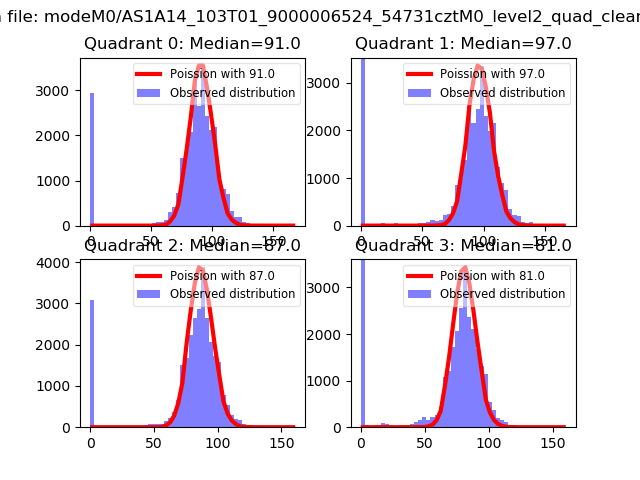
| Comparison with Poisson distribution Blue bars denote a histogram of data divided into 1 sec bins. Red curve is a Poisson curve with rate = median count rate of data. |
 |
 |
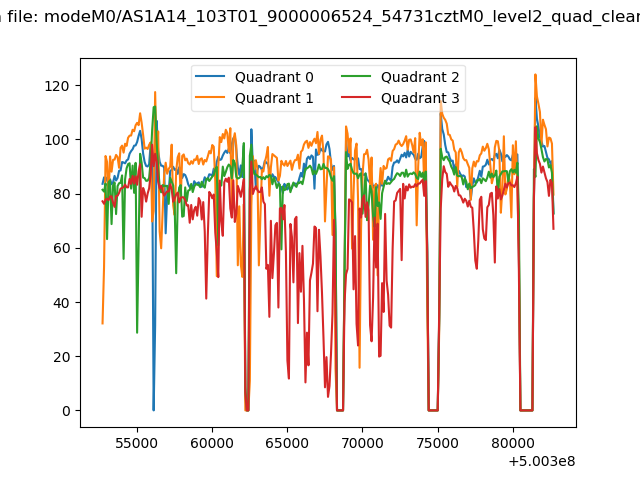
| Quadrant-wise count rates Data is divided into 100 sec bins |
 |
|
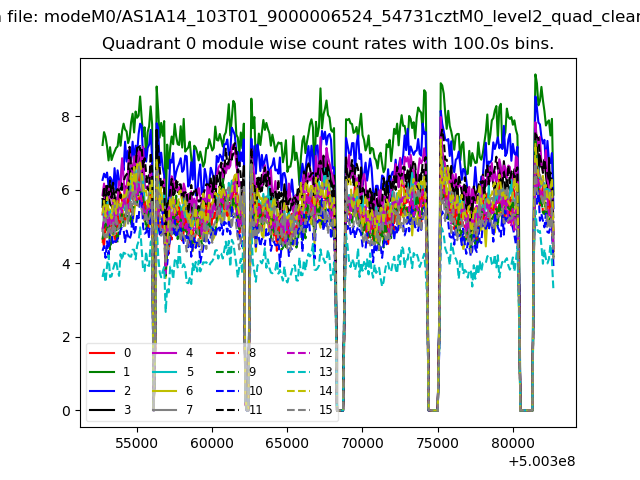
| Module-wise count rates for Quadrant A Data is divided into 100 sec bins |
 |
 |
| Module-wise count rates for Quadrant B Data is divided into 100 sec bins |
 |
 |
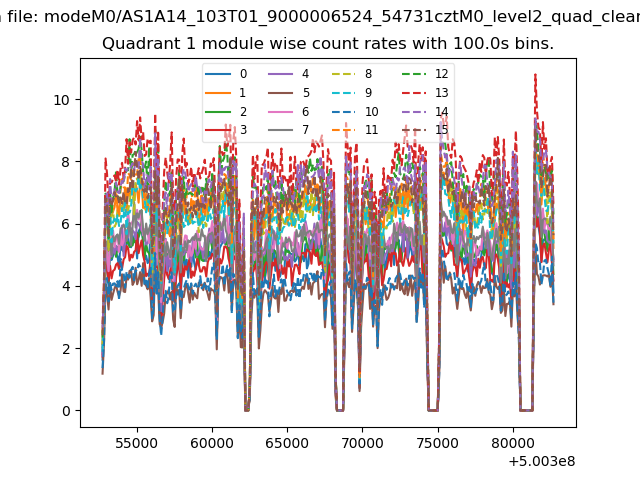
| Module-wise count rates for Quadrant C Data is divided into 100 sec bins |
 |
 |
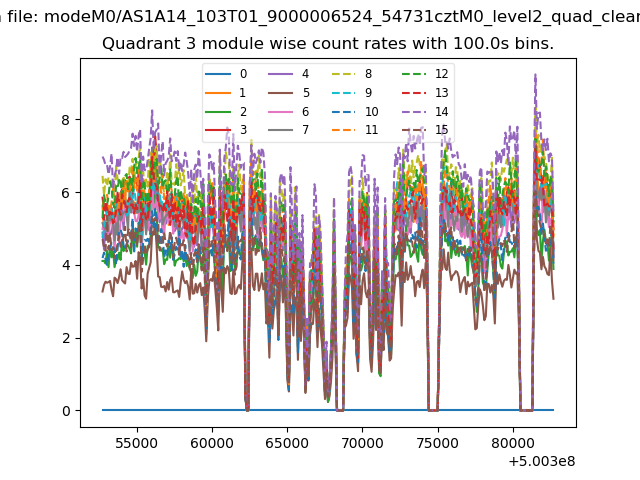
| Module-wise count rates for Quadrant D Data is divided into 100 sec bins |
 |
 |
| Parameter | Plot |
|---|---|
| CZT HV Monitor | 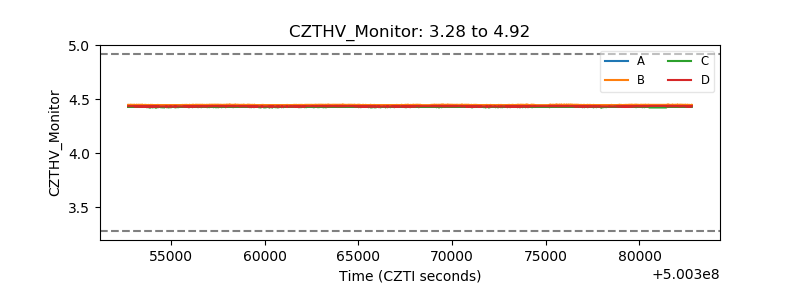 |
| D_VDD | 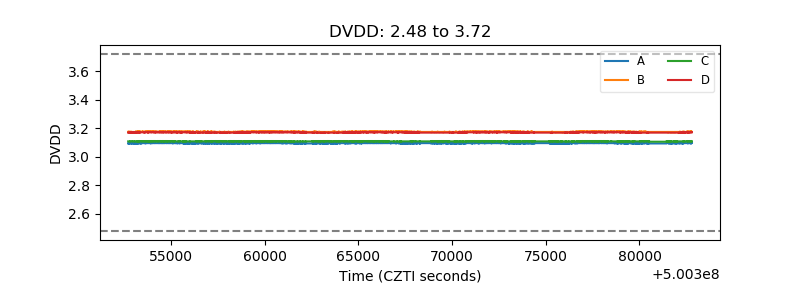 |
| Temperature 1 | 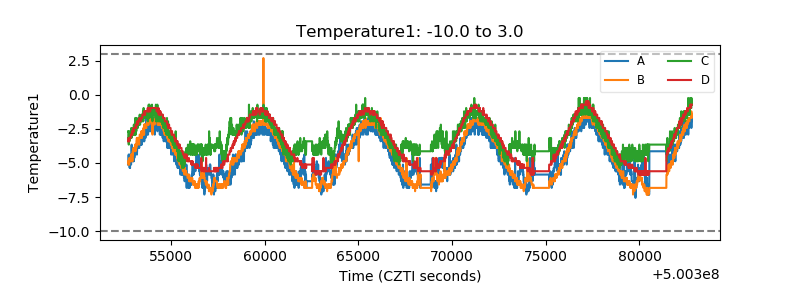 |
| Veto HV Monitor | 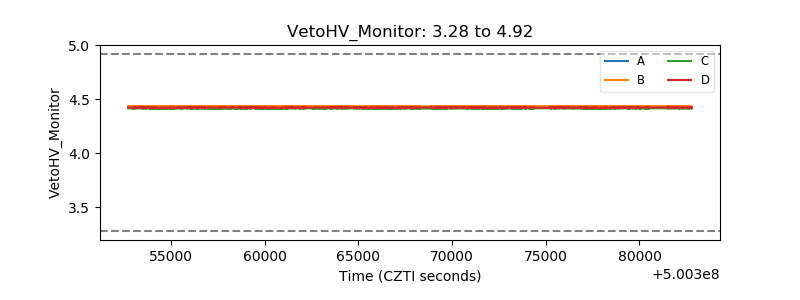 |
| Veto LLD | 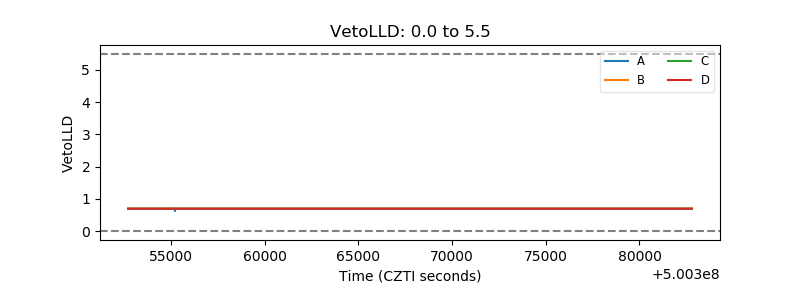 |
| Alpha Counter | 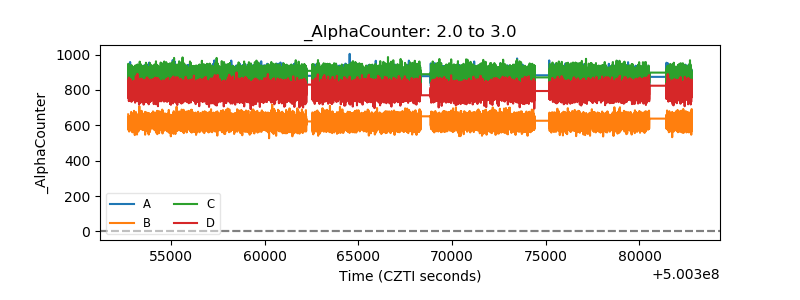 |
| _CPM_Rate | 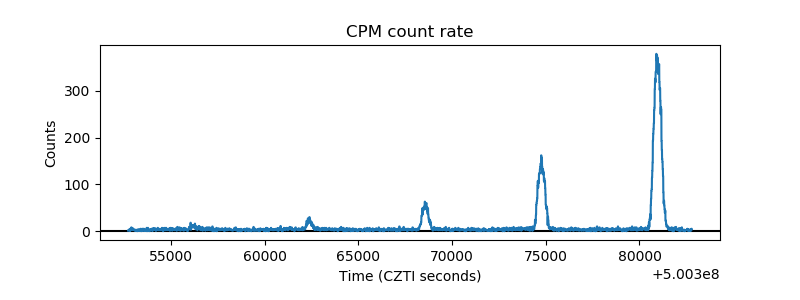 |
| CZT Counter | 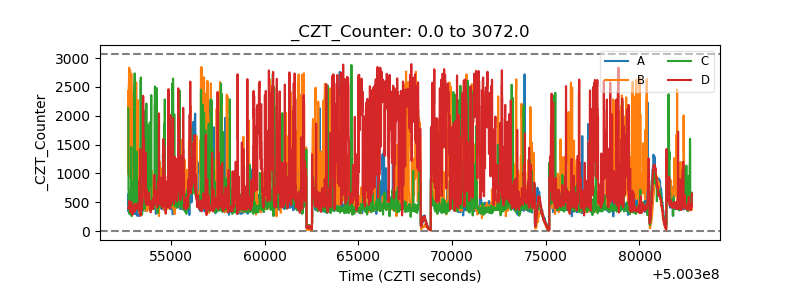 |
| +2.5 Volts monitor |  |
| +5 Volts monitor |  |
| _ROLL_ROT | 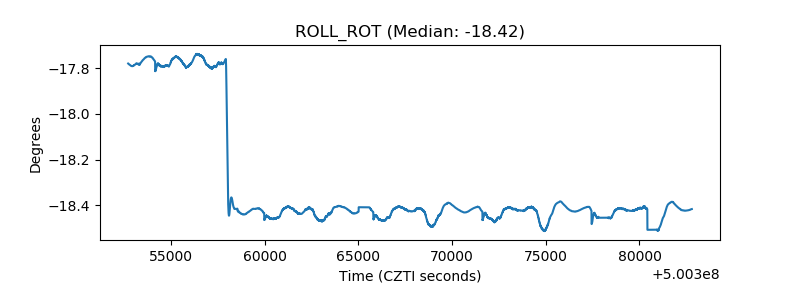 |
| _Roll_DEC | 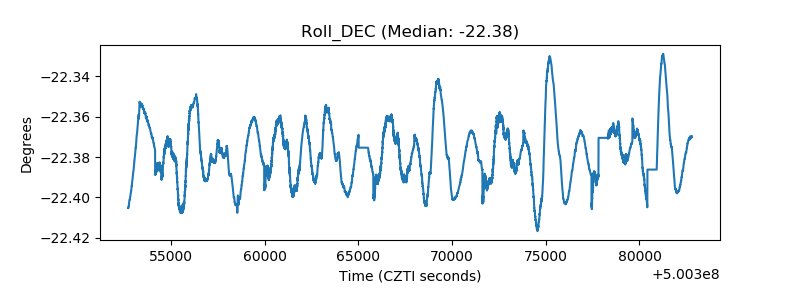 |
| _Roll_RA | 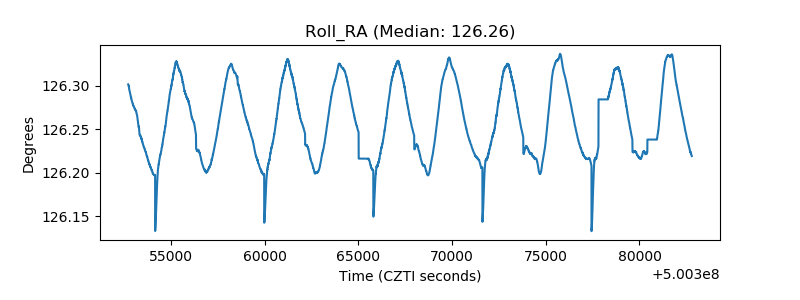 |
| Veto Counter | 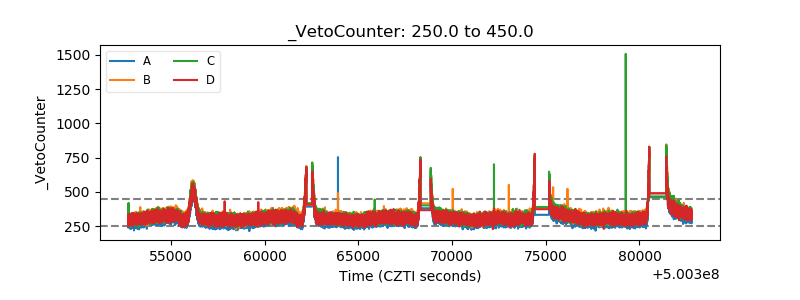 |