| Param | Original file | Final file |
|---|---|---|
| Filename | modeM0/AS1A14_103T01_9000006524_54734cztM0_level2.fits | modeM0/AS1A14_103T01_9000006524_54734cztM0_level2_quad_clean.evt |
| Size (bytes) | 510,546,240 | 96,111,360 |
| Size | 486.9 MB | 91.7 MB |
| Events in quadrant A | 3,112,799 | 659,930 |
| Events in quadrant B | 6,857,276 | 597,785 |
| Events in quadrant C | 3,566,880 | 624,849 |
| Events in quadrant D | 4,853,600 | 571,381 |
| Mode SS | |||
|---|---|---|---|
| Quadrant | BADHDUFLAG | Total packets | Discarded packets |
| A | 0 | 134 | 0 |
| B | 0 | 134 | 0 |
| C | 0 | 134 | 0 |
| D | 0 | 134 | 0 |
| Mode M0 | |||
|---|---|---|---|
| Quadrant | BADHDUFLAG | Total packets | Discarded packets |
| A | 0 | 13795 | 2 |
| B | 0 | 24713 | 2 |
| C | 0 | 15162 | 2 |
| D | 0 | 18947 | 2 |
| Mode M9 | |||
|---|---|---|---|
| Quadrant | BADHDUFLAG | Total packets | Discarded packets |
| A | 0 | 11 | 0 |
| B | 0 | 11 | 0 |
| C | 0 | 11 | 0 |
| D | 0 | 11 | 0 |
| Quadrant | Total seconds | Saturated seconds | Saturation percentage |
|---|---|---|---|
| A | 6539 | 118 | 1.804557% |
| B | 6539 | 1338 | 20.461844% |
| C | 6540 | 163 | 2.492355% |
| D | 6540 | 357 | 5.458716% |
Noise dominated data is calculated using 1-second bins in cleaned event files. If a bin has >2000 counts, and if more than 50% of those come from <1% of pixels, then it is considered to be noise-dominated and hence unusable.
| Quadrant | # 1 sec bins | Bins with >0 counts | Bins with >2000 counts | High rate bins dominated by noise | Noise dominated (total time) | Noise dominated (detector-on time) | Marked lightcurve |
|---|---|---|---|---|---|---|---|
| A | 7719 | 6539 | 3 | 3 | 0.04% | 0.05% | 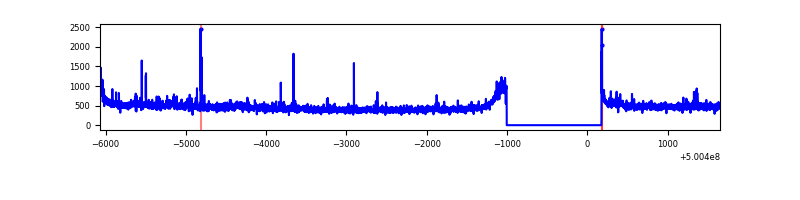 |
| B | 7719 | 6539 | 1122 | 1122 | 14.54% | 17.16% | 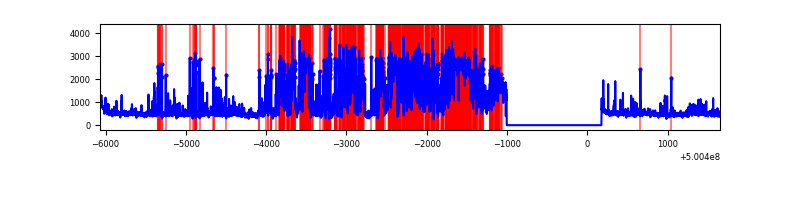 |
| C | 7720 | 6540 | 80 | 80 | 1.04% | 1.22% | 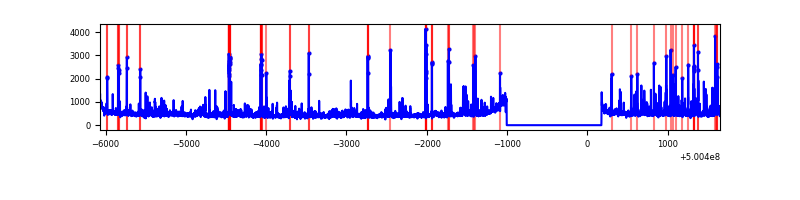 |
| D | 7720 | 6540 | 292 | 292 | 3.78% | 4.46% | 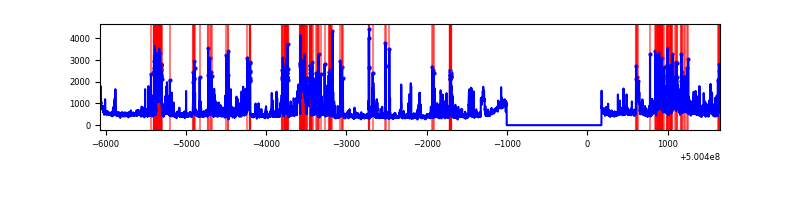 |
Top three noisy pixels from each quadrant. If the there are fewer than three noisy pixels in the level2.evt file, extra rows are filled as -1
| Pixel properties | Quadrant properties | ||||||
|---|---|---|---|---|---|---|---|
| Quadrant | DetID | PixID | Counts | Sigma | Mean | Median | Sigma |
| A | 11 | 3 | 113687 | 624.98 | 737 | 720 | 180.8 |
| A | 4 | 3 | 52961 | 289.02 | 737 | 720 | 180.8 |
| A | 3 | 14 | 27532 | 148.33 | 737 | 720 | 180.8 |
| B | 0 | 173 | 1964902 | 14006.1 | 666 | 644 | 140.2 |
| B | 2 | 249 | 1802118 | 12845.37 | 666 | 644 | 140.2 |
| B | 5 | 185 | 119928 | 850.55 | 666 | 644 | 140.2 |
| C | 13 | 3 | 223922 | 1132.57 | 710 | 704 | 197.1 |
| C | 6 | 223 | 139926 | 706.39 | 710 | 704 | 197.1 |
| C | 12 | 252 | 117717 | 593.71 | 710 | 704 | 197.1 |
| D | 3 | 12 | 863926 | 4302.71 | 704 | 674 | 200.6 |
| D | 11 | 129 | 563343 | 2804.51 | 704 | 674 | 200.6 |
| D | 10 | 181 | 183176 | 909.65 | 704 | 674 | 200.6 |
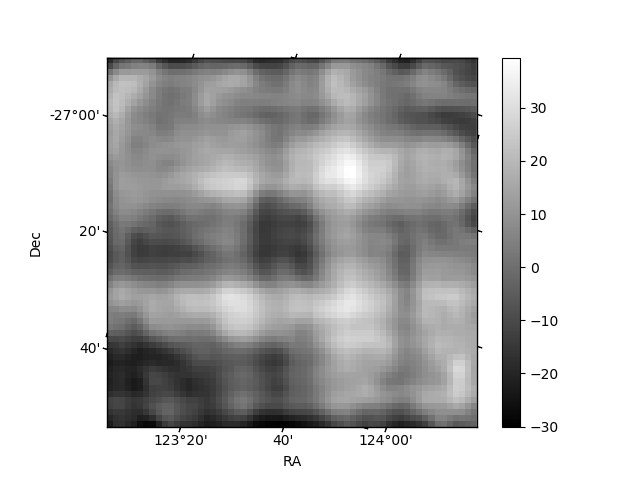
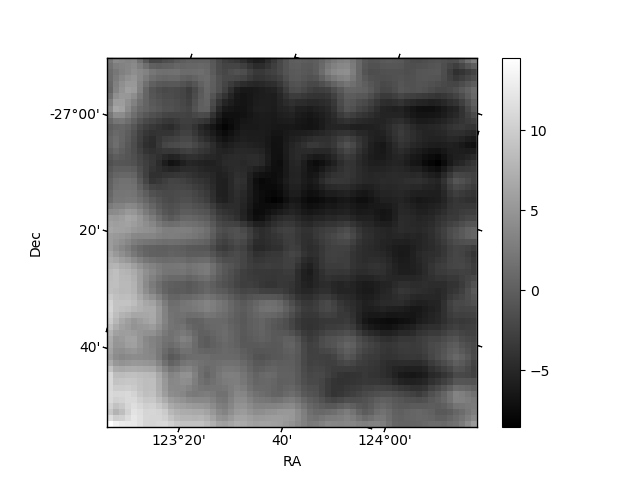
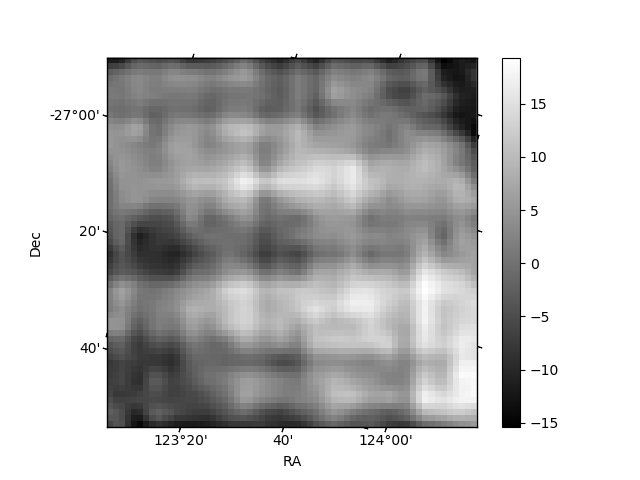
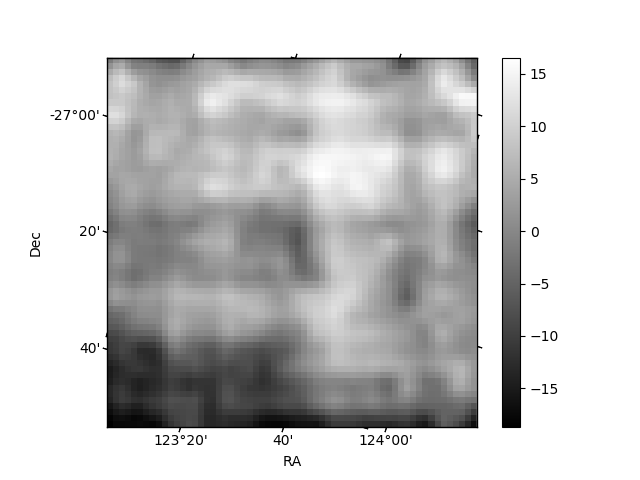
Histogram calculated using DETX and DETY for each event in the final _common_clean file
| Quadrant A | 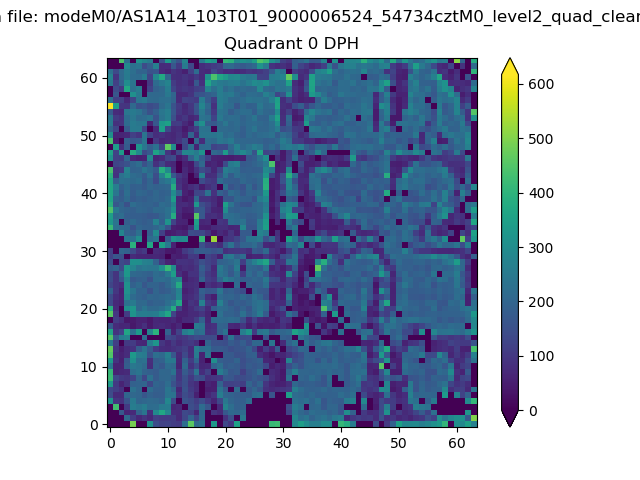 |
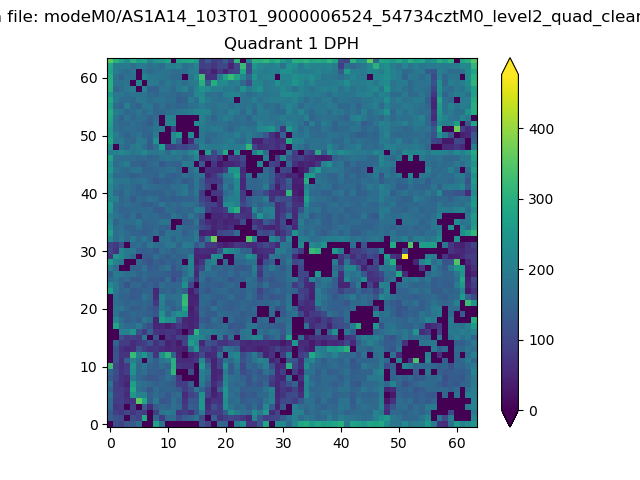 |
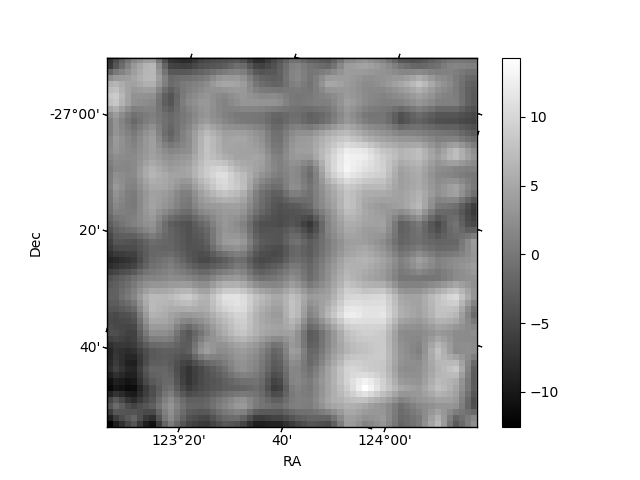
Quadrant B |
|---|---|---|---|
| Quadrant D | 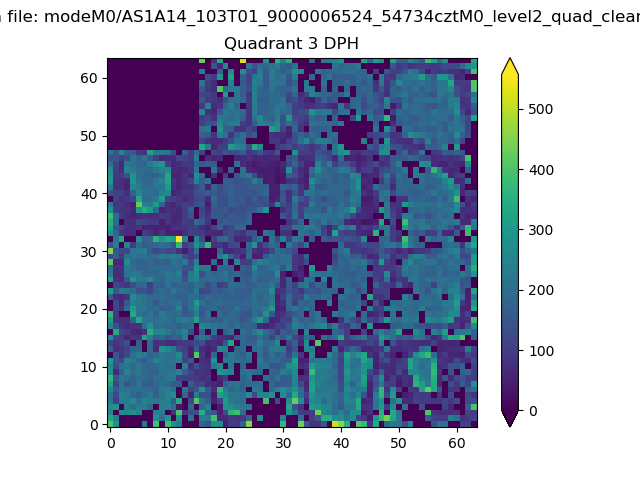 |
 |
Quadrant C |
| Plot type | Count rate plots | Images |
|---|---|---|
| Comparison with Poisson distribution Blue bars denote a histogram of data divided into 1 sec bins. Red curve is a Poisson curve with rate = median count rate of data. |
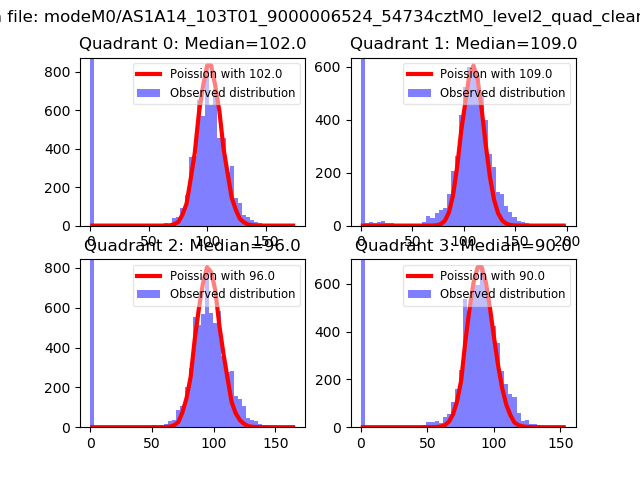 |
 |
| Quadrant-wise count rates Data is divided into 100 sec bins |
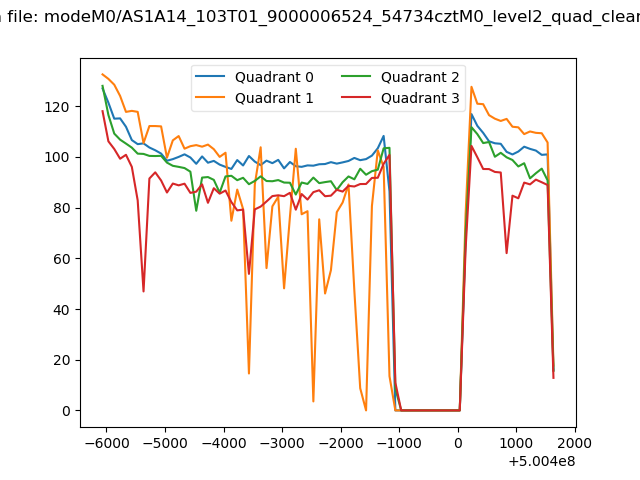 |
|
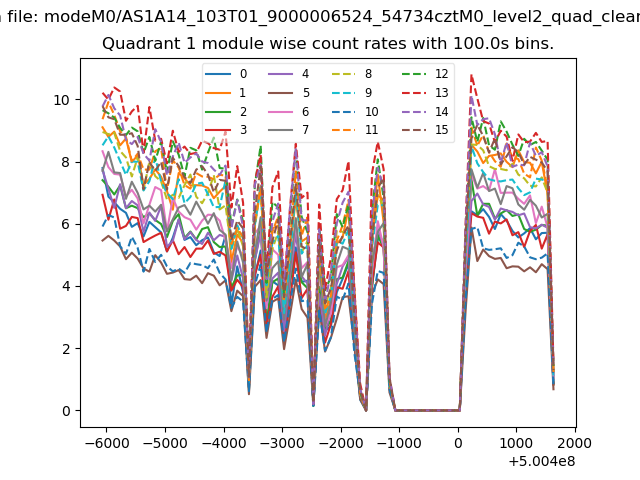
| Module-wise count rates for Quadrant A Data is divided into 100 sec bins |
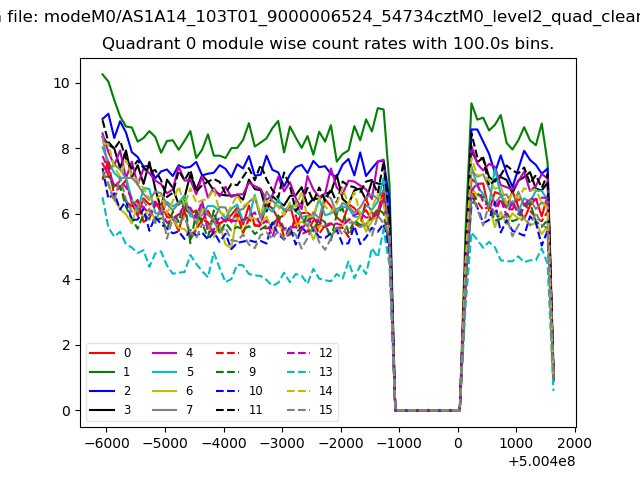 |
 |
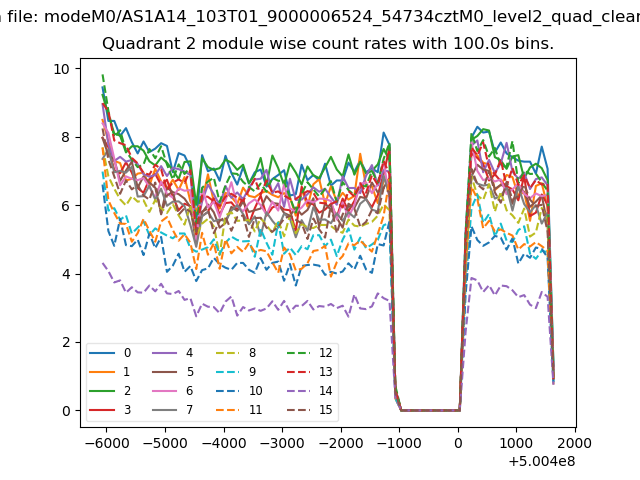
| Module-wise count rates for Quadrant B Data is divided into 100 sec bins |
 |
 |
| Module-wise count rates for Quadrant C Data is divided into 100 sec bins |
 |
 |
| Module-wise count rates for Quadrant D Data is divided into 100 sec bins |
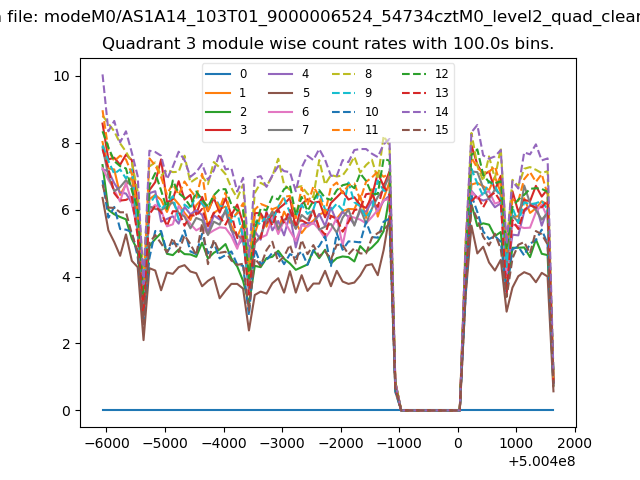 |
 |
| Parameter | Plot |
|---|---|
| CZT HV Monitor | 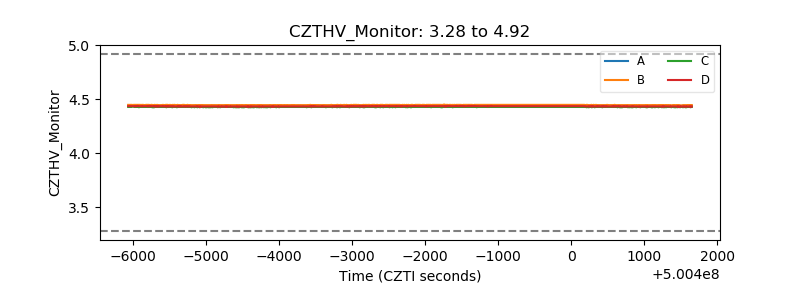 |
| D_VDD | 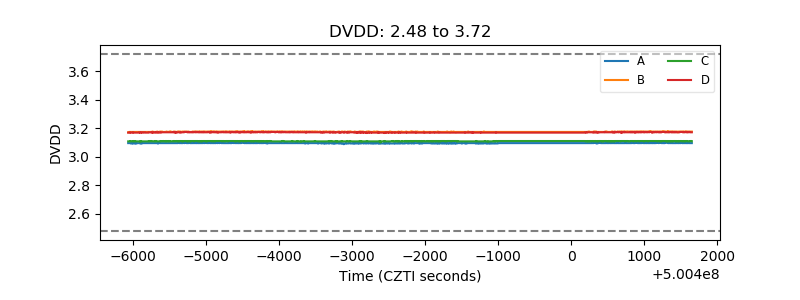 |
| Temperature 1 | 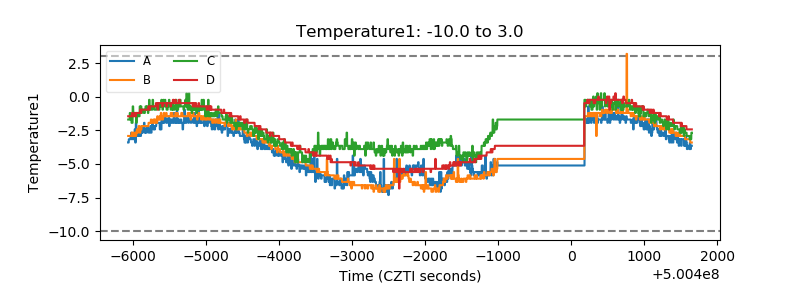 |
| Veto HV Monitor | 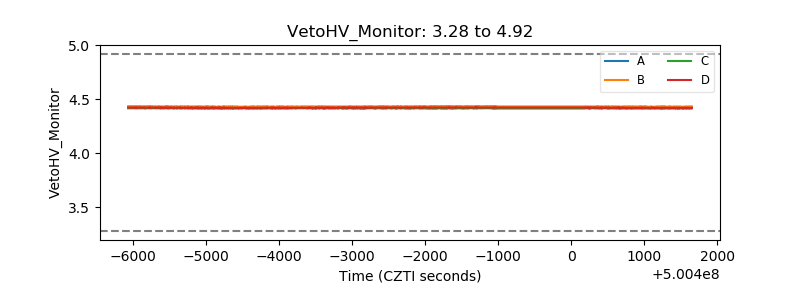 |
| Veto LLD | 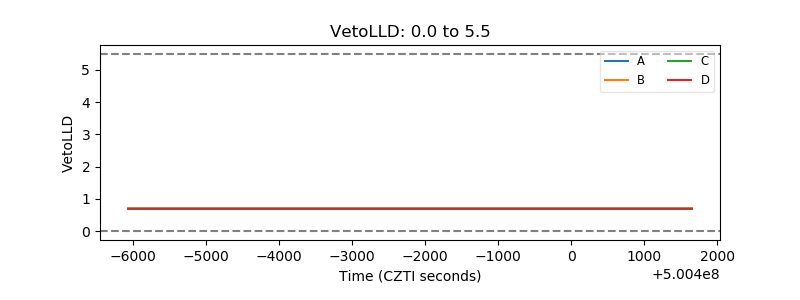 |
| Alpha Counter | 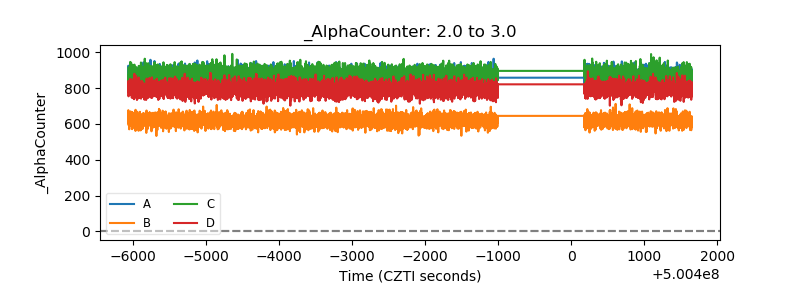 |
| _CPM_Rate | 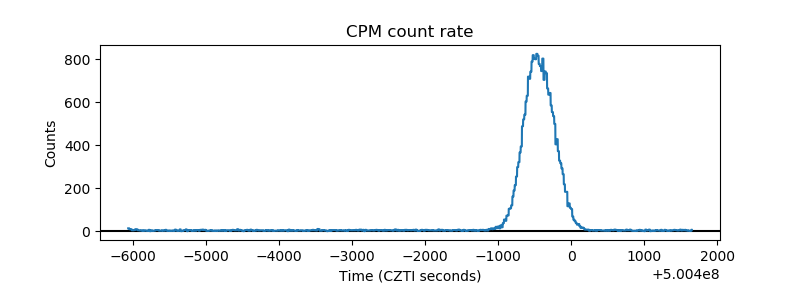 |
| CZT Counter | 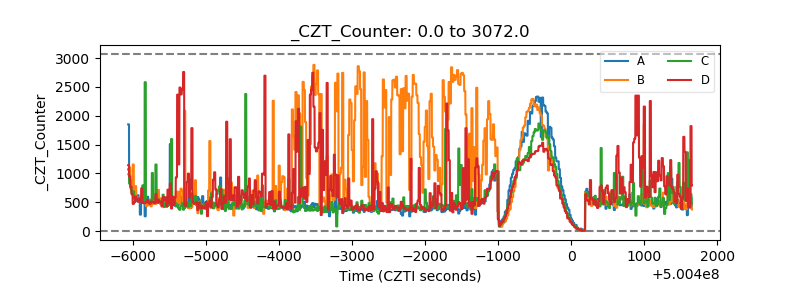 |
| +2.5 Volts monitor |  |
| +5 Volts monitor |  |
| _ROLL_ROT |  |
| _Roll_DEC | 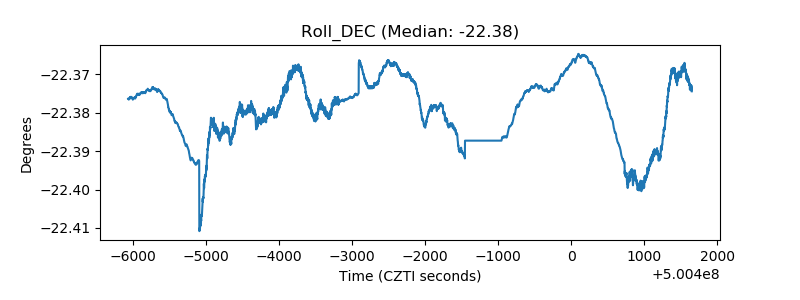 |
| _Roll_RA | 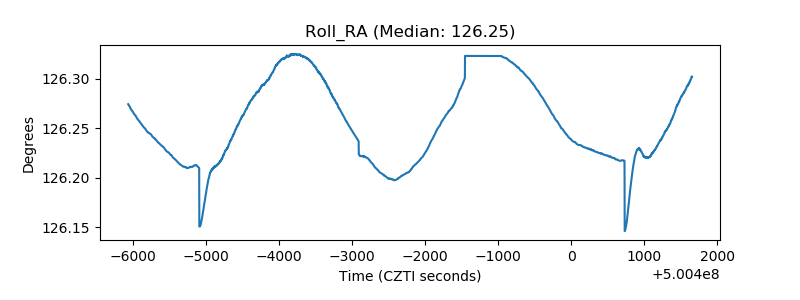 |
| Veto Counter | 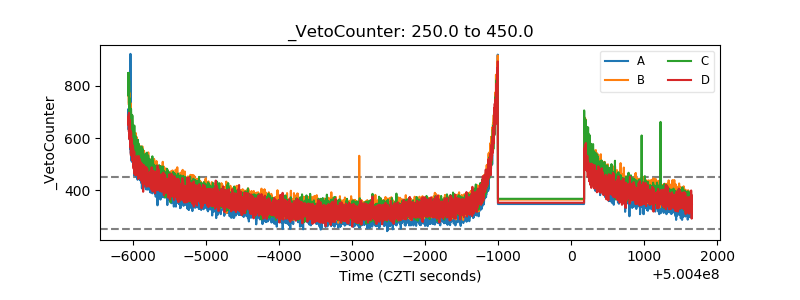 |