| Param | Original file | Final file |
|---|---|---|
| Filename | modeM0/AS1A14_103T01_9000006524_54736cztM0_level2.fits | modeM0/AS1A14_103T01_9000006524_54736cztM0_level2_quad_clean.evt |
| Size (bytes) | 434,488,320 | 96,897,600 |
| Size | 414.4 MB | 92.4 MB |
| Events in quadrant A | 3,085,196 | 641,164 |
| Events in quadrant B | 4,011,369 | 671,126 |
| Events in quadrant C | 3,492,428 | 602,440 |
| Events in quadrant D | 4,980,757 | 558,902 |
| Mode SS | |||
|---|---|---|---|
| Quadrant | BADHDUFLAG | Total packets | Discarded packets |
| A | 0 | 134 | 0 |
| B | 0 | 134 | 0 |
| C | 0 | 134 | 0 |
| D | 0 | 134 | 0 |
| Mode M0 | |||
|---|---|---|---|
| Quadrant | BADHDUFLAG | Total packets | Discarded packets |
| A | 0 | 13977 | 2 |
| B | 0 | 16565 | 2 |
| C | 0 | 15429 | 3 |
| D | 0 | 19445 | 2 |
| Mode M9 | |||
|---|---|---|---|
| Quadrant | BADHDUFLAG | Total packets | Discarded packets |
| A | 0 | 18 | 0 |
| B | 0 | 19 | 0 |
| C | 0 | 19 | 0 |
| D | 0 | 19 | 0 |
| Quadrant | Total seconds | Saturated seconds | Saturation percentage |
|---|---|---|---|
| A | 6605 | 83 | 1.256624% |
| B | 6605 | 298 | 4.511734% |
| C | 6604 | 179 | 2.710478% |
| D | 6604 | 272 | 4.118716% |
Noise dominated data is calculated using 1-second bins in cleaned event files. If a bin has >2000 counts, and if more than 50% of those come from <1% of pixels, then it is considered to be noise-dominated and hence unusable.
| Quadrant | # 1 sec bins | Bins with >0 counts | Bins with >2000 counts | High rate bins dominated by noise | Noise dominated (total time) | Noise dominated (detector-on time) | Marked lightcurve |
|---|---|---|---|---|---|---|---|
| A | 7610 | 6606 | 1 | 1 | 0.01% | 0.02% | 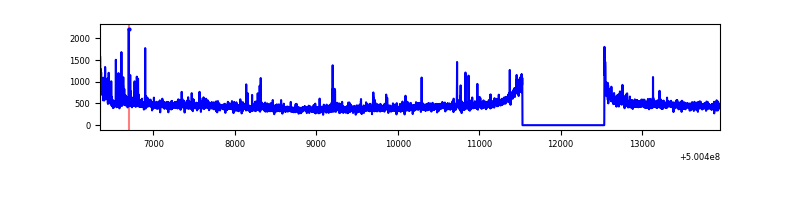 |
| B | 7610 | 6605 | 141 | 141 | 1.85% | 2.13% | 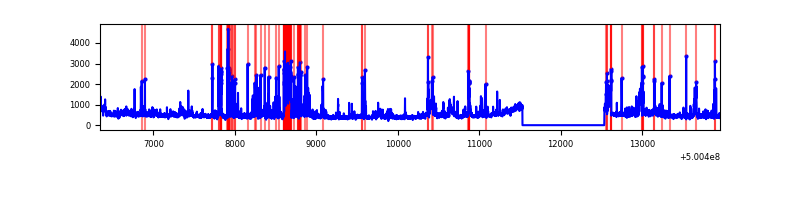 |
| C | 7609 | 6605 | 145 | 145 | 1.91% | 2.20% | 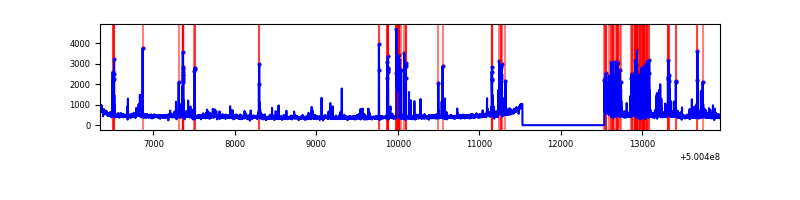 |
| D | 7609 | 6605 | 251 | 251 | 3.30% | 3.80% | 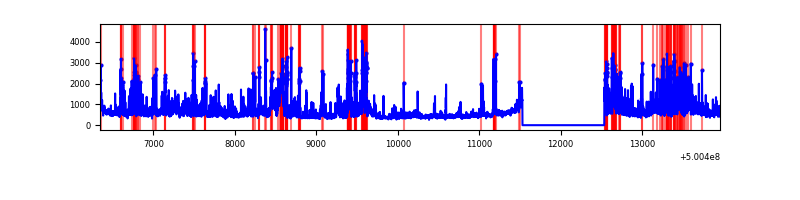 |
Top three noisy pixels from each quadrant. If the there are fewer than three noisy pixels in the level2.evt file, extra rows are filled as -1
| Pixel properties | Quadrant properties | ||||||
|---|---|---|---|---|---|---|---|
| Quadrant | DetID | PixID | Counts | Sigma | Mean | Median | Sigma |
| A | 3 | 14 | 115439 | 645.75 | 718 | 699 | 177.7 |
| A | 4 | 3 | 41187 | 227.86 | 718 | 699 | 177.7 |
| A | 4 | 249 | 30772 | 169.25 | 718 | 699 | 177.7 |
| B | 2 | 249 | 453357 | 3032.23 | 703 | 680 | 149.3 |
| B | 7 | 252 | 185483 | 1237.89 | 703 | 680 | 149.3 |
| B | 5 | 185 | 110263 | 734.03 | 703 | 680 | 149.3 |
| C | 1 | 16 | 230501 | 1212.39 | 688 | 682 | 189.6 |
| C | 6 | 223 | 208394 | 1095.77 | 688 | 682 | 189.6 |
| C | 4 | 5 | 146354 | 768.48 | 688 | 682 | 189.6 |
| D | 11 | 129 | 951560 | 4880.29 | 681 | 651 | 194.8 |
| D | 3 | 12 | 760390 | 3899.16 | 681 | 651 | 194.8 |
| D | 15 | 94 | 292407 | 1497.36 | 681 | 651 | 194.8 |
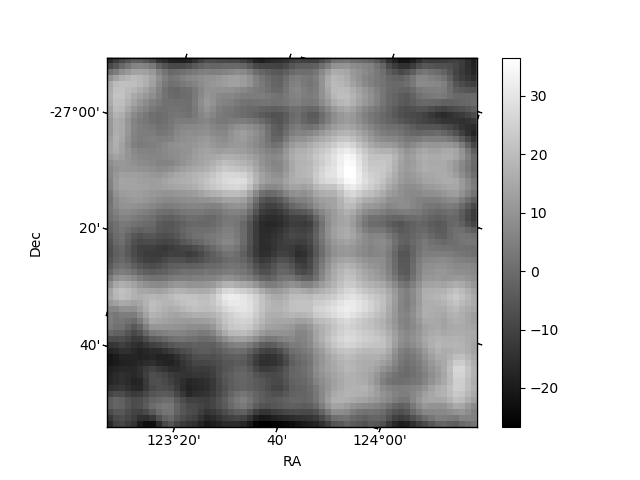
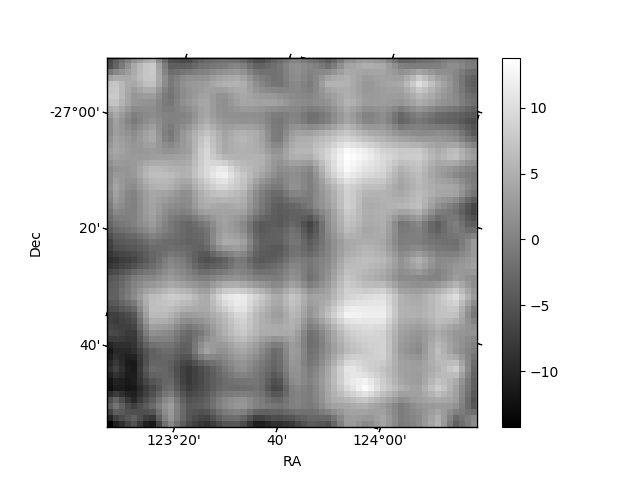
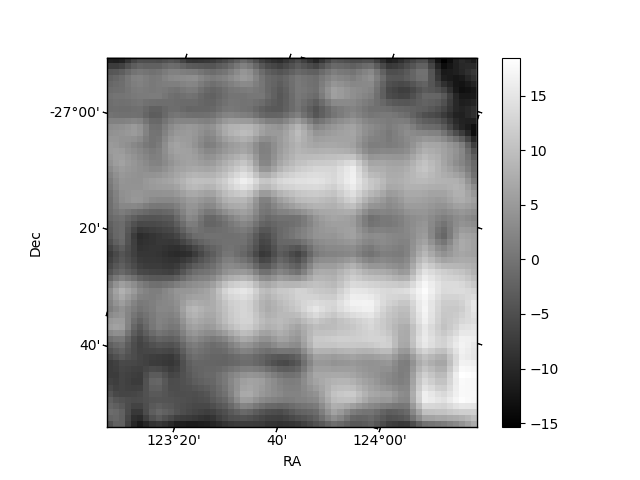
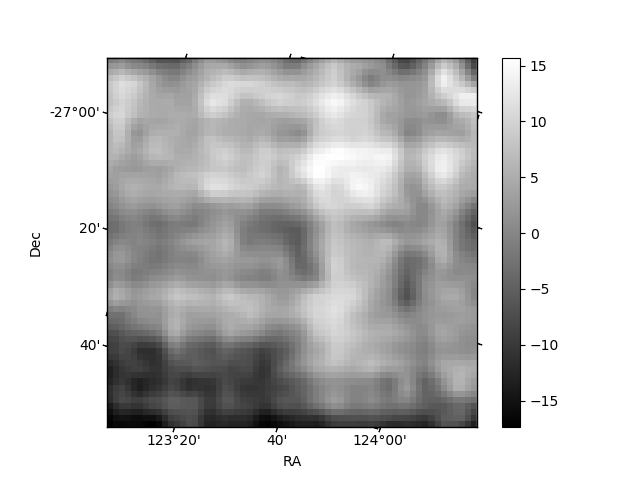
Histogram calculated using DETX and DETY for each event in the final _common_clean file
| Quadrant A | 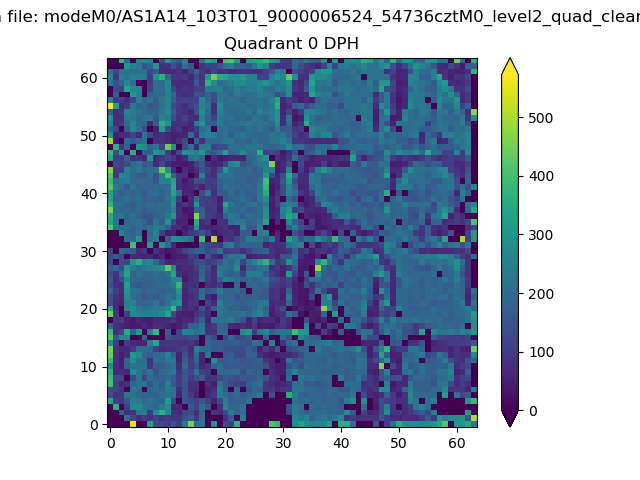 |
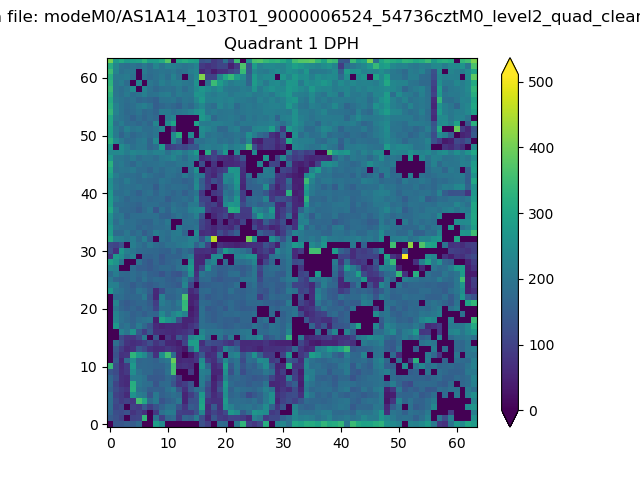 |
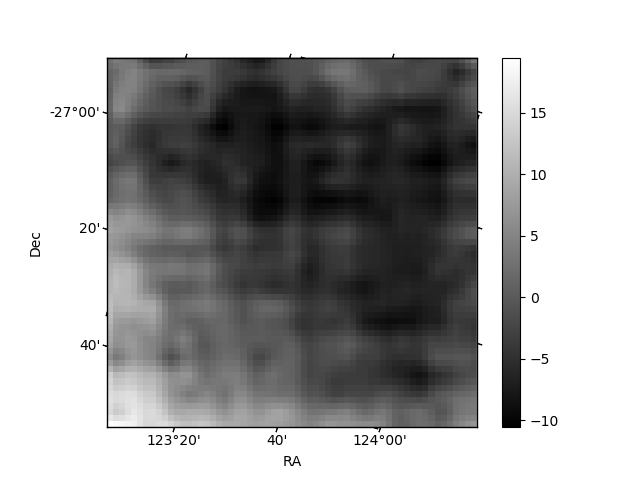
Quadrant B |
|---|---|---|---|
| Quadrant D | 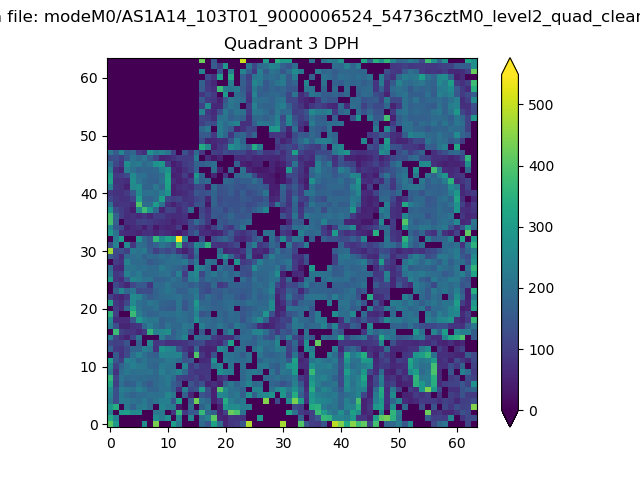 |
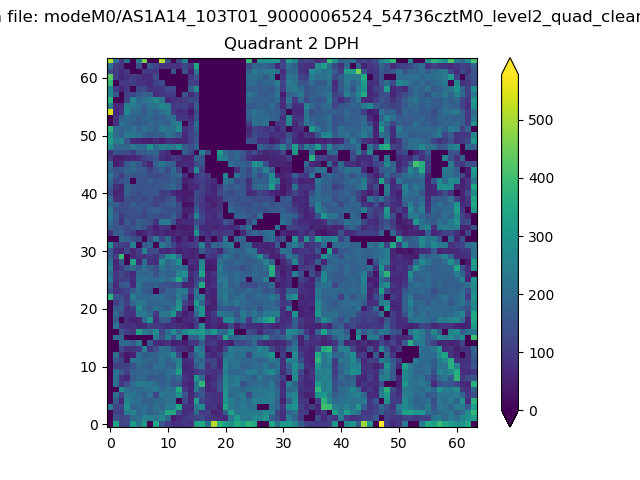 |
Quadrant C |
| Plot type | Count rate plots | Images |
|---|---|---|
| Comparison with Poisson distribution Blue bars denote a histogram of data divided into 1 sec bins. Red curve is a Poisson curve with rate = median count rate of data. |
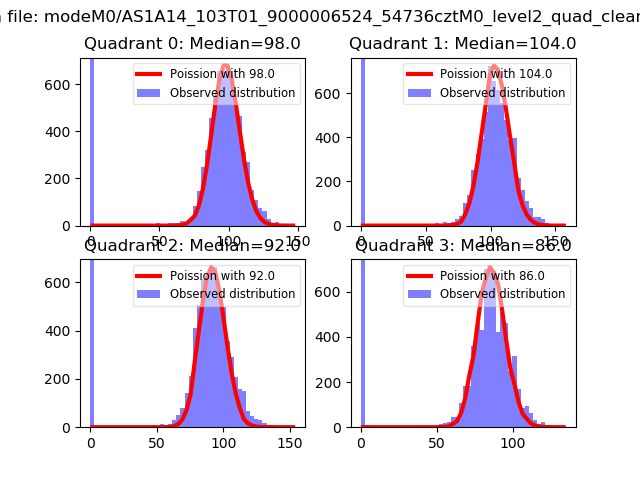 |
 |
| Quadrant-wise count rates Data is divided into 100 sec bins |
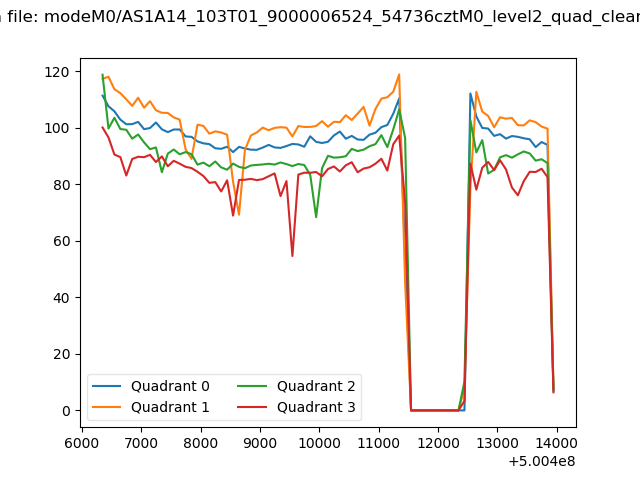 |
|
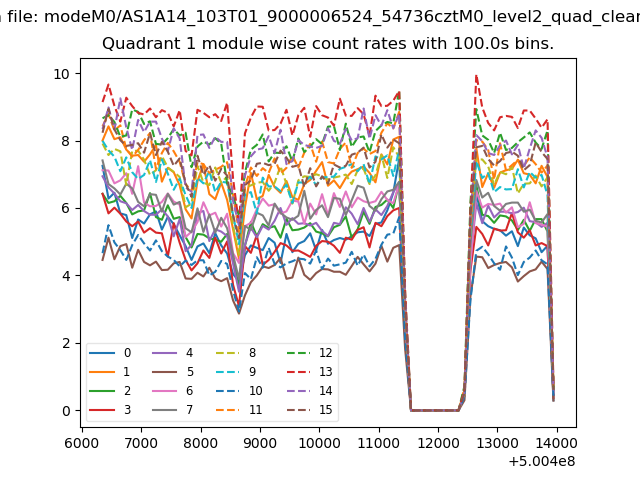
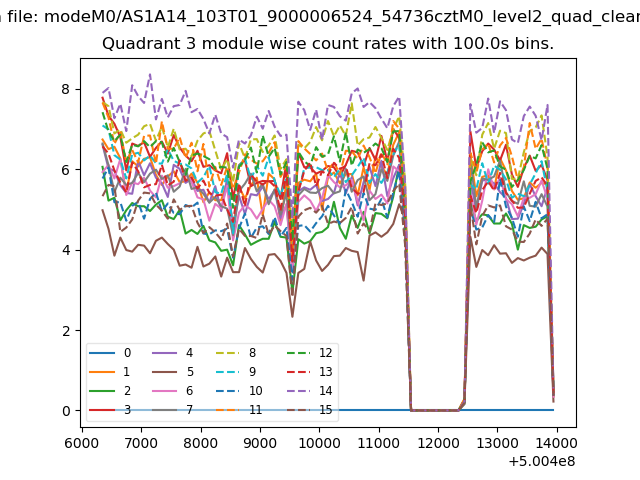
| Module-wise count rates for Quadrant A Data is divided into 100 sec bins |
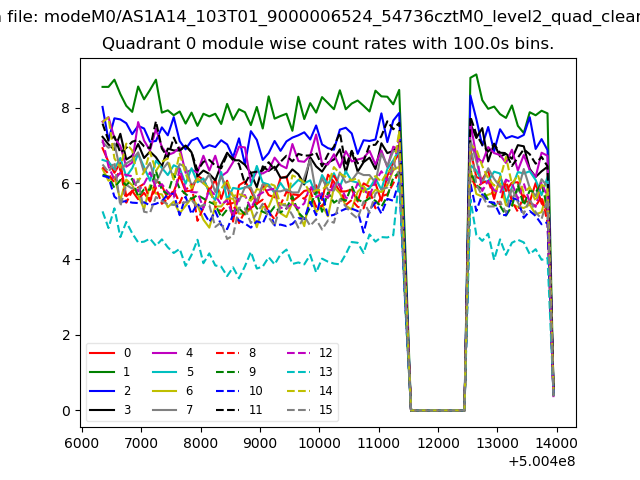 |
 |
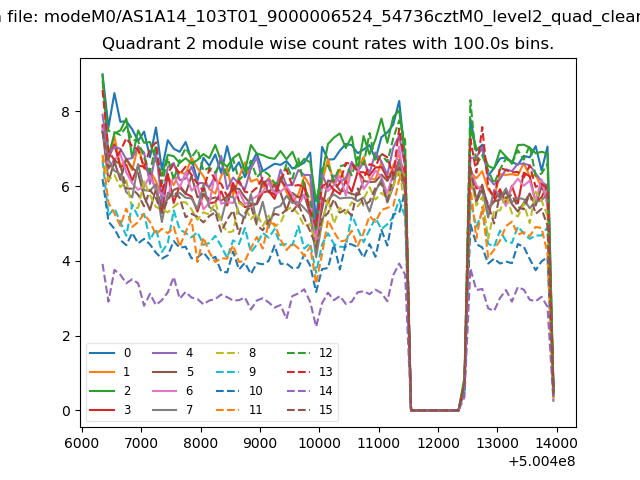
| Module-wise count rates for Quadrant B Data is divided into 100 sec bins |
 |
 |
| Module-wise count rates for Quadrant C Data is divided into 100 sec bins |
 |
 |
| Module-wise count rates for Quadrant D Data is divided into 100 sec bins |
 |
 |
| Parameter | Plot |
|---|---|
| CZT HV Monitor | 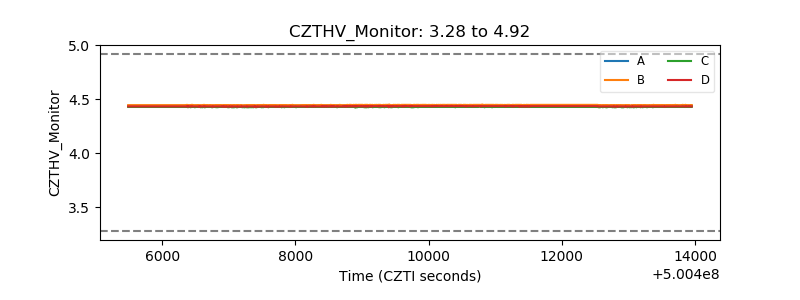 |
| D_VDD | 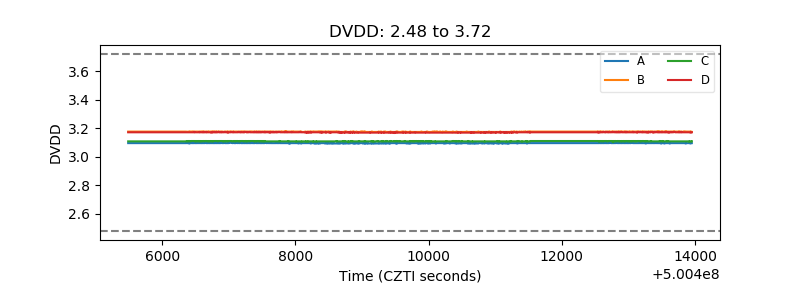 |
| Temperature 1 | 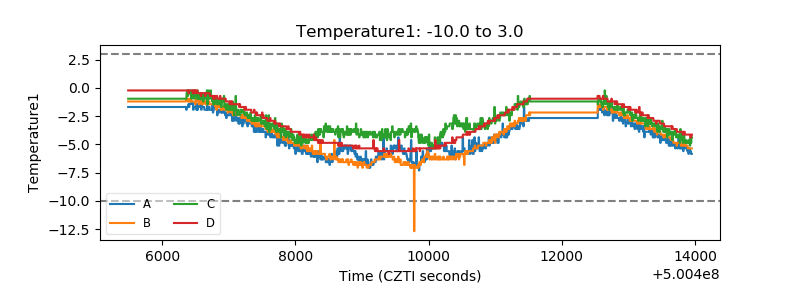 |
| Veto HV Monitor | 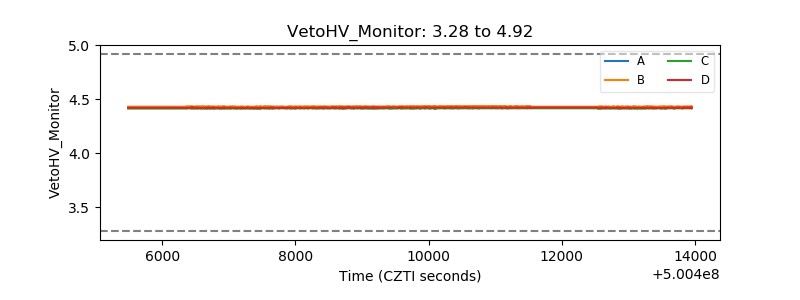 |
| Veto LLD | 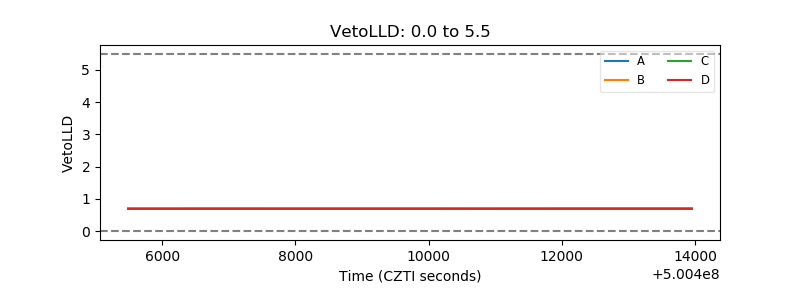 |
| Alpha Counter | 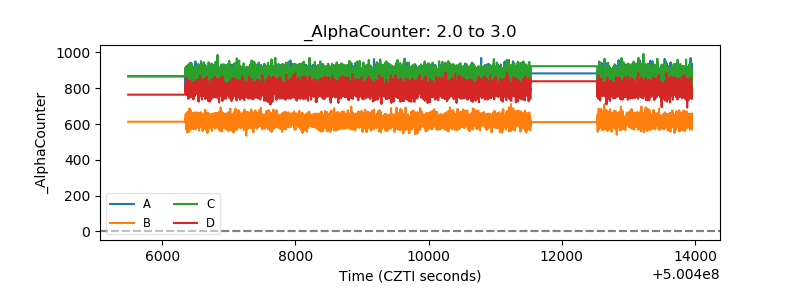 |
| _CPM_Rate | 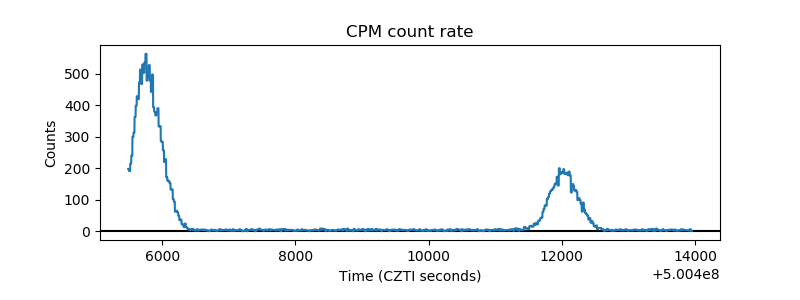 |
| CZT Counter | 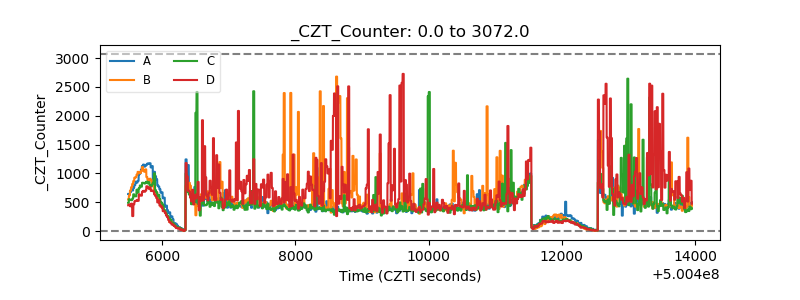 |
| +2.5 Volts monitor | 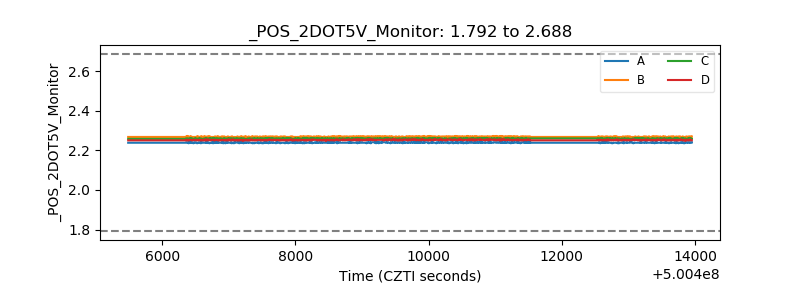 |
| +5 Volts monitor |  |
| _ROLL_ROT | 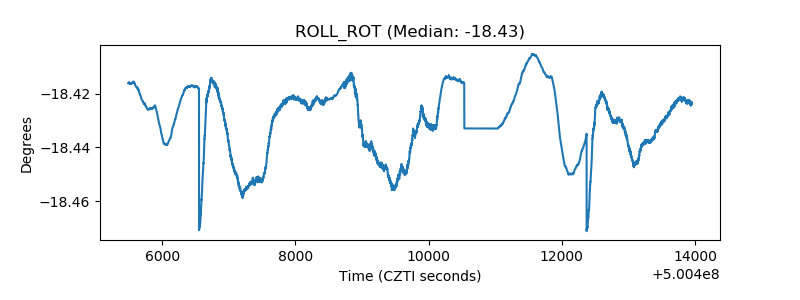 |
| _Roll_DEC | 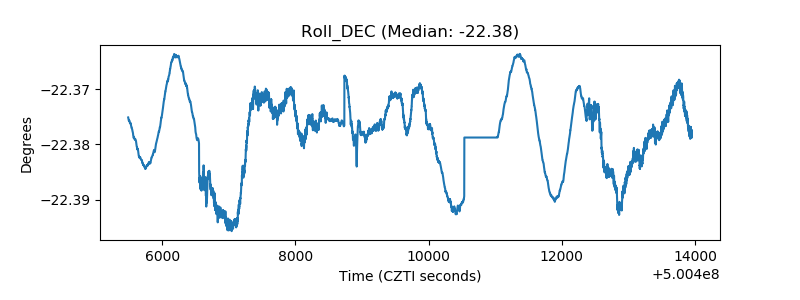 |
| _Roll_RA | 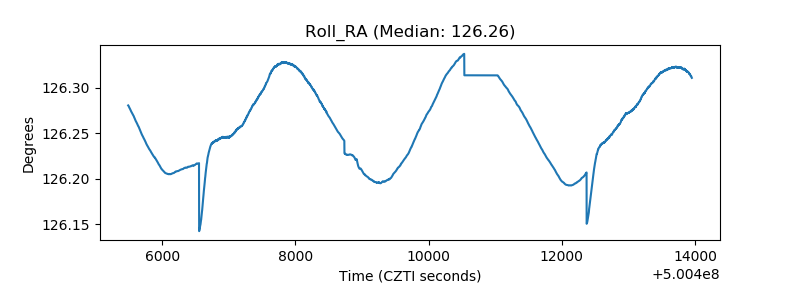 |
| Veto Counter | 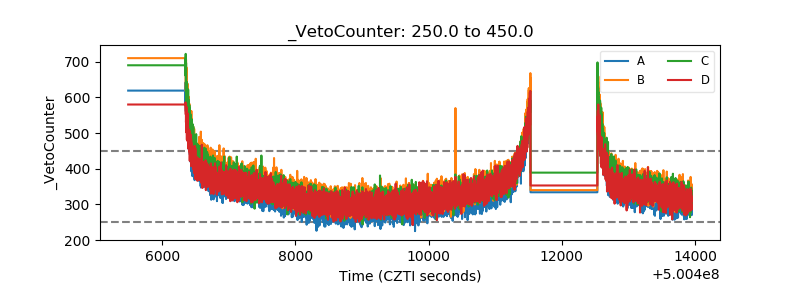 |