| Param | Original file | Final file |
|---|---|---|
| Filename | modeM0/AS1A14_103T01_9000006524_54737cztM0_level2.fits | modeM0/AS1A14_103T01_9000006524_54737cztM0_level2_quad_clean.evt |
| Size (bytes) | 564,327,360 | 106,197,120 |
| Size | 538.2 MB | 101.3 MB |
| Events in quadrant A | 3,547,007 | 715,704 |
| Events in quadrant B | 4,219,117 | 756,759 |
| Events in quadrant C | 6,039,815 | 625,021 |
| Events in quadrant D | 6,496,902 | 592,338 |
| Mode SS | |||
|---|---|---|---|
| Quadrant | BADHDUFLAG | Total packets | Discarded packets |
| A | 0 | 156 | 0 |
| B | 0 | 156 | 0 |
| C | 0 | 156 | 0 |
| D | 0 | 156 | 0 |
| Mode M0 | |||
|---|---|---|---|
| Quadrant | BADHDUFLAG | Total packets | Discarded packets |
| A | 0 | 16172 | 3 |
| B | 0 | 18038 | 3 |
| C | 0 | 23488 | 3 |
| D | 0 | 24577 | 8 |
| Mode M9 | |||
|---|---|---|---|
| Quadrant | BADHDUFLAG | Total packets | Discarded packets |
| A | 0 | 16 | 0 |
| B | 0 | 16 | 0 |
| C | 0 | 16 | 0 |
| D | 0 | 16 | 0 |
| Quadrant | Total seconds | Saturated seconds | Saturation percentage |
|---|---|---|---|
| A | 7551 | 125 | 1.655410% |
| B | 7552 | 267 | 3.535487% |
| C | 7552 | 898 | 11.890890% |
| D | 7551 | 727 | 9.627864% |
Noise dominated data is calculated using 1-second bins in cleaned event files. If a bin has >2000 counts, and if more than 50% of those come from <1% of pixels, then it is considered to be noise-dominated and hence unusable.
| Quadrant | # 1 sec bins | Bins with >0 counts | Bins with >2000 counts | High rate bins dominated by noise | Noise dominated (total time) | Noise dominated (detector-on time) | Marked lightcurve |
|---|---|---|---|---|---|---|---|
| A | 9176 | 7554 | 15 | 15 | 0.16% | 0.20% | 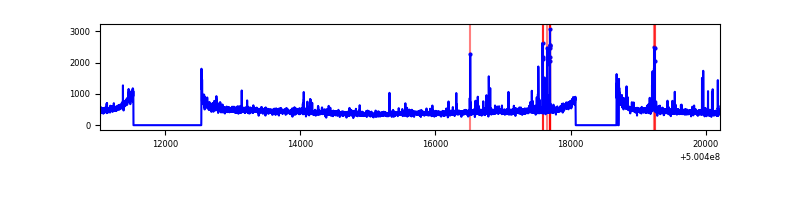 |
| B | 9177 | 7554 | 50 | 50 | 0.54% | 0.66% | 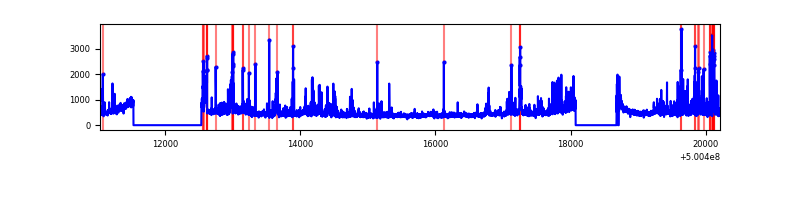 |
| C | 9177 | 7555 | 843 | 843 | 9.19% | 11.16% | 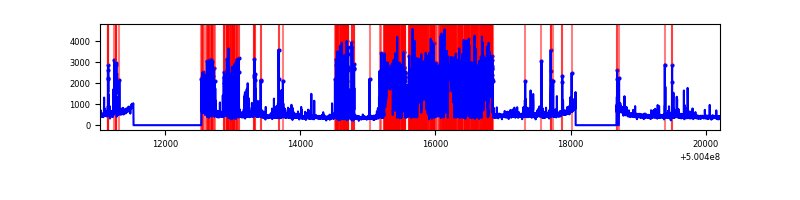 |
| D | 9175 | 7552 | 617 | 617 | 6.72% | 8.17% | 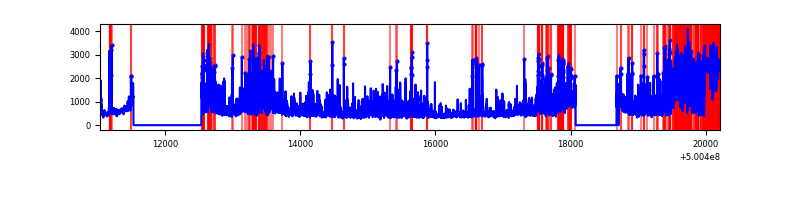 |
Top three noisy pixels from each quadrant. If the there are fewer than three noisy pixels in the level2.evt file, extra rows are filled as -1
| Pixel properties | Quadrant properties | ||||||
|---|---|---|---|---|---|---|---|
| Quadrant | DetID | PixID | Counts | Sigma | Mean | Median | Sigma |
| A | 3 | 14 | 123579 | 601.78 | 824 | 803 | 204.0 |
| A | 0 | 8 | 82164 | 398.79 | 824 | 803 | 204.0 |
| A | 8 | 246 | 41821 | 201.05 | 824 | 803 | 204.0 |
| B | 2 | 249 | 202586 | 1160.26 | 809 | 779 | 173.9 |
| B | 5 | 185 | 191985 | 1099.31 | 809 | 779 | 173.9 |
| B | 0 | 173 | 188408 | 1078.74 | 809 | 779 | 173.9 |
| C | 4 | 5 | 2121280 | 10150.94 | 765 | 760 | 208.9 |
| C | 1 | 16 | 368707 | 1761.36 | 765 | 760 | 208.9 |
| C | 6 | 223 | 189730 | 904.6 | 765 | 760 | 208.9 |
| D | 11 | 129 | 1439043 | 6613.49 | 766 | 733 | 217.5 |
| D | 15 | 94 | 951670 | 4372.5 | 766 | 733 | 217.5 |
| D | 3 | 12 | 403456 | 1851.76 | 766 | 733 | 217.5 |
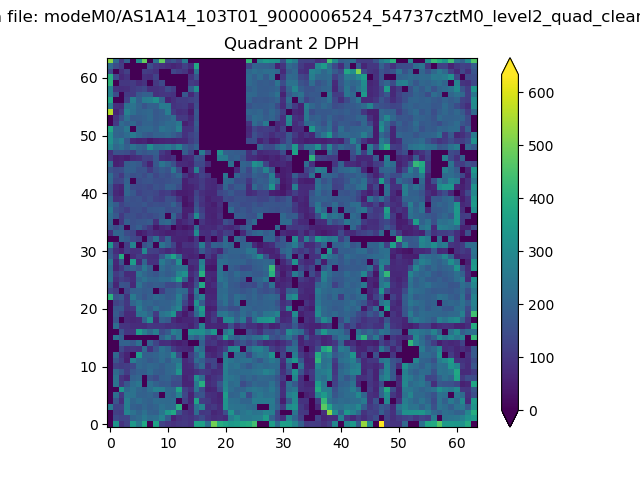
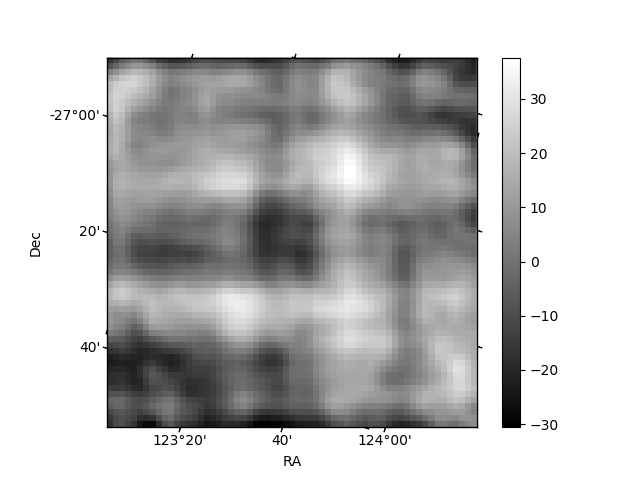
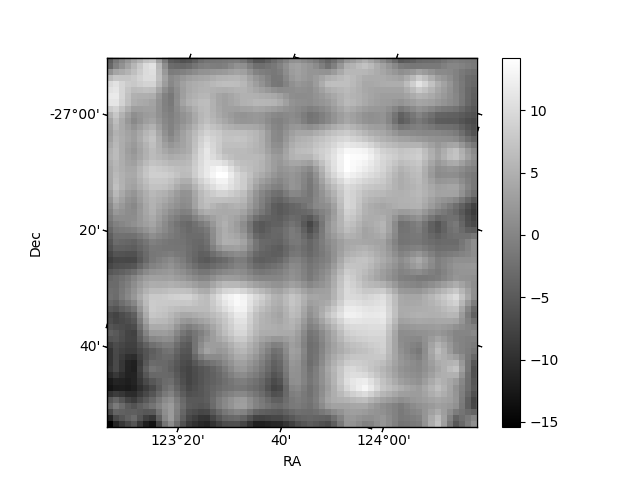
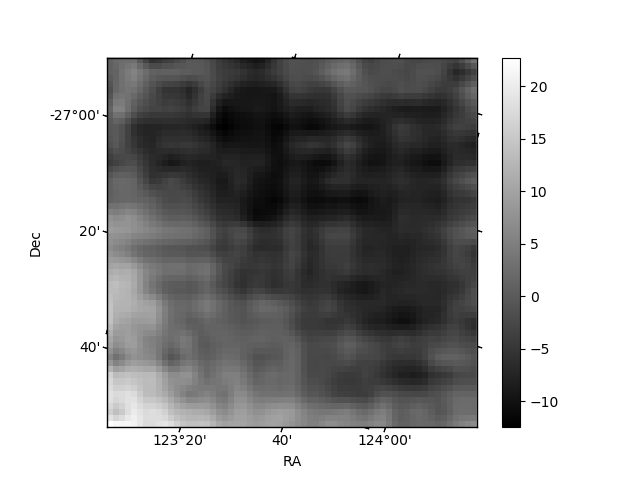
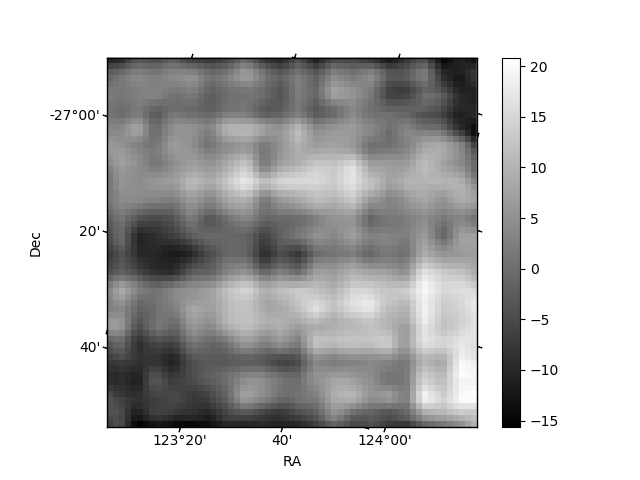
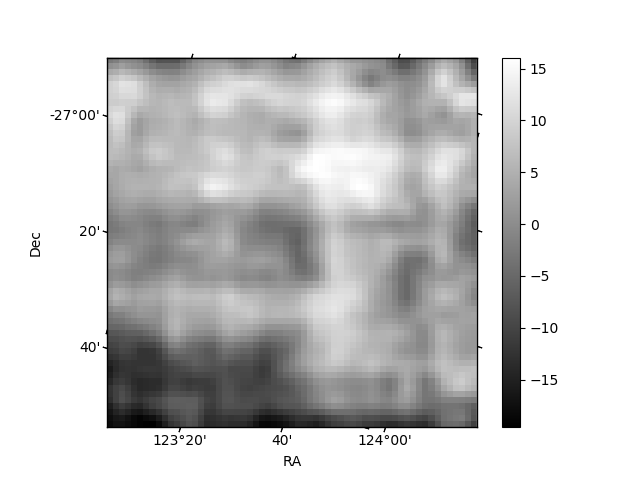
Histogram calculated using DETX and DETY for each event in the final _common_clean file
| Quadrant A | 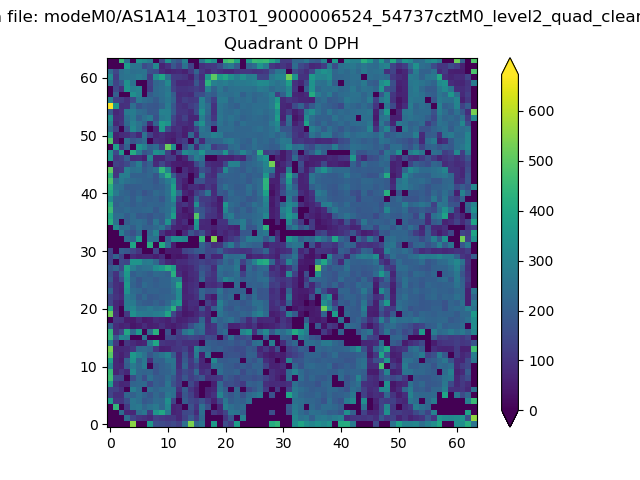 |
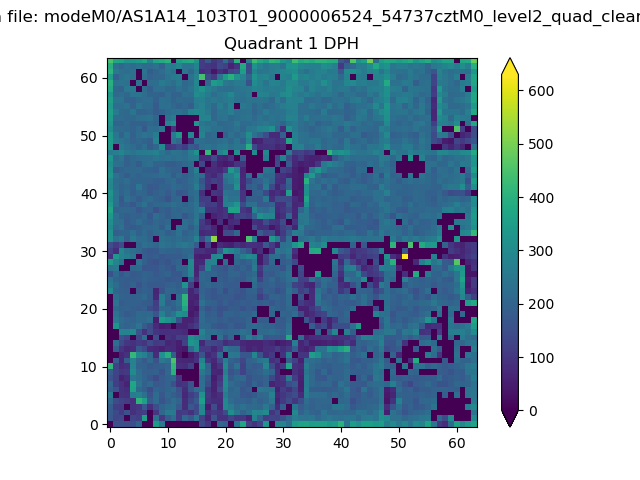 |
Quadrant B |
|---|---|---|---|
| Quadrant D | 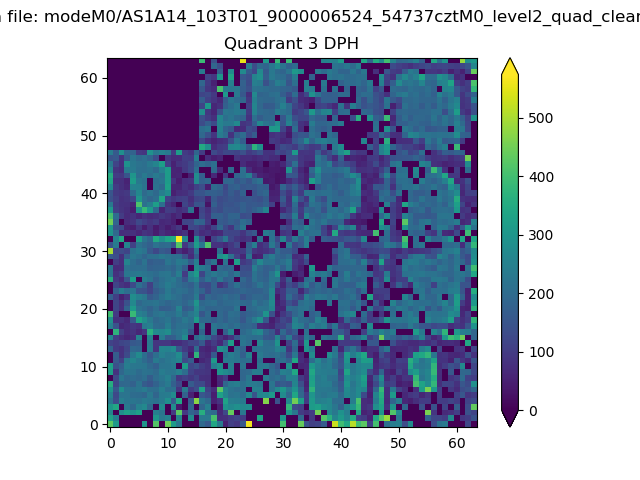 |
 |
Quadrant C |
| Plot type | Count rate plots | Images |
|---|---|---|
| Comparison with Poisson distribution Blue bars denote a histogram of data divided into 1 sec bins. Red curve is a Poisson curve with rate = median count rate of data. |
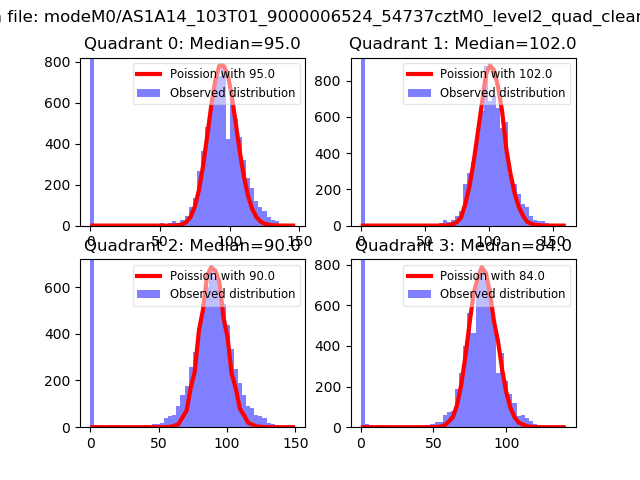 |
 |
| Quadrant-wise count rates Data is divided into 100 sec bins |
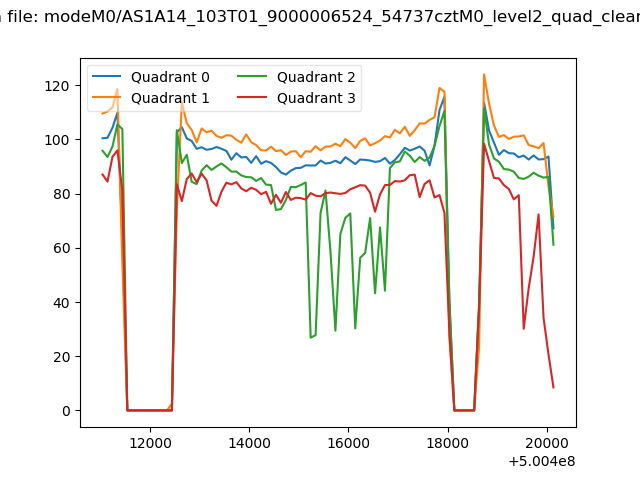 |
|
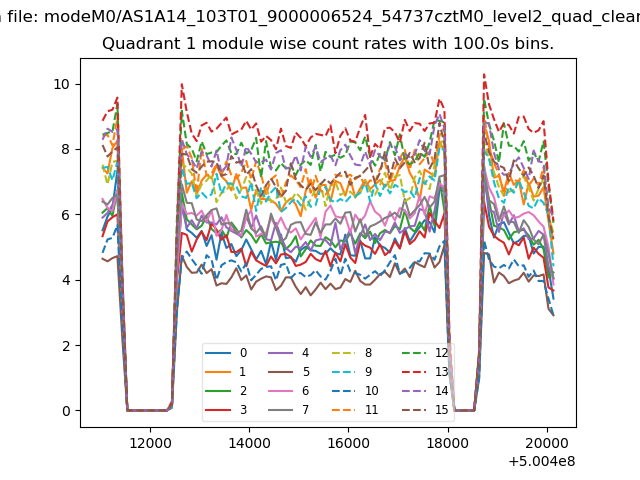
| Module-wise count rates for Quadrant A Data is divided into 100 sec bins |
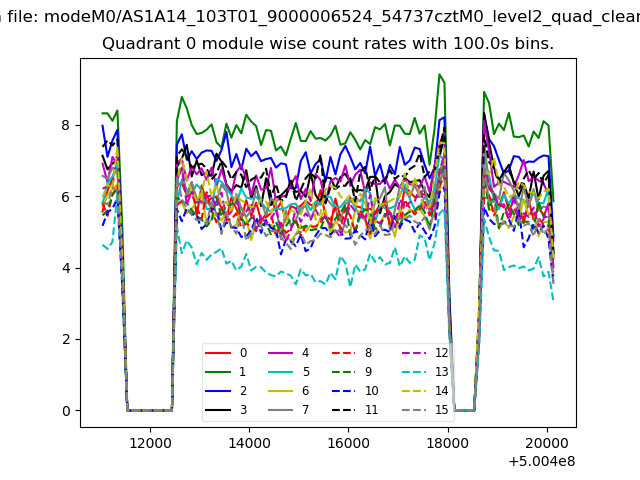 |
 |
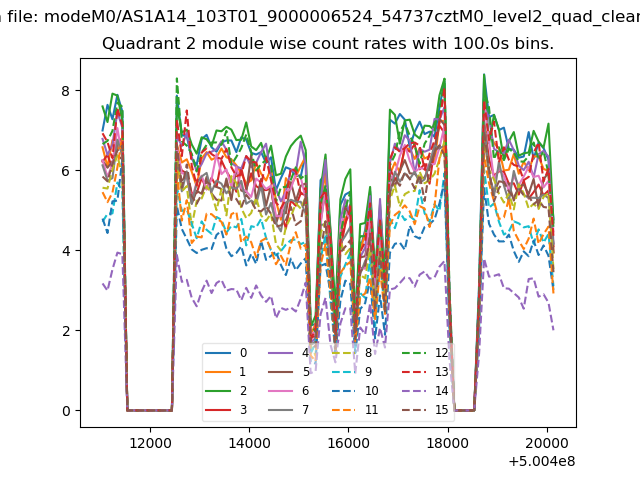
| Module-wise count rates for Quadrant B Data is divided into 100 sec bins |
 |
 |
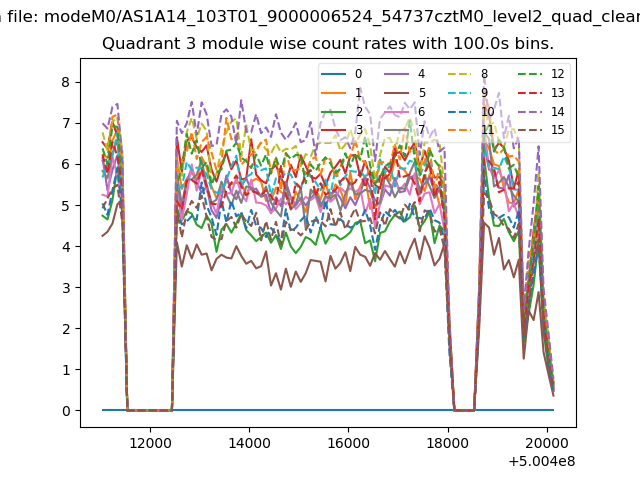
| Module-wise count rates for Quadrant C Data is divided into 100 sec bins |
 |
 |
| Module-wise count rates for Quadrant D Data is divided into 100 sec bins |
 |
 |
| Parameter | Plot |
|---|---|
| CZT HV Monitor | 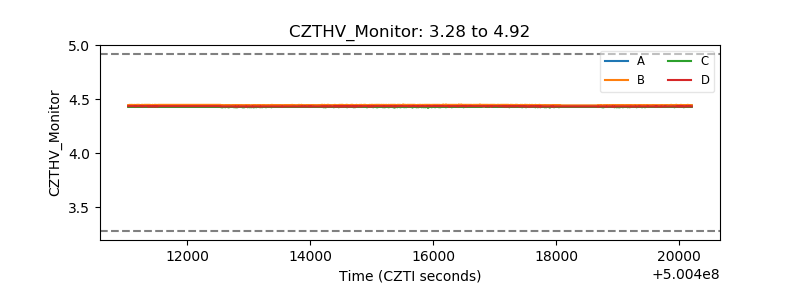 |
| D_VDD | 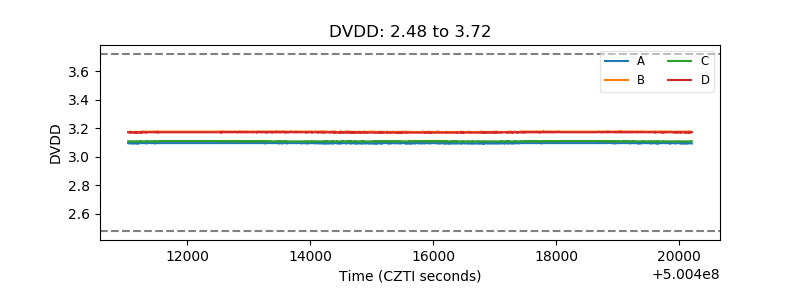 |
| Temperature 1 | 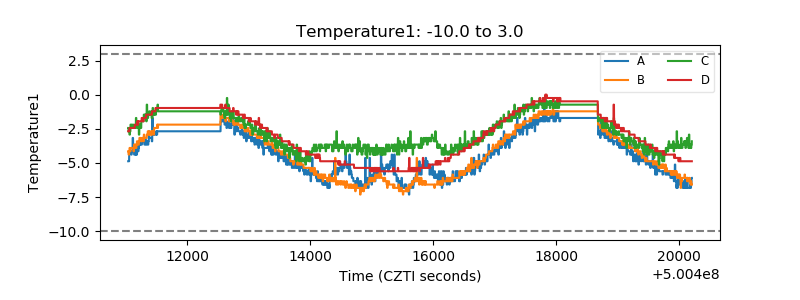 |
| Veto HV Monitor | 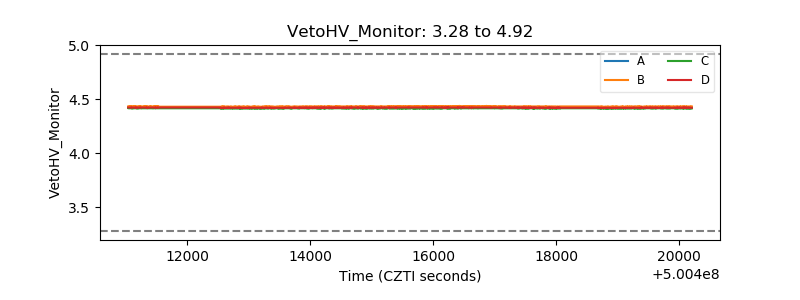 |
| Veto LLD | 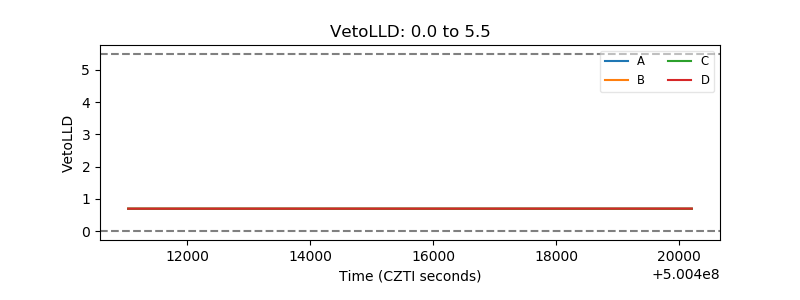 |
| Alpha Counter | 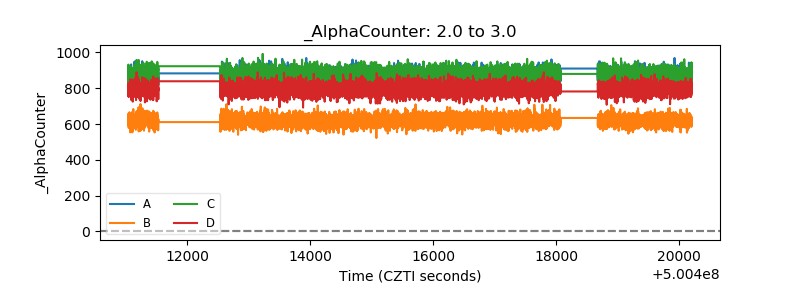 |
| _CPM_Rate | 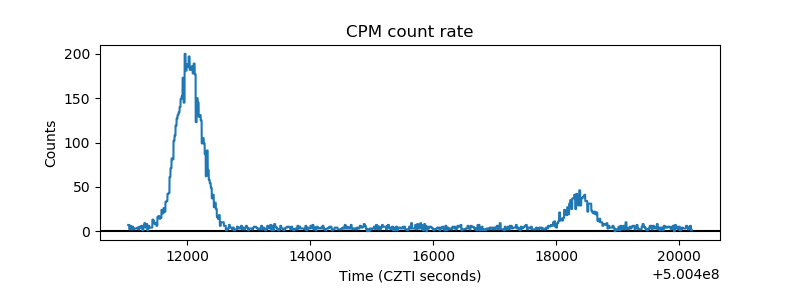 |
| CZT Counter | 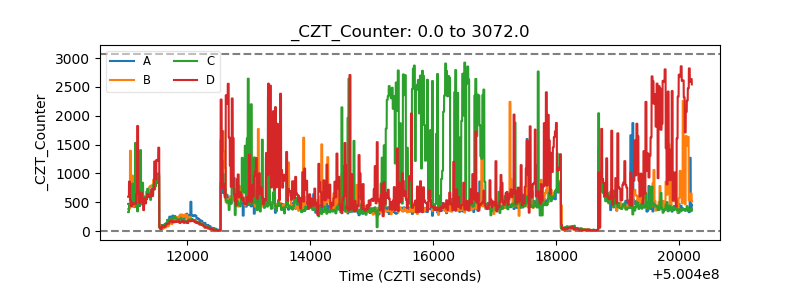 |
| +2.5 Volts monitor |  |
| +5 Volts monitor |  |
| _ROLL_ROT | 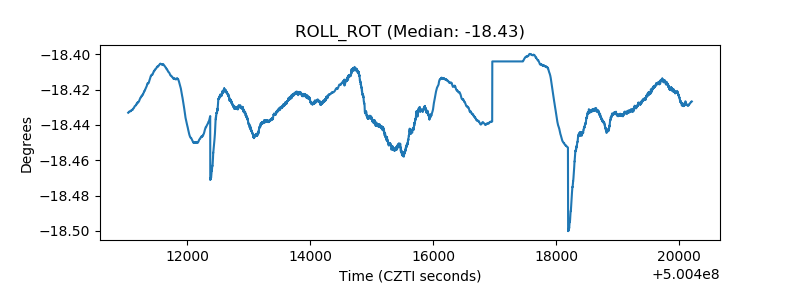 |
| _Roll_DEC | 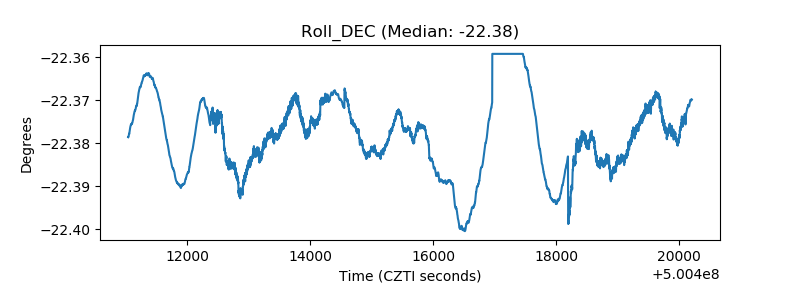 |
| _Roll_RA | 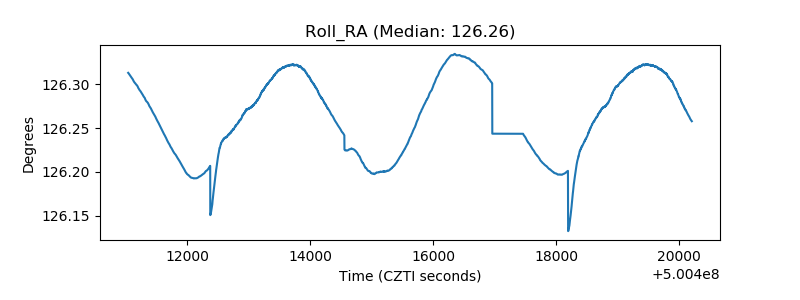 |
| Veto Counter | 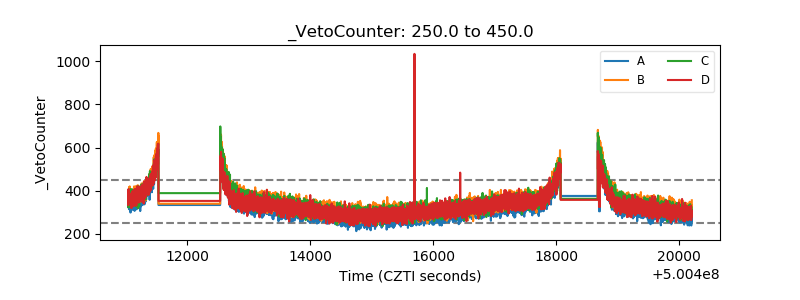 |