| Param | Original file | Final file |
|---|---|---|
| Filename | modeM0/AS1A14_103T01_9000006524_54738cztM0_level2.fits | modeM0/AS1A14_103T01_9000006524_54738cztM0_level2_quad_clean.evt |
| Size (bytes) | 747,354,240 | 112,970,880 |
| Size | 712.7 MB | 107.7 MB |
| Events in quadrant A | 4,071,497 | 800,707 |
| Events in quadrant B | 6,627,424 | 805,395 |
| Events in quadrant C | 4,502,211 | 742,092 |
| Events in quadrant D | 11,803,434 | 481,298 |
| Mode SS | |||
|---|---|---|---|
| Quadrant | BADHDUFLAG | Total packets | Discarded packets |
| A | 0 | 174 | 0 |
| B | 0 | 174 | 0 |
| C | 0 | 174 | 0 |
| D | 0 | 174 | 0 |
| Mode M0 | |||
|---|---|---|---|
| Quadrant | BADHDUFLAG | Total packets | Discarded packets |
| A | 0 | 18446 | 2 |
| B | 0 | 25623 | 2 |
| C | 0 | 19919 | 2 |
| D | 0 | 41050 | 2 |
| Mode M9 | |||
|---|---|---|---|
| Quadrant | BADHDUFLAG | Total packets | Discarded packets |
| A | 0 | 6 | 0 |
| B | 0 | 6 | 0 |
| C | 0 | 6 | 0 |
| D | 0 | 6 | 0 |
| Quadrant | Total seconds | Saturated seconds | Saturation percentage |
|---|---|---|---|
| A | 8503 | 73 | 0.858521% |
| B | 8503 | 732 | 8.608726% |
| C | 8503 | 334 | 3.928025% |
| D | 8504 | 3033 | 35.665569% |
Noise dominated data is calculated using 1-second bins in cleaned event files. If a bin has >2000 counts, and if more than 50% of those come from <1% of pixels, then it is considered to be noise-dominated and hence unusable.
| Quadrant | # 1 sec bins | Bins with >0 counts | Bins with >2000 counts | High rate bins dominated by noise | Noise dominated (total time) | Noise dominated (detector-on time) | Marked lightcurve |
|---|---|---|---|---|---|---|---|
| A | 9123 | 8505 | 22 | 22 | 0.24% | 0.26% | 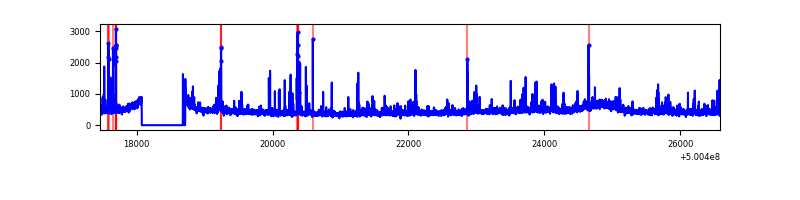 |
| B | 9123 | 8505 | 570 | 570 | 6.25% | 6.70% | 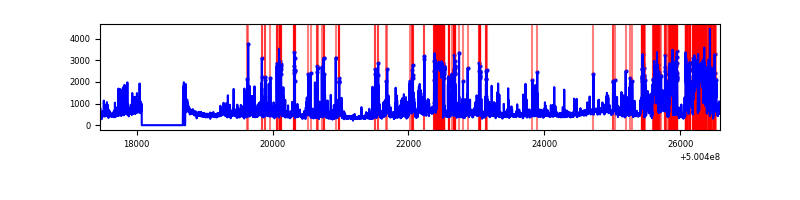 |
| C | 9123 | 8505 | 119 | 119 | 1.30% | 1.40% | 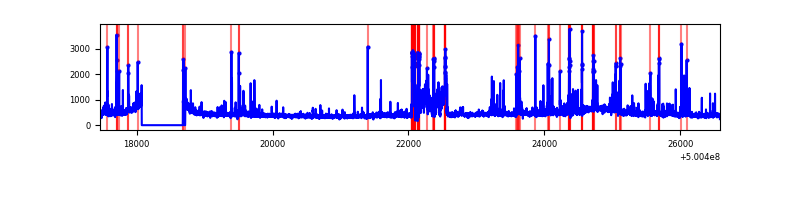 |
| D | 9124 | 8505 | 2715 | 2715 | 29.76% | 31.92% | 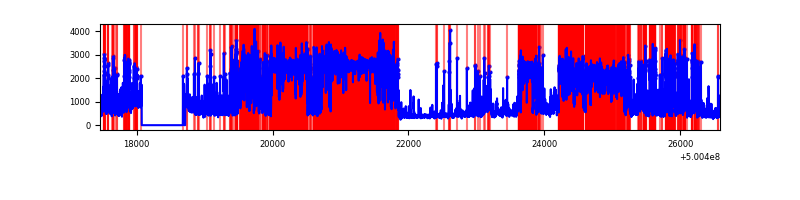 |
Top three noisy pixels from each quadrant. If the there are fewer than three noisy pixels in the level2.evt file, extra rows are filled as -1
| Pixel properties | Quadrant properties | ||||||
|---|---|---|---|---|---|---|---|
| Quadrant | DetID | PixID | Counts | Sigma | Mean | Median | Sigma |
| A | 0 | 8 | 168463 | 741.35 | 916 | 894 | 226.0 |
| A | 4 | 206 | 98287 | 430.88 | 916 | 894 | 226.0 |
| A | 3 | 14 | 86291 | 377.81 | 916 | 894 | 226.0 |
| B | 2 | 249 | 2106310 | 10978.21 | 884 | 851 | 191.8 |
| B | 0 | 173 | 364836 | 1897.88 | 884 | 851 | 191.8 |
| B | 5 | 185 | 252683 | 1313.09 | 884 | 851 | 191.8 |
| C | 4 | 5 | 491480 | 2045.41 | 876 | 868 | 239.9 |
| C | 13 | 3 | 194861 | 808.78 | 876 | 868 | 239.9 |
| C | 15 | 219 | 84762 | 349.76 | 876 | 868 | 239.9 |
| D | 2 | 62 | 5453796 | 25159.54 | 763 | 728 | 216.7 |
| D | 11 | 129 | 1511239 | 6969.24 | 763 | 728 | 216.7 |
| D | 15 | 94 | 1477485 | 6813.51 | 763 | 728 | 216.7 |
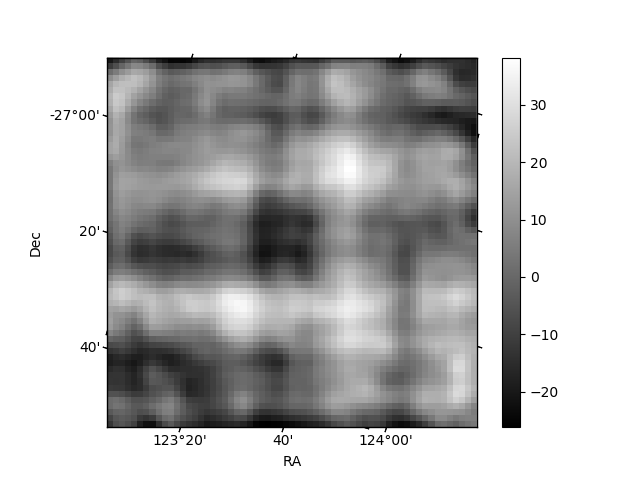
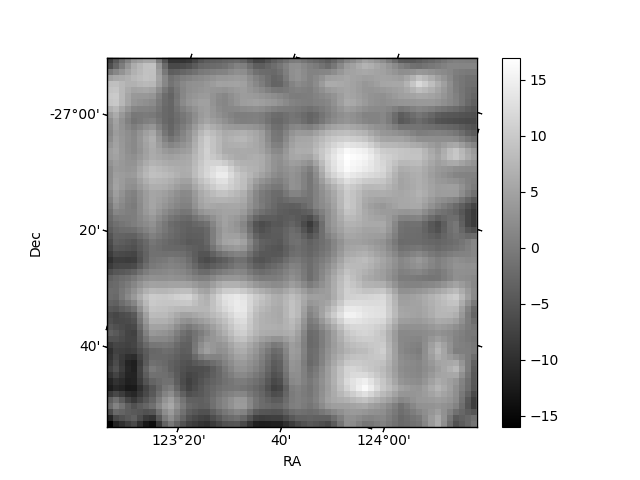
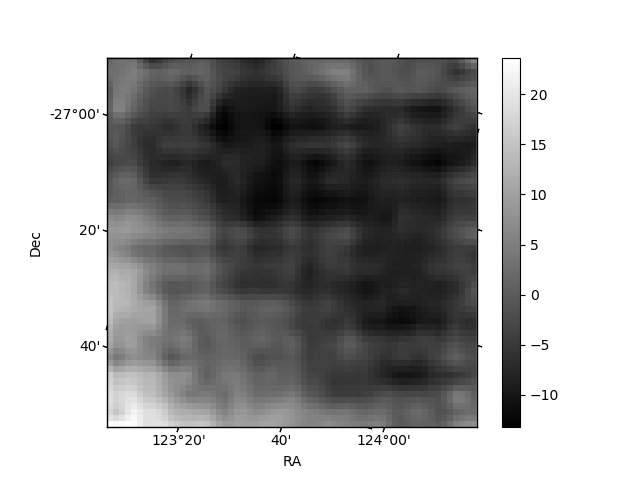
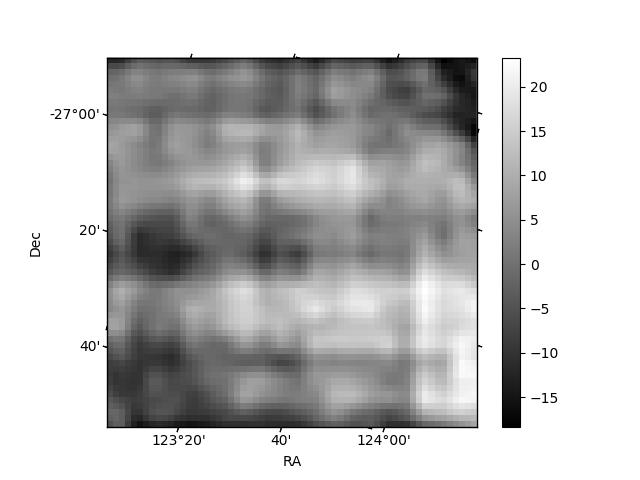
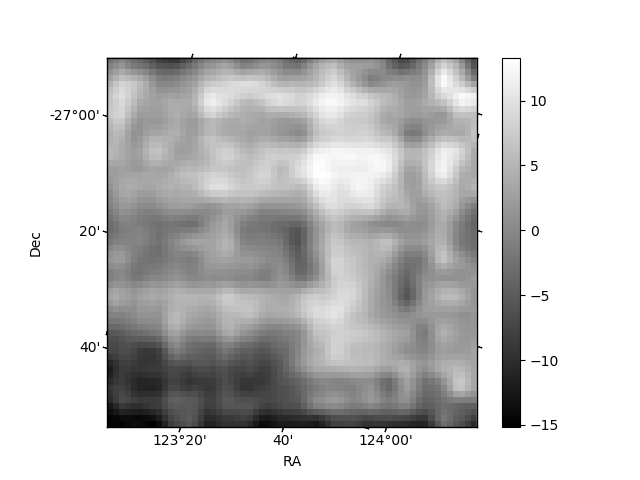
Histogram calculated using DETX and DETY for each event in the final _common_clean file
| Quadrant A | 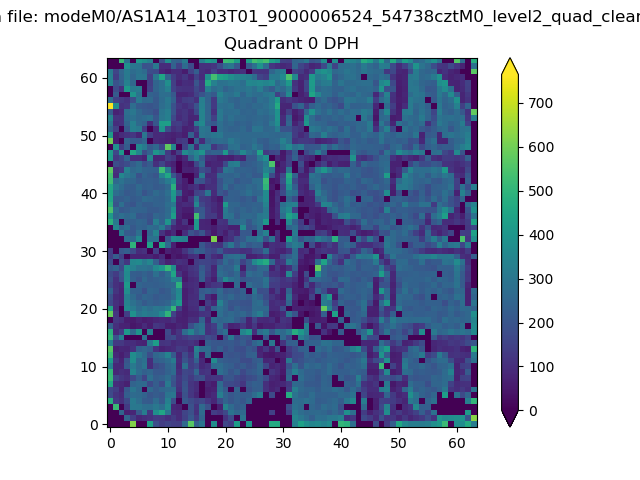 |
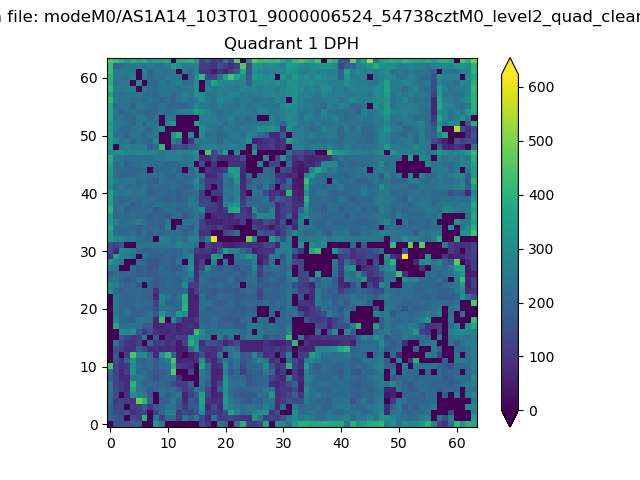 |
Quadrant B |
|---|---|---|---|
| Quadrant D | 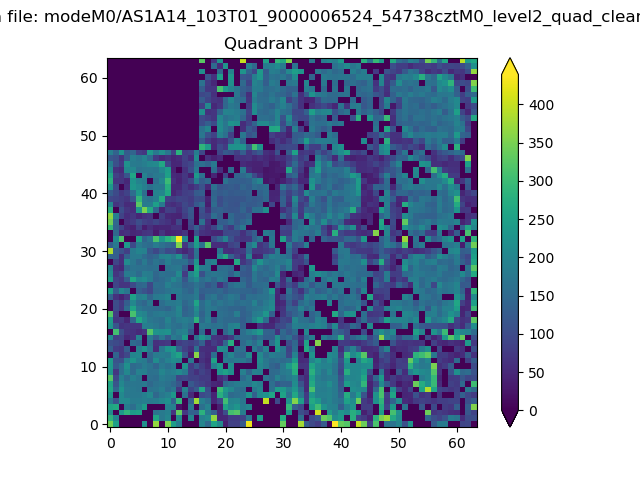 |
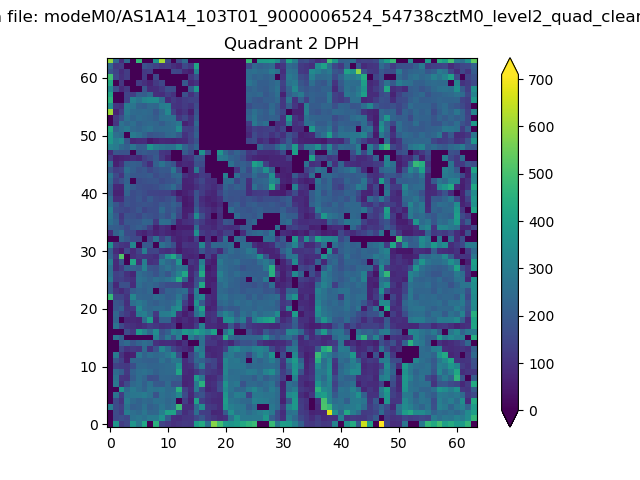 |
Quadrant C |
| Plot type | Count rate plots | Images |
|---|---|---|
| Comparison with Poisson distribution Blue bars denote a histogram of data divided into 1 sec bins. Red curve is a Poisson curve with rate = median count rate of data. |
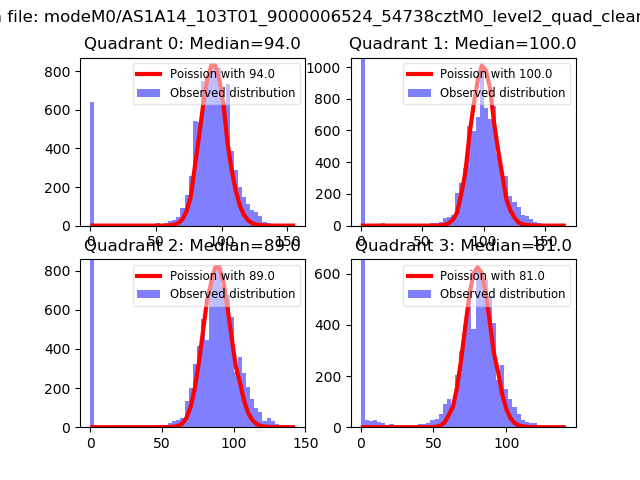 |
 |
| Quadrant-wise count rates Data is divided into 100 sec bins |
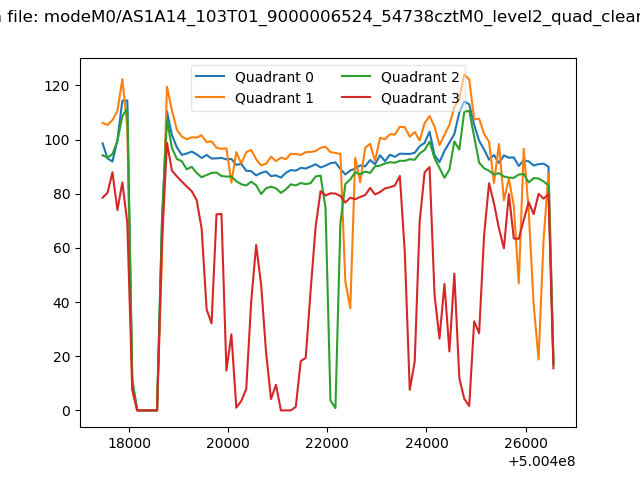 |
|
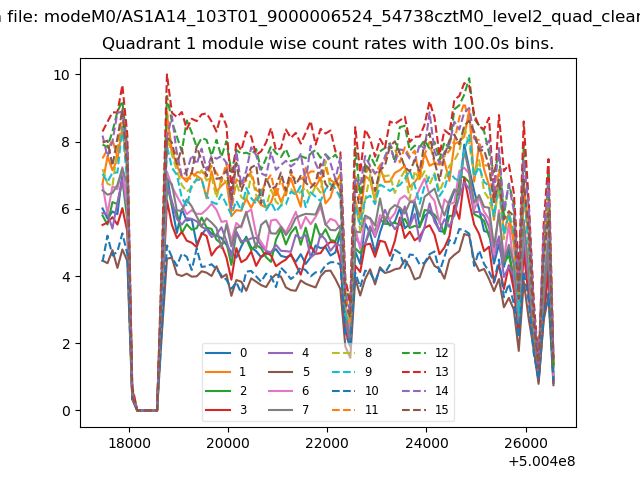
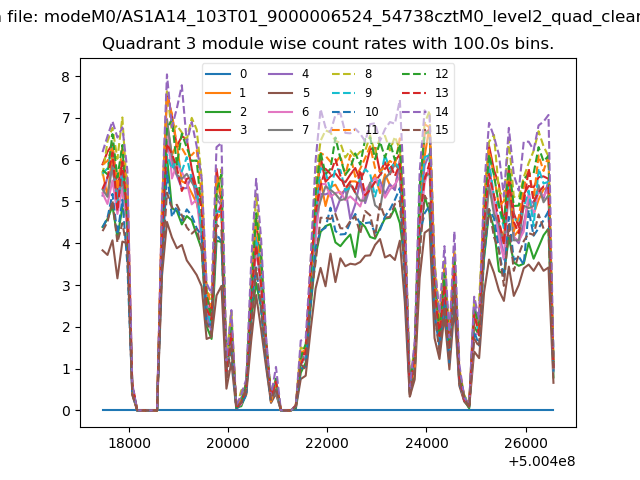
| Module-wise count rates for Quadrant A Data is divided into 100 sec bins |
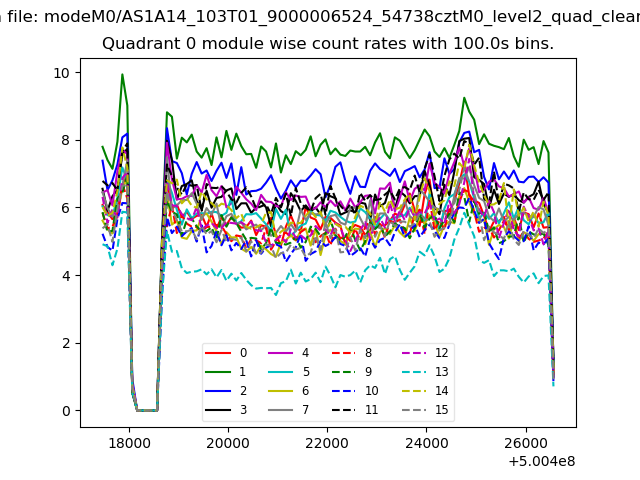 |
 |
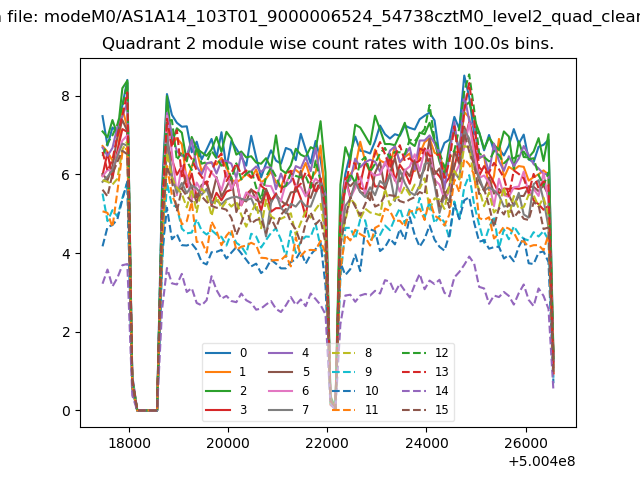
| Module-wise count rates for Quadrant B Data is divided into 100 sec bins |
 |
 |
| Module-wise count rates for Quadrant C Data is divided into 100 sec bins |
 |
 |
| Module-wise count rates for Quadrant D Data is divided into 100 sec bins |
 |
 |
| Parameter | Plot |
|---|---|
| CZT HV Monitor | 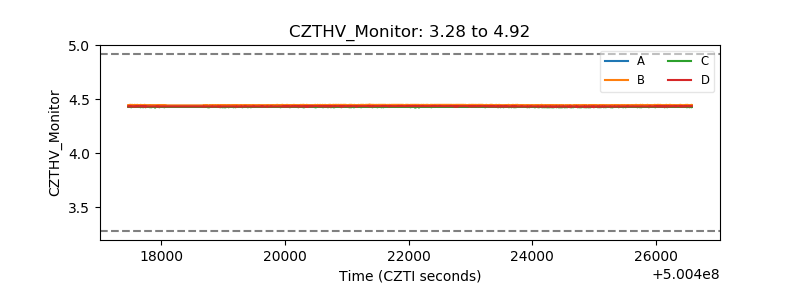 |
| D_VDD | 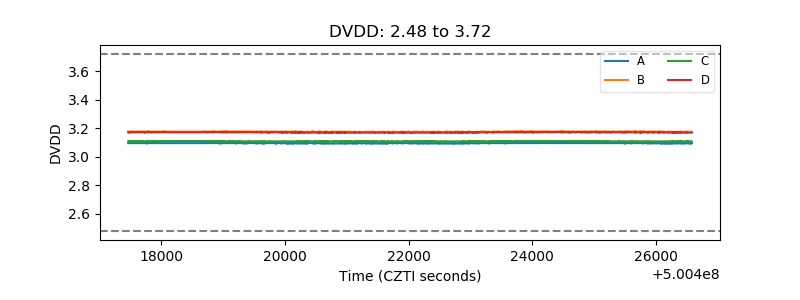 |
| Temperature 1 | 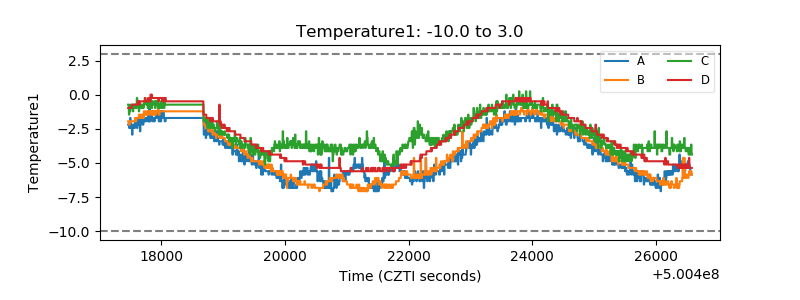 |
| Veto HV Monitor | 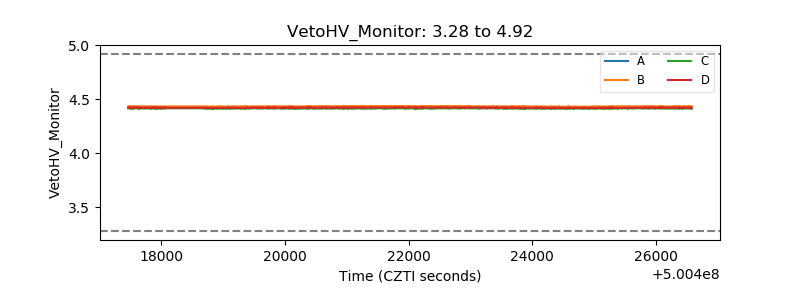 |
| Veto LLD | 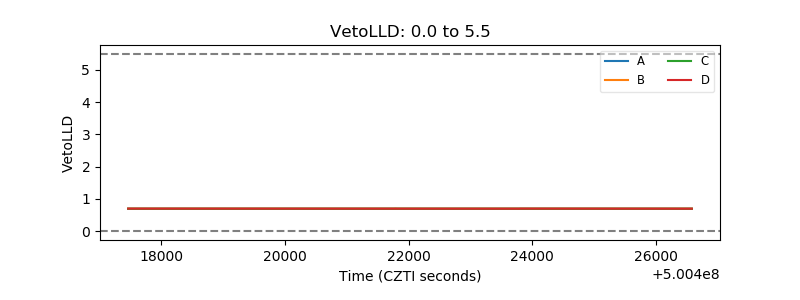 |
| Alpha Counter | 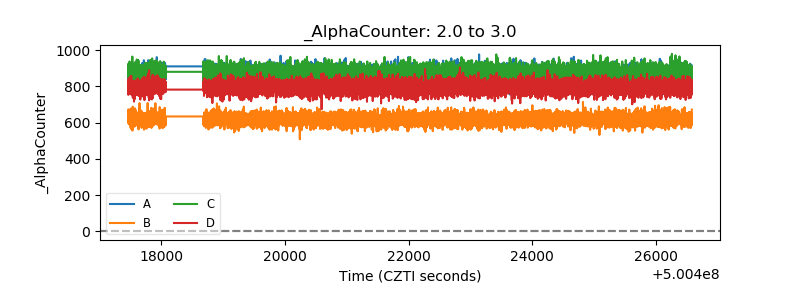 |
| _CPM_Rate | 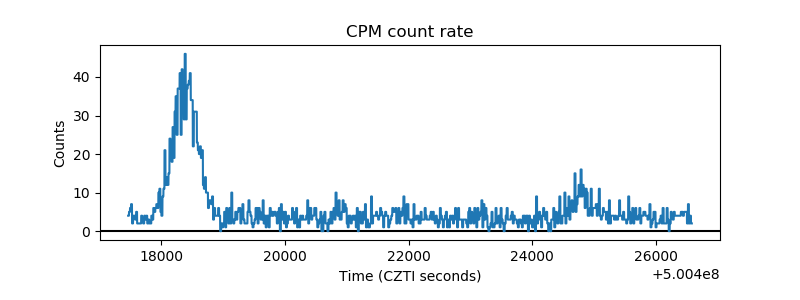 |
| CZT Counter | 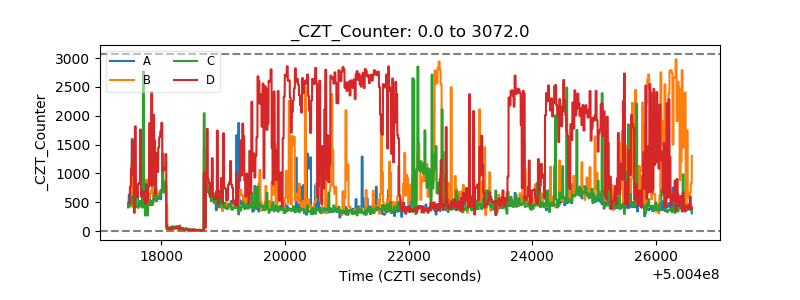 |
| +2.5 Volts monitor |  |
| +5 Volts monitor | 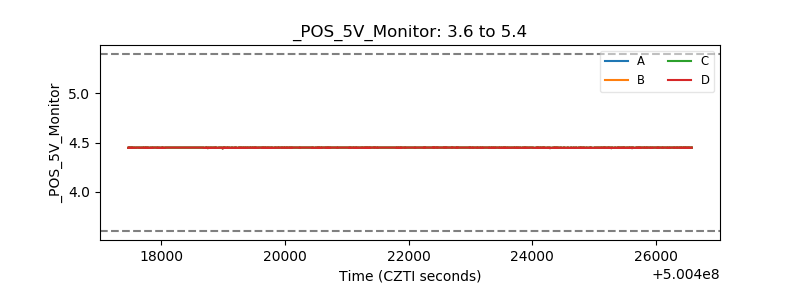 |
| _ROLL_ROT | 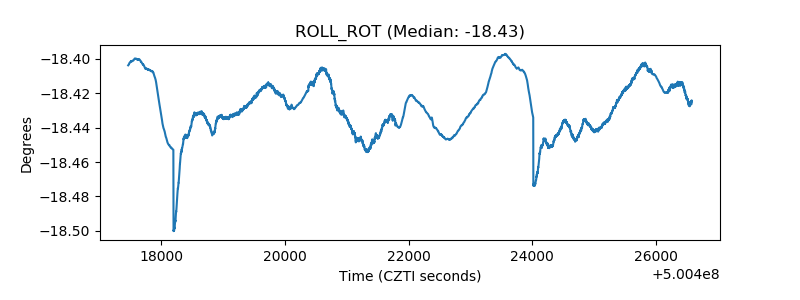 |
| _Roll_DEC |  |
| _Roll_RA | 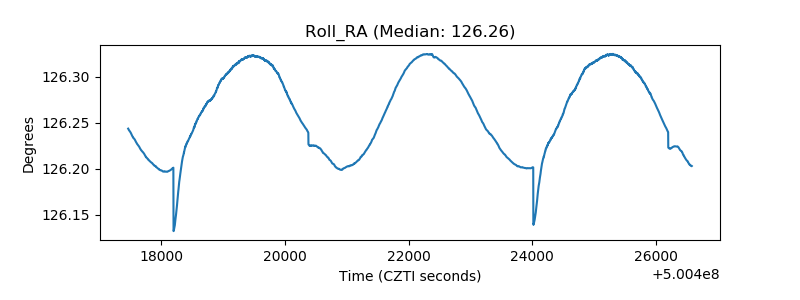 |
| Veto Counter | 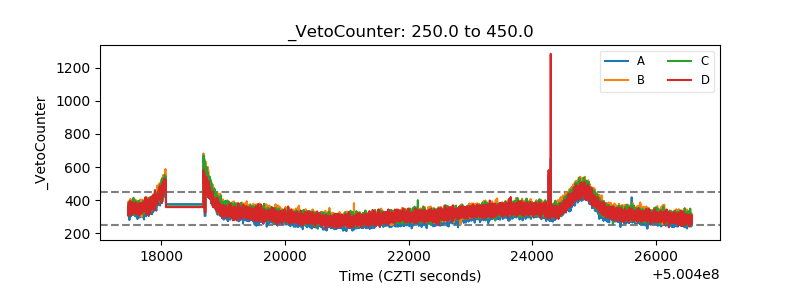 |