| Param | Original file | Final file |
|---|---|---|
| Filename | modeM0/AS1A14_103T01_9000006524_54739cztM0_level2.fits | modeM0/AS1A14_103T01_9000006524_54739cztM0_level2_quad_clean.evt |
| Size (bytes) | 692,648,640 | 108,466,560 |
| Size | 660.6 MB | 103.4 MB |
| Events in quadrant A | 4,066,025 | 747,134 |
| Events in quadrant B | 6,989,726 | 716,972 |
| Events in quadrant C | 4,324,351 | 703,997 |
| Events in quadrant D | 9,636,365 | 557,204 |
| Mode SS | |||
|---|---|---|---|
| Quadrant | BADHDUFLAG | Total packets | Discarded packets |
| A | 0 | 160 | 0 |
| B | 0 | 160 | 0 |
| C | 0 | 160 | 0 |
| D | 0 | 160 | 0 |
| Mode M0 | |||
|---|---|---|---|
| Quadrant | BADHDUFLAG | Total packets | Discarded packets |
| A | 0 | 17896 | 0 |
| B | 0 | 26449 | 0 |
| C | 0 | 18870 | 0 |
| D | 0 | 34394 | 0 |
| Quadrant | Total seconds | Saturated seconds | Saturation percentage |
|---|---|---|---|
| A | 8043 | 22 | 0.273530% |
| B | 8043 | 995 | 12.371006% |
| C | 8044 | 129 | 1.603680% |
| D | 8044 | 1552 | 19.293884% |
Noise dominated data is calculated using 1-second bins in cleaned event files. If a bin has >2000 counts, and if more than 50% of those come from <1% of pixels, then it is considered to be noise-dominated and hence unusable.
| Quadrant | # 1 sec bins | Bins with >0 counts | Bins with >2000 counts | High rate bins dominated by noise | Noise dominated (total time) | Noise dominated (detector-on time) | Marked lightcurve |
|---|---|---|---|---|---|---|---|
| A | 8043 | 8043 | 11 | 11 | 0.14% | 0.14% | 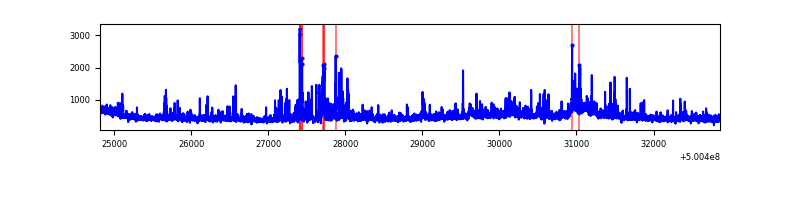 |
| B | 8043 | 8043 | 916 | 916 | 11.39% | 11.39% | 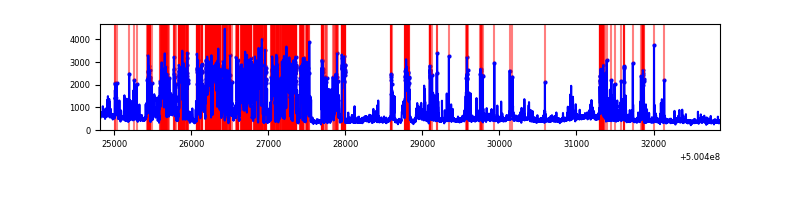 |
| C | 8044 | 8044 | 116 | 116 | 1.44% | 1.44% | 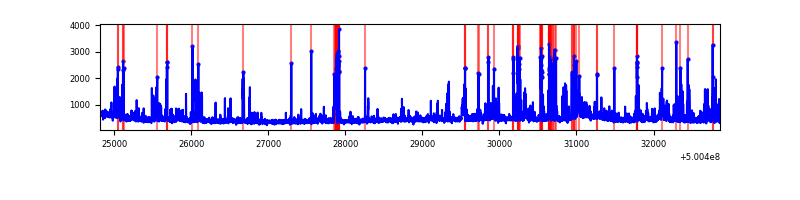 |
| D | 8044 | 8044 | 1526 | 1526 | 18.97% | 18.97% | 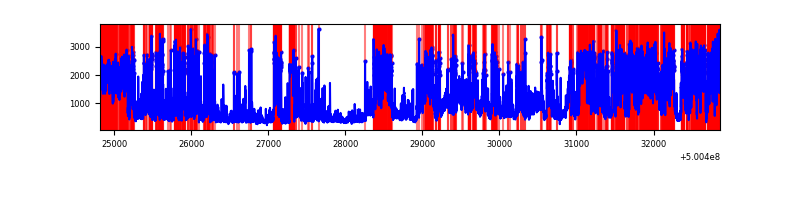 |
Top three noisy pixels from each quadrant. If the there are fewer than three noisy pixels in the level2.evt file, extra rows are filled as -1
| Pixel properties | Quadrant properties | ||||||
|---|---|---|---|---|---|---|---|
| Quadrant | DetID | PixID | Counts | Sigma | Mean | Median | Sigma |
| A | 0 | 8 | 250216 | 1200.25 | 833 | 813 | 207.8 |
| A | 3 | 14 | 240797 | 1154.92 | 833 | 813 | 207.8 |
| A | 4 | 206 | 98952 | 472.29 | 833 | 813 | 207.8 |
| B | 2 | 249 | 2700842 | 15484.37 | 800 | 771 | 174.4 |
| B | 0 | 173 | 513100 | 2938.1 | 800 | 771 | 174.4 |
| B | 5 | 185 | 181608 | 1037.06 | 800 | 771 | 174.4 |
| C | 15 | 219 | 253794 | 1128.98 | 813 | 804 | 224.1 |
| C | 14 | 254 | 222065 | 987.39 | 813 | 804 | 224.1 |
| C | 4 | 5 | 150111 | 666.29 | 813 | 804 | 224.1 |
| D | 2 | 62 | 3862618 | 18117.72 | 748 | 715 | 213.2 |
| D | 11 | 129 | 1022861 | 4795.29 | 748 | 715 | 213.2 |
| D | 3 | 12 | 901036 | 4223.76 | 748 | 715 | 213.2 |
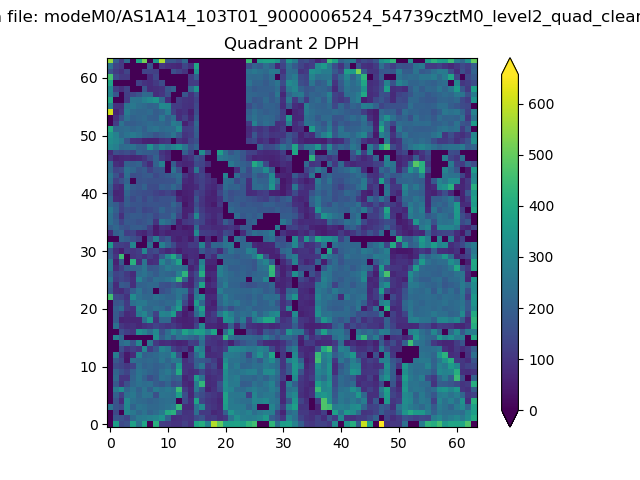
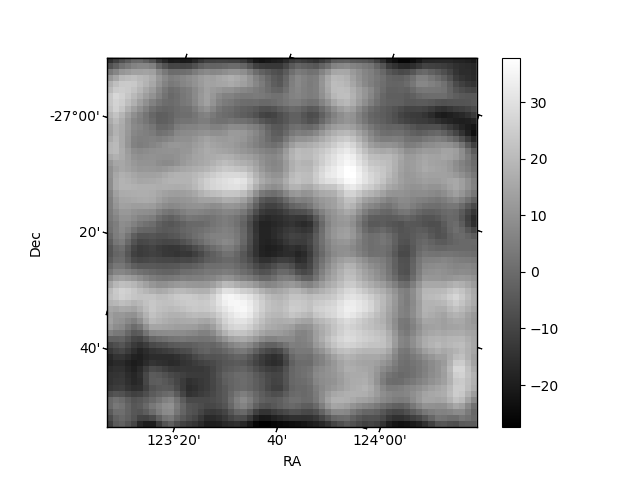
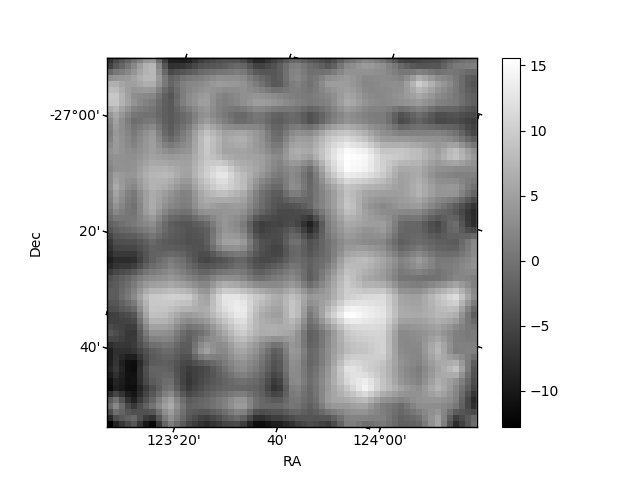
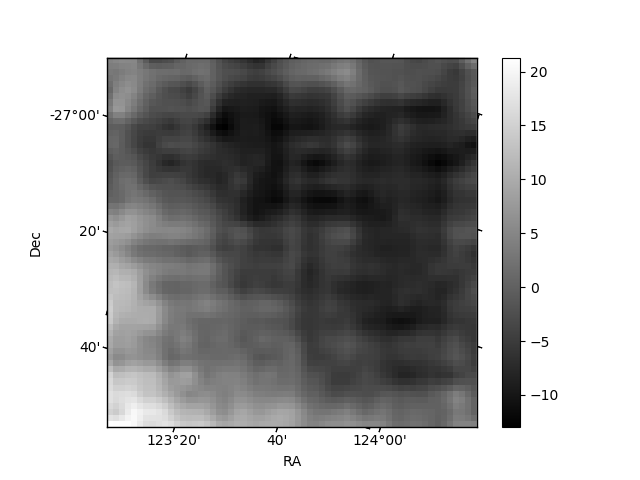
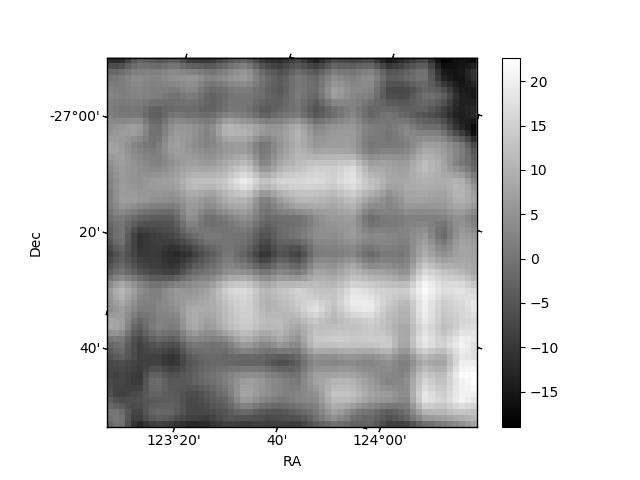
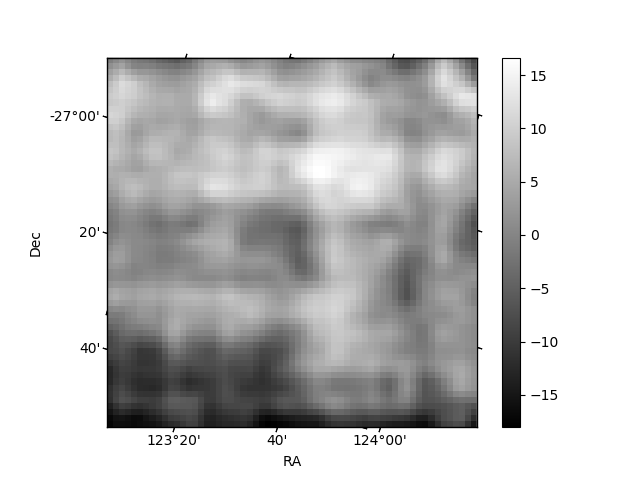
Histogram calculated using DETX and DETY for each event in the final _common_clean file
| Quadrant A | 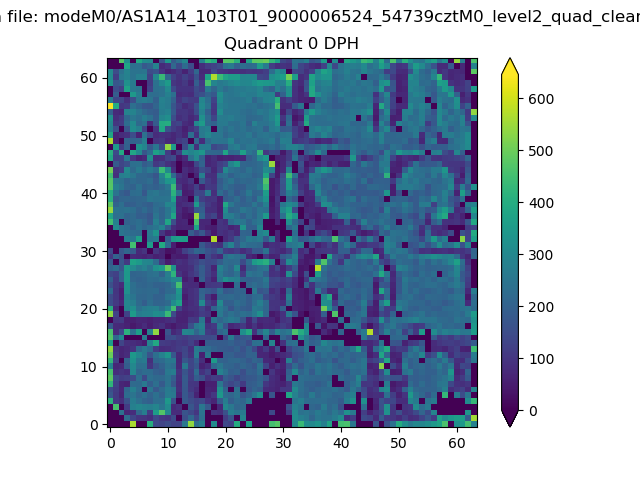 |
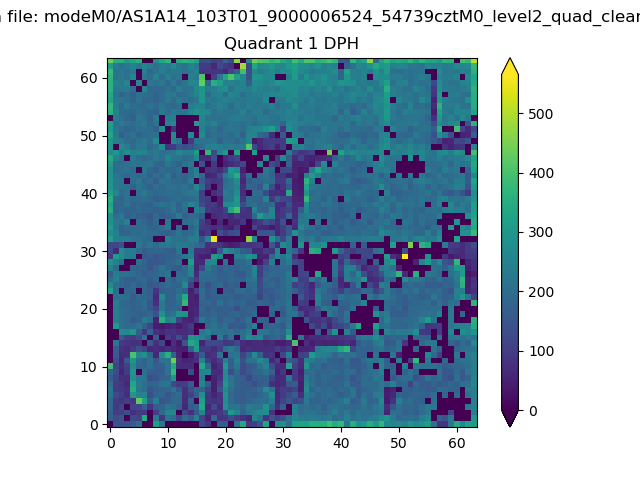 |
Quadrant B |
|---|---|---|---|
| Quadrant D | 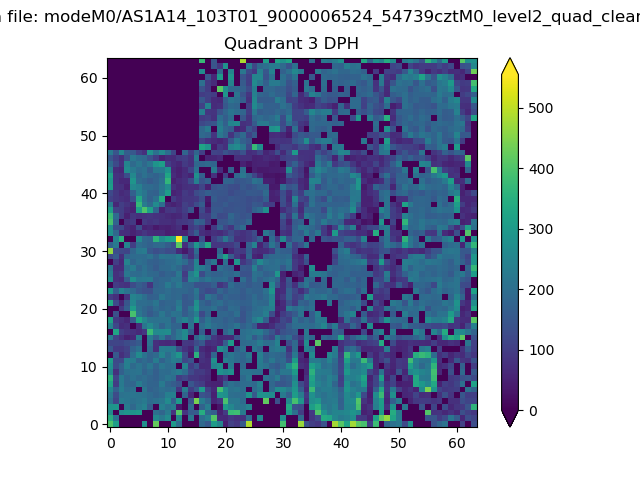 |
 |
Quadrant C |
| Plot type | Count rate plots | Images |
|---|---|---|
| Comparison with Poisson distribution Blue bars denote a histogram of data divided into 1 sec bins. Red curve is a Poisson curve with rate = median count rate of data. |
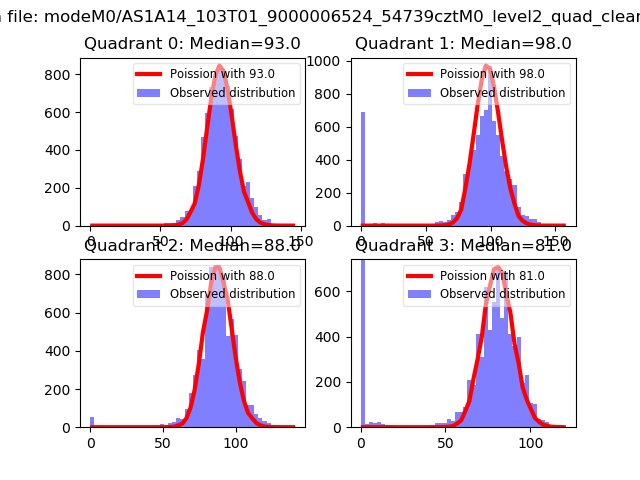 |
 |
| Quadrant-wise count rates Data is divided into 100 sec bins |
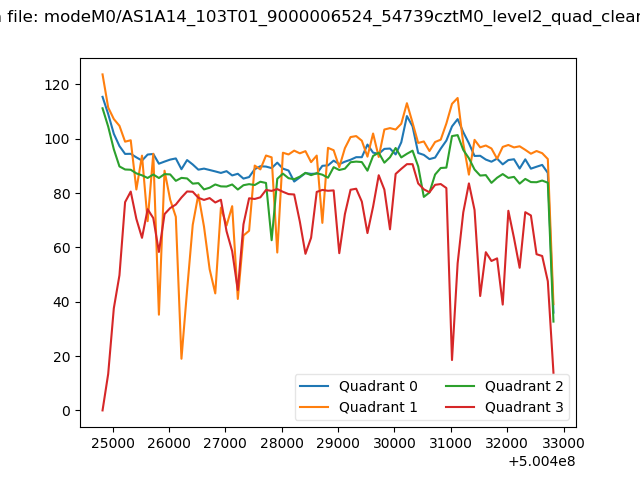 |
|
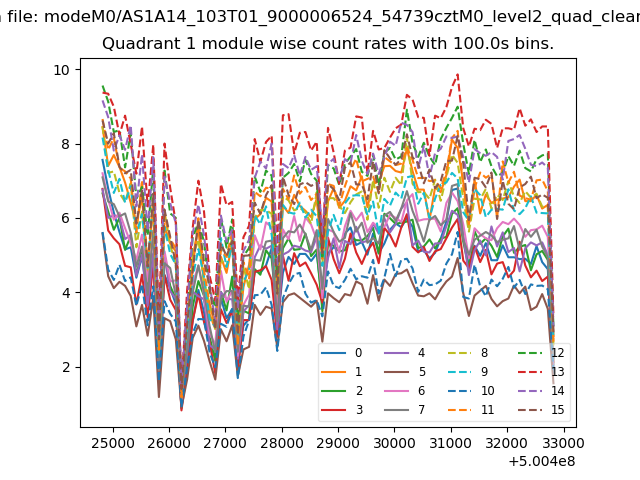
| Module-wise count rates for Quadrant A Data is divided into 100 sec bins |
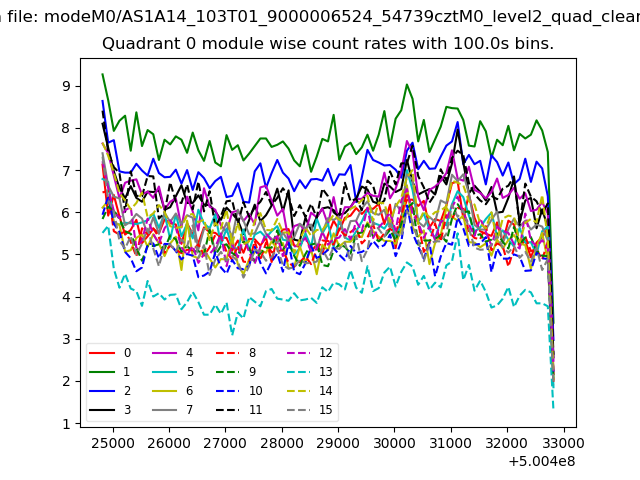 |
 |
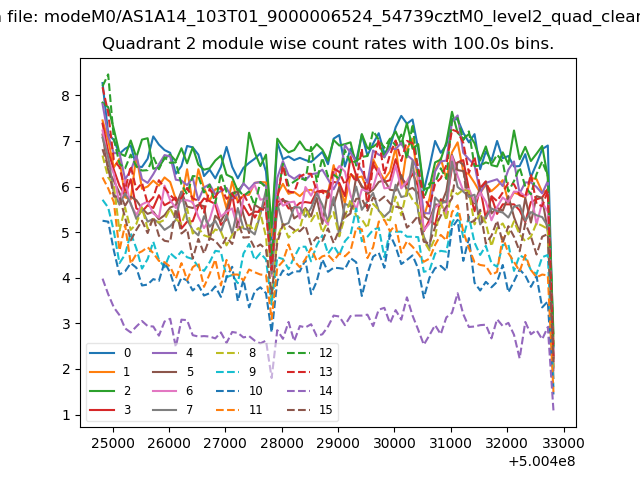
| Module-wise count rates for Quadrant B Data is divided into 100 sec bins |
 |
 |
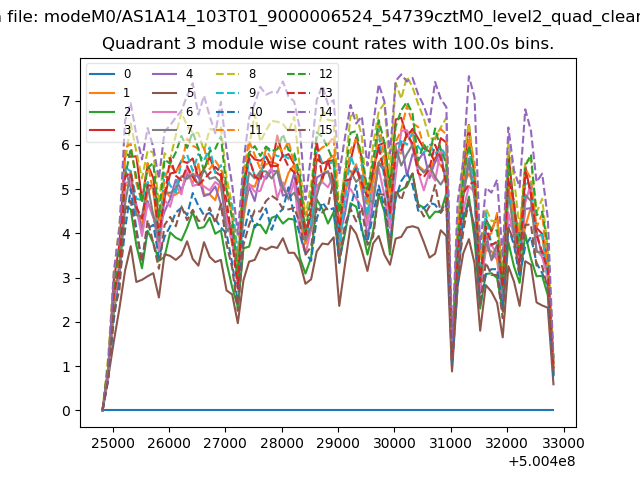
| Module-wise count rates for Quadrant C Data is divided into 100 sec bins |
 |
 |
| Module-wise count rates for Quadrant D Data is divided into 100 sec bins |
 |
 |
| Parameter | Plot |
|---|---|
| CZT HV Monitor | 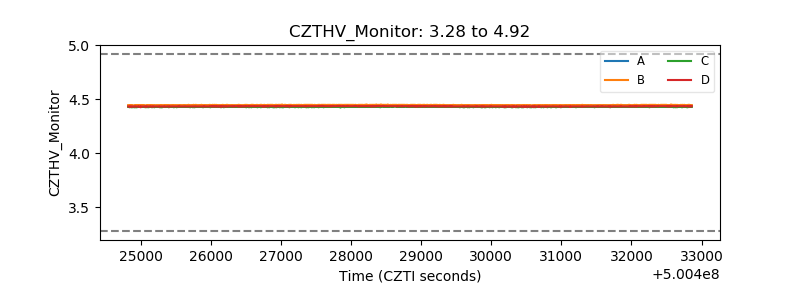 |
| D_VDD | 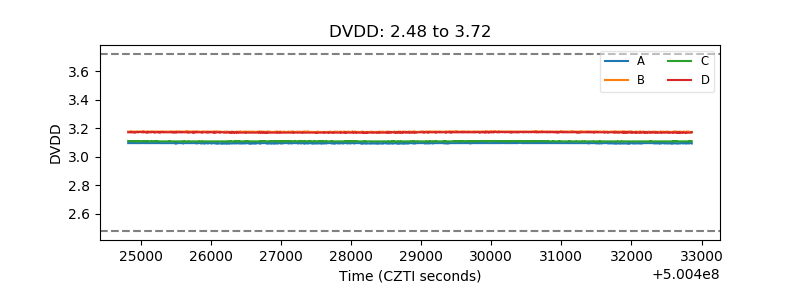 |
| Temperature 1 | 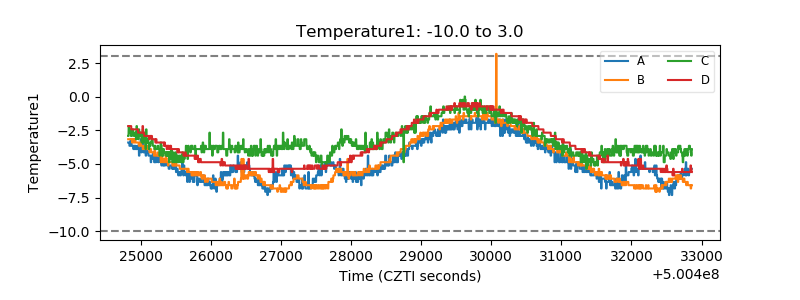 |
| Veto HV Monitor | 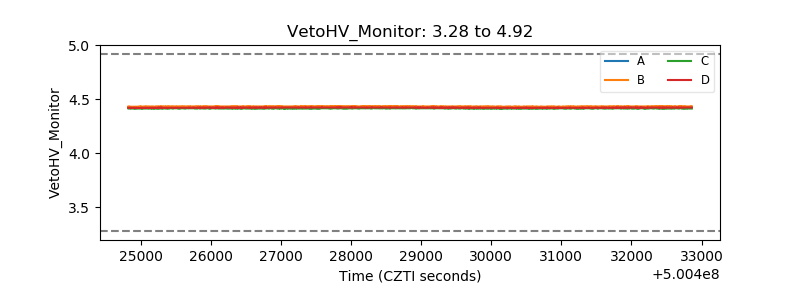 |
| Veto LLD | 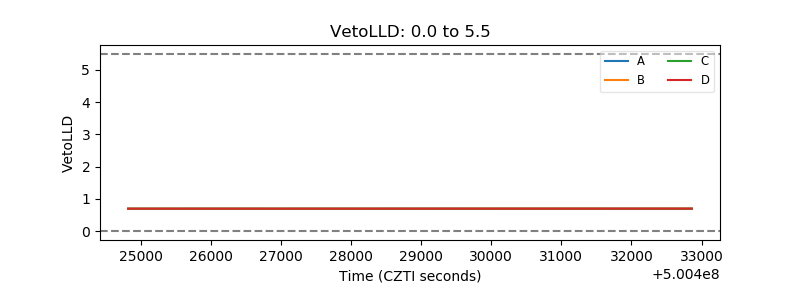 |
| Alpha Counter | 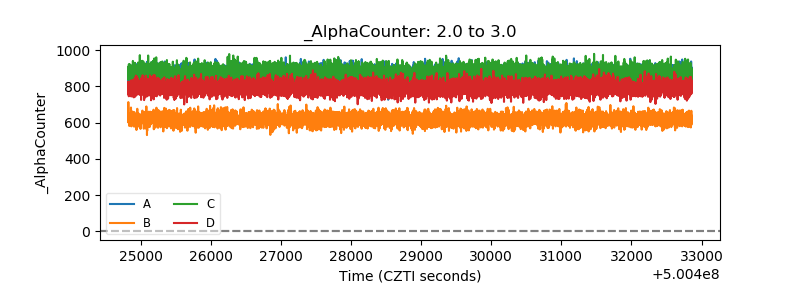 |
| _CPM_Rate | 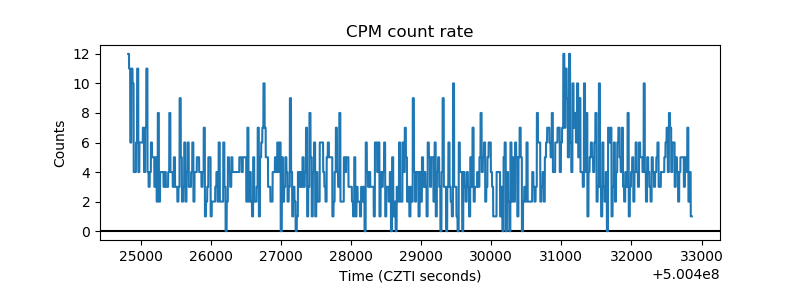 |
| CZT Counter | 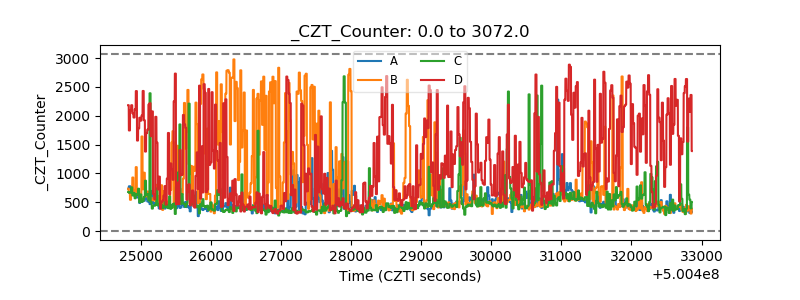 |
| +2.5 Volts monitor |  |
| +5 Volts monitor | 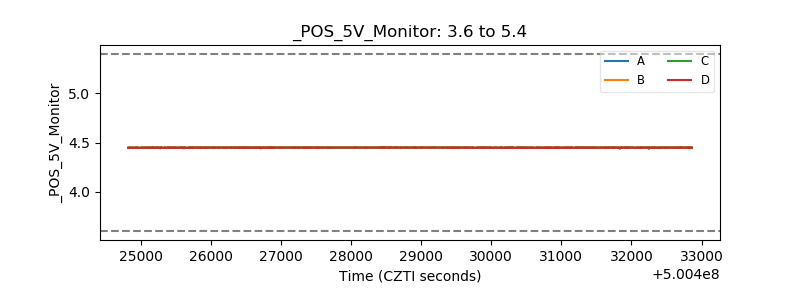 |
| _ROLL_ROT | 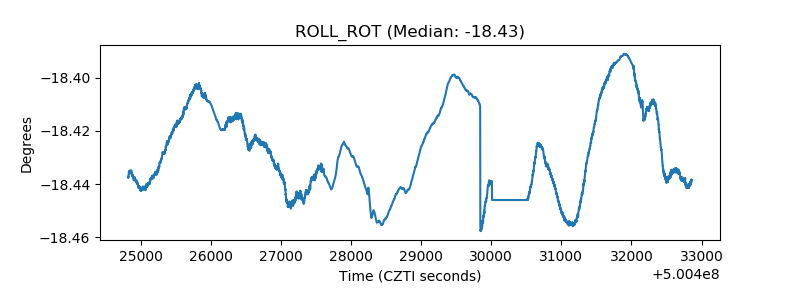 |
| _Roll_DEC |  |
| _Roll_RA | 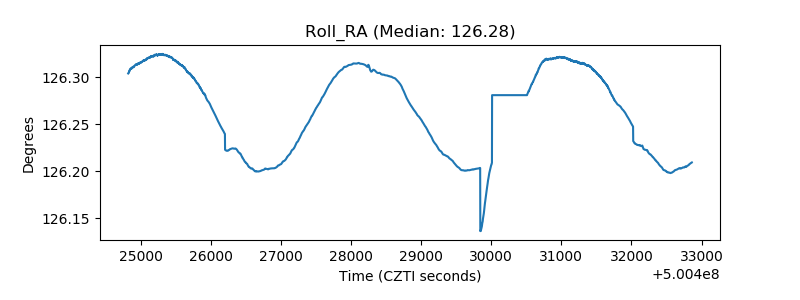 |
| Veto Counter | 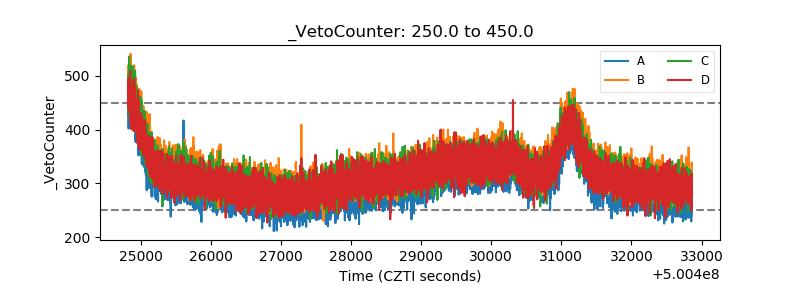 |