| Param | Original file | Final file |
|---|---|---|
| Filename | modeM0/AS1A14_103T01_9000006524_54746cztM0_level2.fits | modeM0/AS1A14_103T01_9000006524_54746cztM0_level2_quad_clean.evt |
| Size (bytes) | 1,168,067,520 | 225,374,400 |
| Size | 1.1 GB | 214.9 MB |
| Events in quadrant A | 8,480,233 | 1,483,647 |
| Events in quadrant B | 13,508,956 | 1,486,643 |
| Events in quadrant C | 7,638,872 | 1,439,238 |
| Events in quadrant D | 12,344,474 | 1,287,460 |
| Mode SS | |||
|---|---|---|---|
| Quadrant | BADHDUFLAG | Total packets | Discarded packets |
| A | 0 | 328 | 0 |
| B | 0 | 328 | 0 |
| C | 0 | 328 | 0 |
| D | 0 | 328 | 0 |
| Mode M0 | |||
|---|---|---|---|
| Quadrant | BADHDUFLAG | Total packets | Discarded packets |
| A | 0 | 36784 | 5 |
| B | 0 | 51170 | 3 |
| C | 0 | 35479 | 3 |
| D | 0 | 48218 | 3 |
| Mode M9 | |||
|---|---|---|---|
| Quadrant | BADHDUFLAG | Total packets | Discarded packets |
| A | 0 | 27 | 0 |
| B | 0 | 27 | 0 |
| C | 0 | 27 | 0 |
| D | 0 | 27 | 0 |
| Quadrant | Total seconds | Saturated seconds | Saturation percentage |
|---|---|---|---|
| A | 16350 | 307 | 1.877676% |
| B | 16350 | 1518 | 9.284404% |
| C | 16351 | 226 | 1.382178% |
| D | 16351 | 1123 | 6.868081% |
Noise dominated data is calculated using 1-second bins in cleaned event files. If a bin has >2000 counts, and if more than 50% of those come from <1% of pixels, then it is considered to be noise-dominated and hence unusable.
| Quadrant | # 1 sec bins | Bins with >0 counts | Bins with >2000 counts | High rate bins dominated by noise | Noise dominated (total time) | Noise dominated (detector-on time) | Marked lightcurve |
|---|---|---|---|---|---|---|---|
| A | 18881 | 16351 | 145 | 145 | 0.77% | 0.89% | 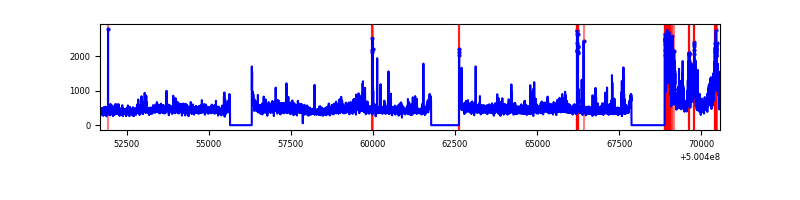 |
| B | 18881 | 16351 | 1211 | 1211 | 6.41% | 7.41% | 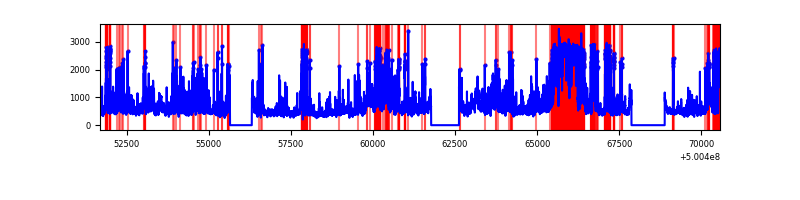 |
| C | 18882 | 16353 | 126 | 126 | 0.67% | 0.77% | 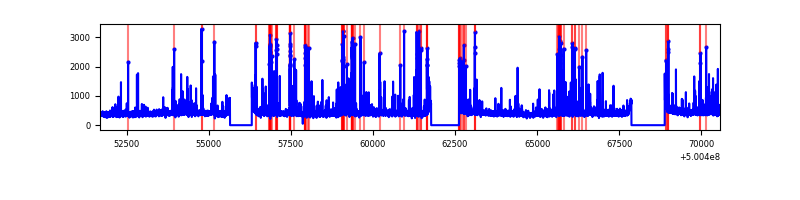 |
| D | 18882 | 16351 | 1030 | 1030 | 5.45% | 6.30% | 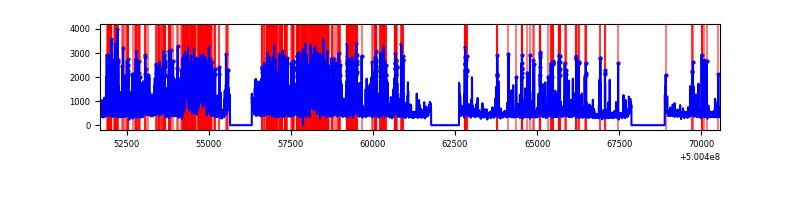 |
Top three noisy pixels from each quadrant. If the there are fewer than three noisy pixels in the level2.evt file, extra rows are filled as -1
| Pixel properties | Quadrant properties | ||||||
|---|---|---|---|---|---|---|---|
| Quadrant | DetID | PixID | Counts | Sigma | Mean | Median | Sigma |
| A | 12 | 115 | 931139 | 2207.75 | 1709 | 1670 | 421.0 |
| A | 3 | 14 | 579785 | 1373.19 | 1709 | 1670 | 421.0 |
| A | 4 | 206 | 119910 | 280.85 | 1709 | 1670 | 421.0 |
| B | 2 | 249 | 4959498 | 14295.39 | 1619 | 1562 | 346.8 |
| B | 7 | 0 | 602857 | 1733.73 | 1619 | 1562 | 346.8 |
| B | 0 | 173 | 390886 | 1122.55 | 1619 | 1562 | 346.8 |
| C | 13 | 3 | 447915 | 971.58 | 1668 | 1651 | 459.3 |
| C | 6 | 223 | 210850 | 455.46 | 1668 | 1651 | 459.3 |
| C | 4 | 5 | 119733 | 257.08 | 1668 | 1651 | 459.3 |
| D | 11 | 129 | 4798539 | 10294.67 | 1637 | 1564 | 466.0 |
| D | 3 | 12 | 259094 | 552.68 | 1637 | 1564 | 466.0 |
| D | 15 | 94 | 181631 | 386.44 | 1637 | 1564 | 466.0 |
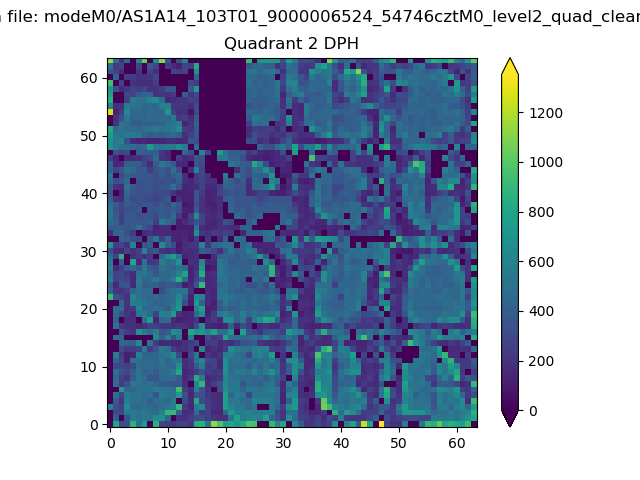
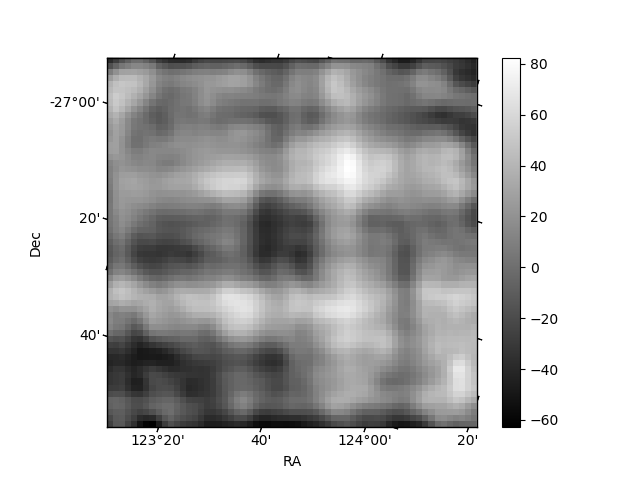
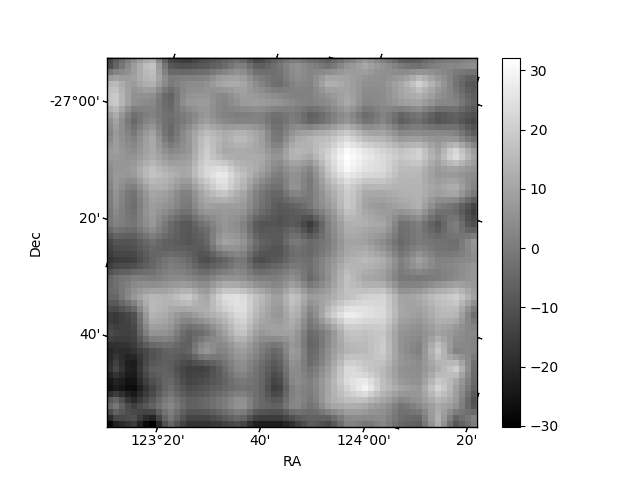
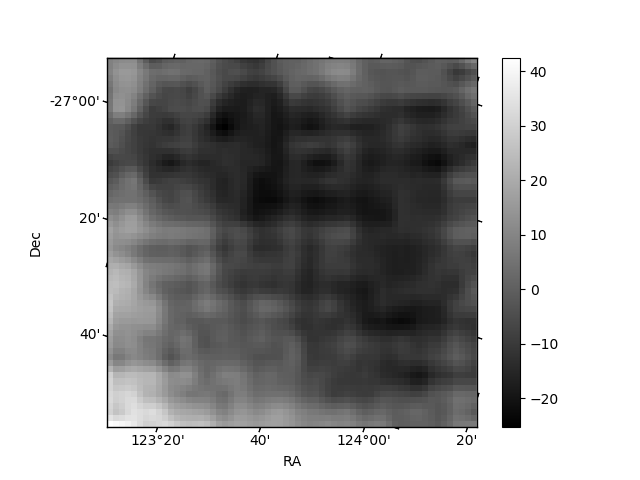
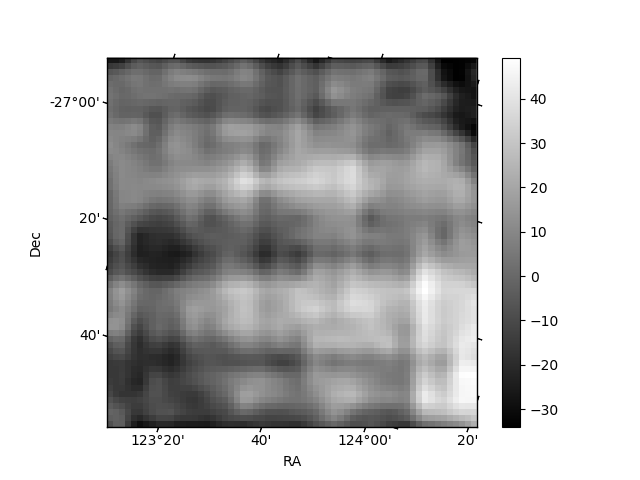
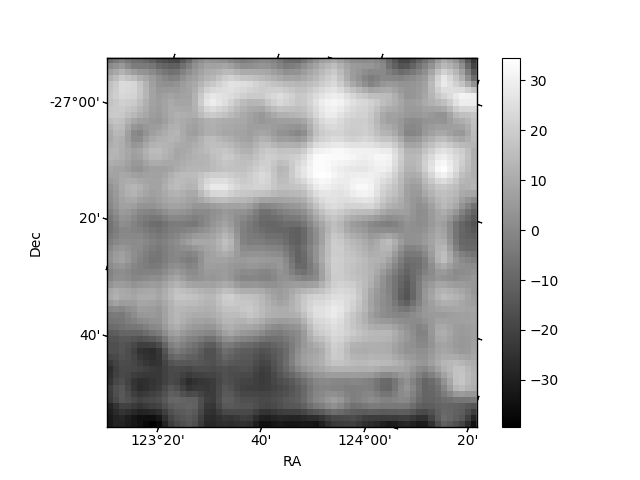
Histogram calculated using DETX and DETY for each event in the final _common_clean file
| Quadrant A | 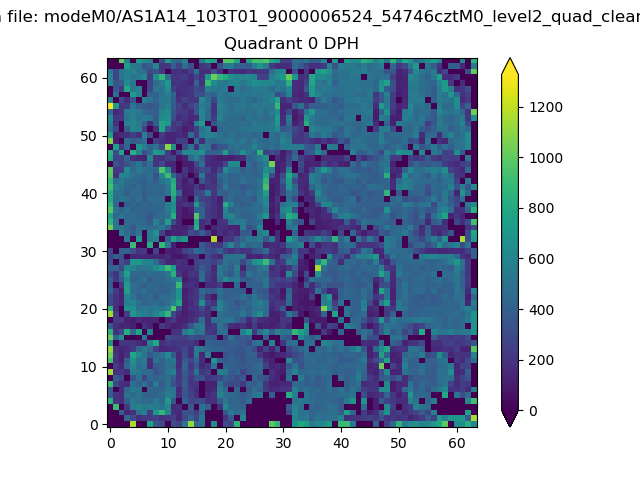 |
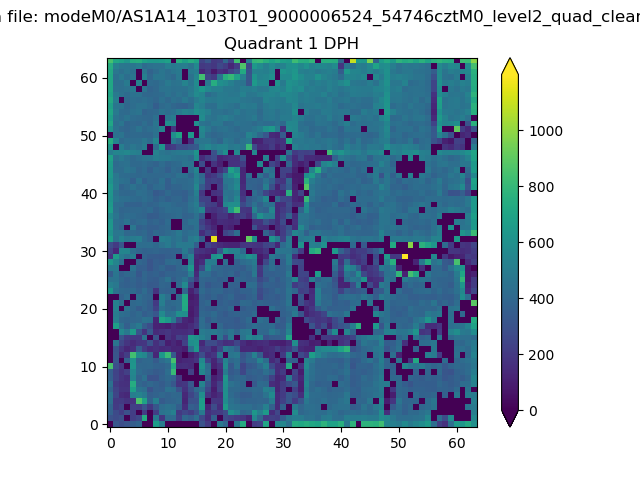 |
Quadrant B |
|---|---|---|---|
| Quadrant D | 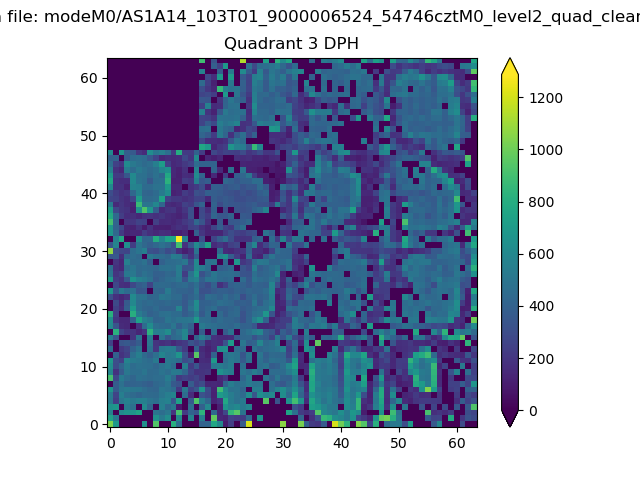 |
 |
Quadrant C |
| Plot type | Count rate plots | Images |
|---|---|---|
| Comparison with Poisson distribution Blue bars denote a histogram of data divided into 1 sec bins. Red curve is a Poisson curve with rate = median count rate of data. |
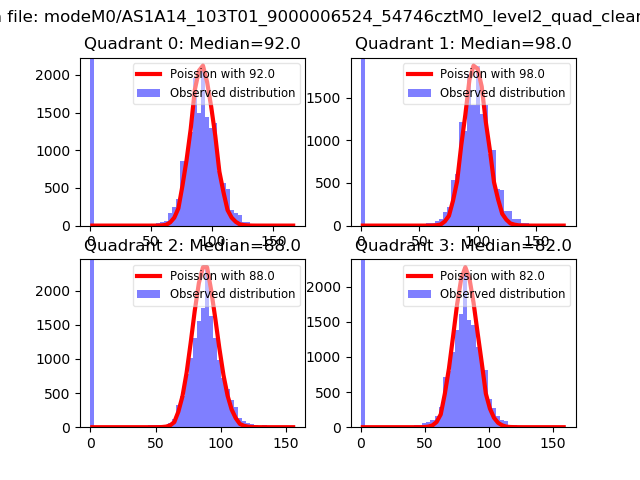 |
 |
| Quadrant-wise count rates Data is divided into 100 sec bins |
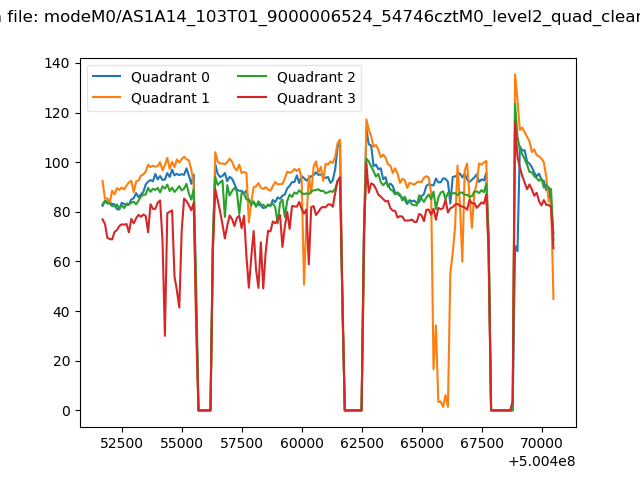 |
|
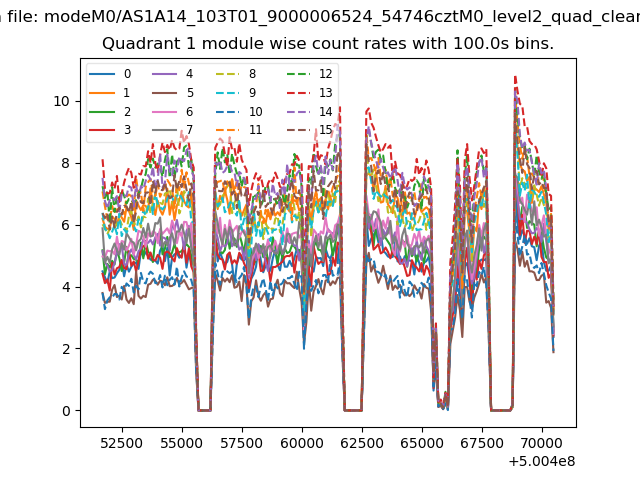
| Module-wise count rates for Quadrant A Data is divided into 100 sec bins |
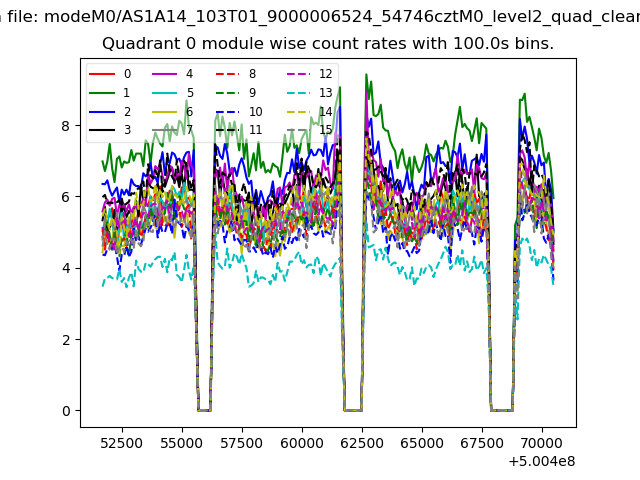 |
 |
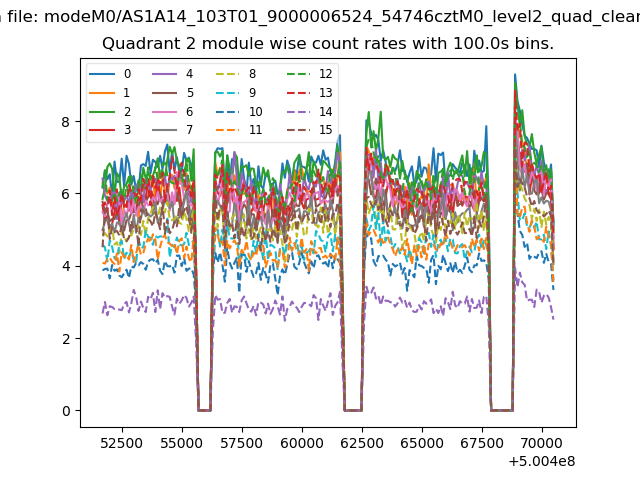
| Module-wise count rates for Quadrant B Data is divided into 100 sec bins |
 |
 |
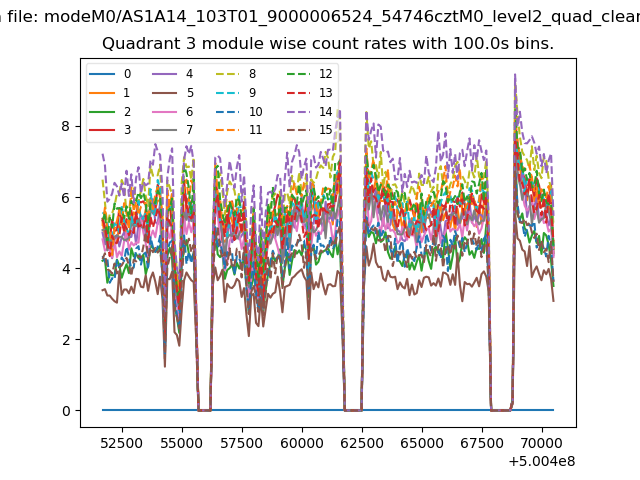
| Module-wise count rates for Quadrant C Data is divided into 100 sec bins |
 |
 |
| Module-wise count rates for Quadrant D Data is divided into 100 sec bins |
 |
 |
| Parameter | Plot |
|---|---|
| CZT HV Monitor | 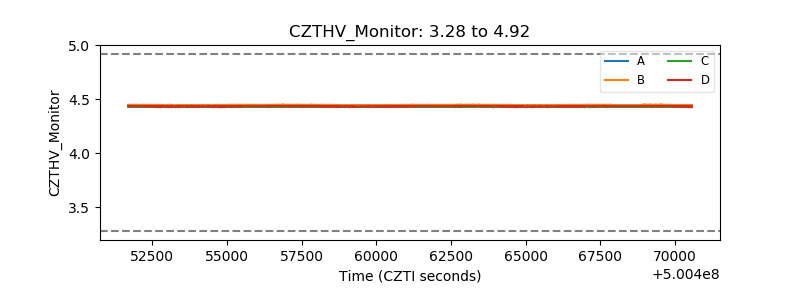 |
| D_VDD | 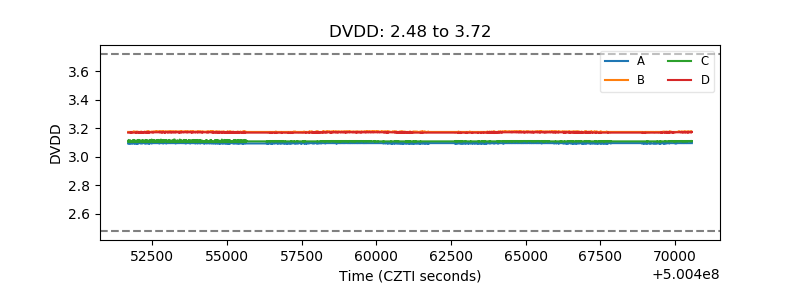 |
| Temperature 1 |  |
| Veto HV Monitor | 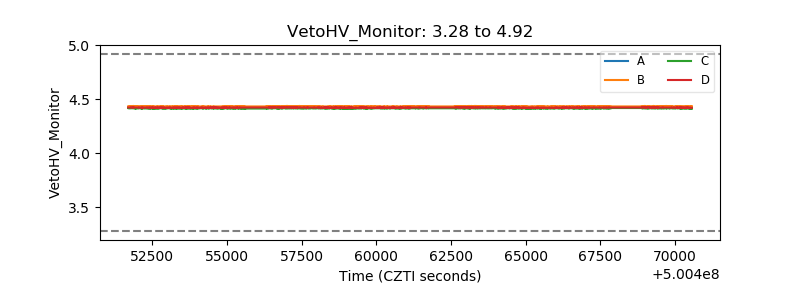 |
| Veto LLD | 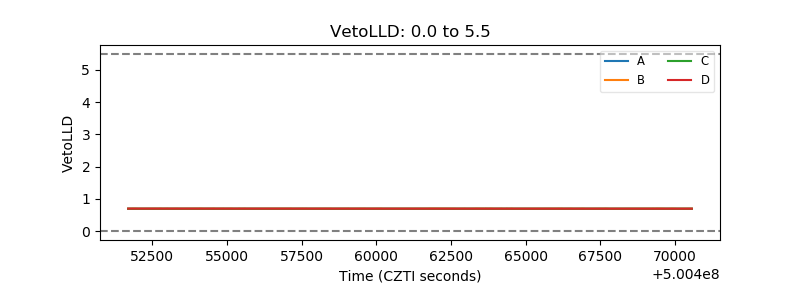 |
| Alpha Counter | 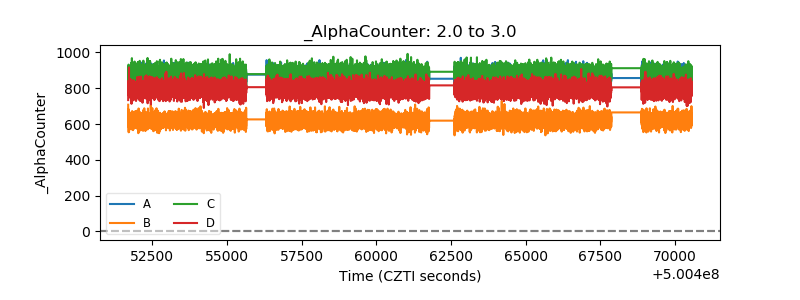 |
| _CPM_Rate | 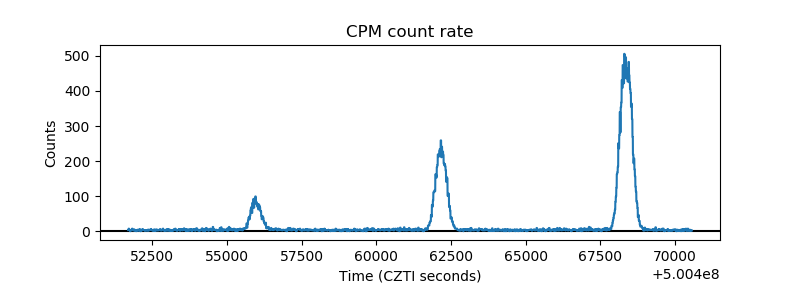 |
| CZT Counter | 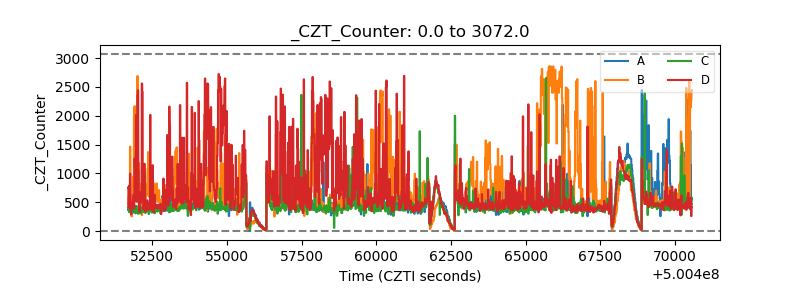 |
| +2.5 Volts monitor |  |
| +5 Volts monitor | 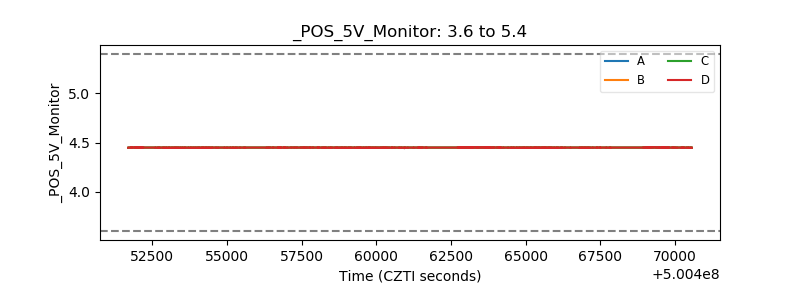 |
| _ROLL_ROT | 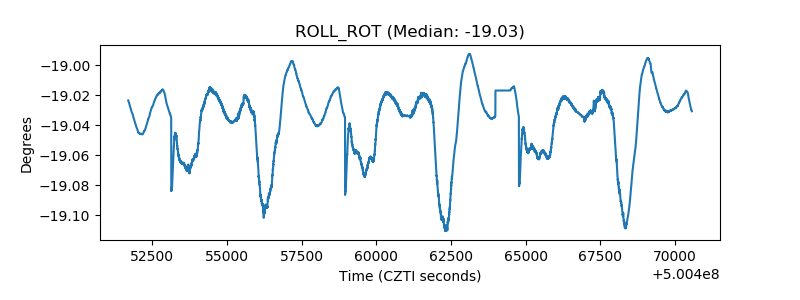 |
| _Roll_DEC | 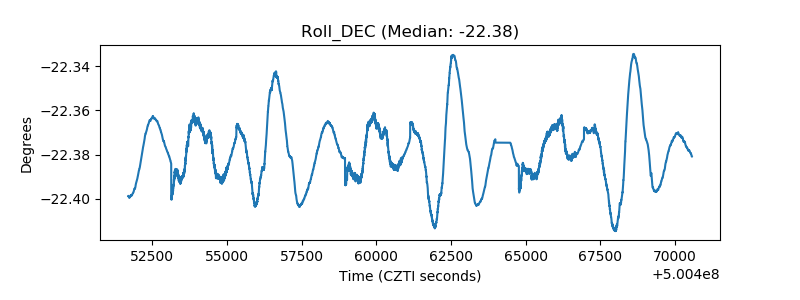 |
| _Roll_RA | 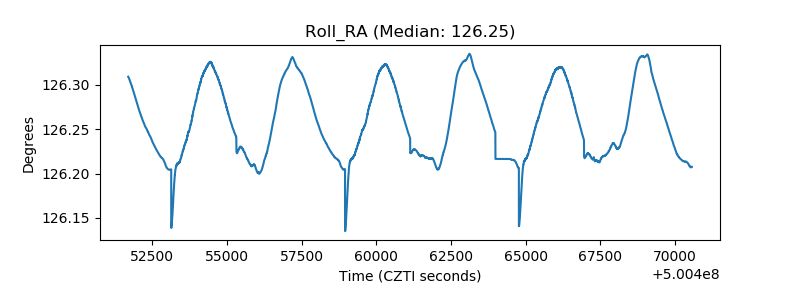 |
| Veto Counter | 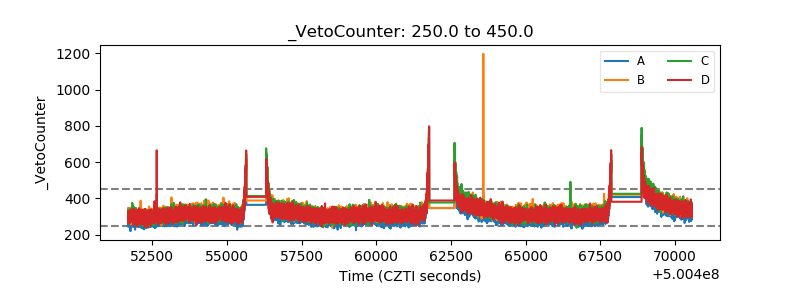 |