| Param | Original file | Final file |
|---|---|---|
| Filename | modeM0/AS1A14_103T01_9000006524_54747cztM0_level2.fits | modeM0/AS1A14_103T01_9000006524_54747cztM0_level2_quad_clean.evt |
| Size (bytes) | 564,137,280 | 88,678,080 |
| Size | 538.0 MB | 84.6 MB |
| Events in quadrant A | 5,116,392 | 600,970 |
| Events in quadrant B | 8,525,663 | 477,253 |
| Events in quadrant C | 3,170,638 | 600,303 |
| Events in quadrant D | 3,569,261 | 557,369 |
| Mode SS | |||
|---|---|---|---|
| Quadrant | BADHDUFLAG | Total packets | Discarded packets |
| A | 0 | 130 | 0 |
| B | 0 | 130 | 0 |
| C | 0 | 130 | 0 |
| D | 0 | 130 | 0 |
| Mode M0 | |||
|---|---|---|---|
| Quadrant | BADHDUFLAG | Total packets | Discarded packets |
| A | 0 | 19585 | 1 |
| B | 0 | 29690 | 1 |
| C | 0 | 14066 | 1 |
| D | 0 | 15265 | 8 |
| Mode M9 | |||
|---|---|---|---|
| Quadrant | BADHDUFLAG | Total packets | Discarded packets |
| A | 0 | 11 | 0 |
| B | 0 | 11 | 0 |
| C | 0 | 11 | 0 |
| D | 0 | 11 | 0 |
| Quadrant | Total seconds | Saturated seconds | Saturation percentage |
|---|---|---|---|
| A | 6442 | 370 | 5.743558% |
| B | 6442 | 2126 | 33.002173% |
| C | 6443 | 85 | 1.319261% |
| D | 6442 | 178 | 2.763117% |
Noise dominated data is calculated using 1-second bins in cleaned event files. If a bin has >2000 counts, and if more than 50% of those come from <1% of pixels, then it is considered to be noise-dominated and hence unusable.
| Quadrant | # 1 sec bins | Bins with >0 counts | Bins with >2000 counts | High rate bins dominated by noise | Noise dominated (total time) | Noise dominated (detector-on time) | Marked lightcurve |
|---|---|---|---|---|---|---|---|
| A | 7552 | 6442 | 288 | 288 | 3.81% | 4.47% | 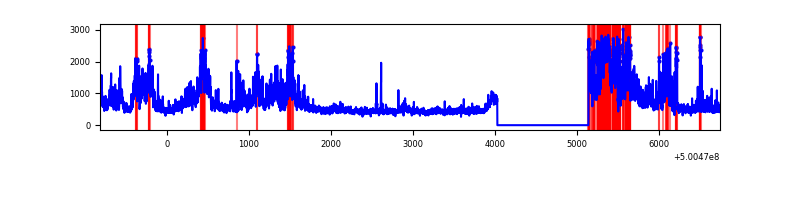 |
| B | 7552 | 6442 | 2014 | 2014 | 26.67% | 31.26% | 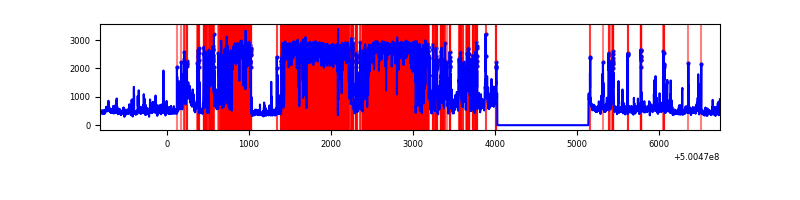 |
| C | 7553 | 6443 | 40 | 40 | 0.53% | 0.62% | 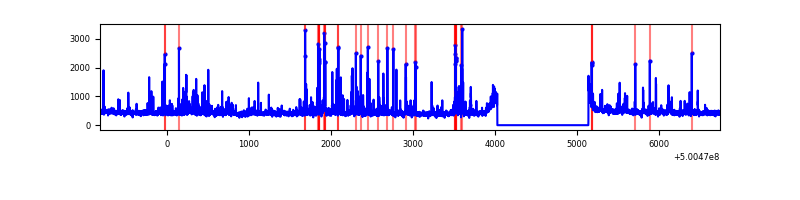 |
| D | 7552 | 6442 | 138 | 138 | 1.83% | 2.14% | 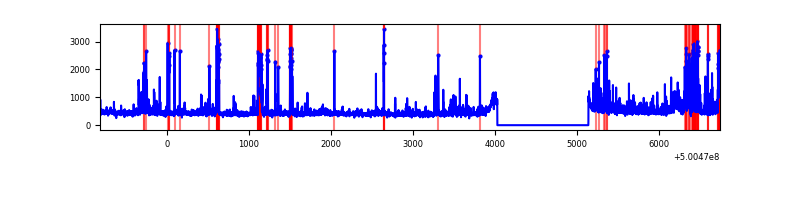 |
Top three noisy pixels from each quadrant. If the there are fewer than three noisy pixels in the level2.evt file, extra rows are filled as -1
| Pixel properties | Quadrant properties | ||||||
|---|---|---|---|---|---|---|---|
| Quadrant | DetID | PixID | Counts | Sigma | Mean | Median | Sigma |
| A | 12 | 115 | 2085327 | 12305.4 | 689 | 672 | 169.4 |
| A | 3 | 14 | 241976 | 1424.38 | 689 | 672 | 169.4 |
| A | 5 | 243 | 32768 | 189.46 | 689 | 672 | 169.4 |
| B | 2 | 249 | 5918642 | 49546.84 | 556 | 536 | 119.4 |
| B | 5 | 185 | 153033 | 1276.72 | 556 | 536 | 119.4 |
| B | 7 | 0 | 50363 | 417.16 | 556 | 536 | 119.4 |
| C | 13 | 3 | 121543 | 650.14 | 680 | 674 | 185.9 |
| C | 14 | 254 | 120599 | 645.06 | 680 | 674 | 185.9 |
| C | 6 | 223 | 82374 | 439.46 | 680 | 674 | 185.9 |
| D | 11 | 129 | 299619 | 1563.21 | 678 | 648 | 191.3 |
| D | 3 | 12 | 207487 | 1081.48 | 678 | 648 | 191.3 |
| D | 2 | 120 | 109513 | 569.21 | 678 | 648 | 191.3 |
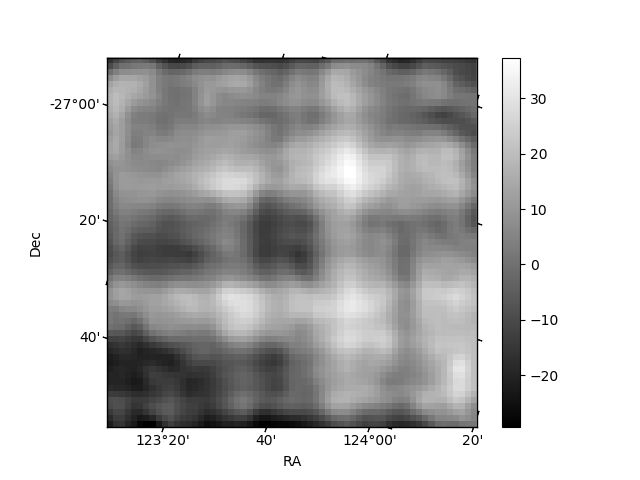
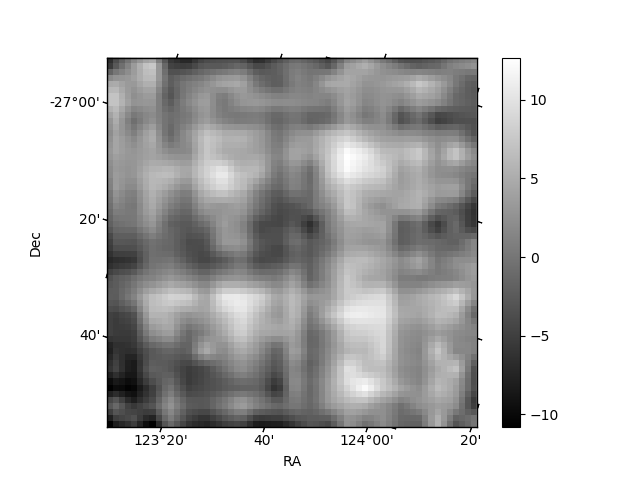
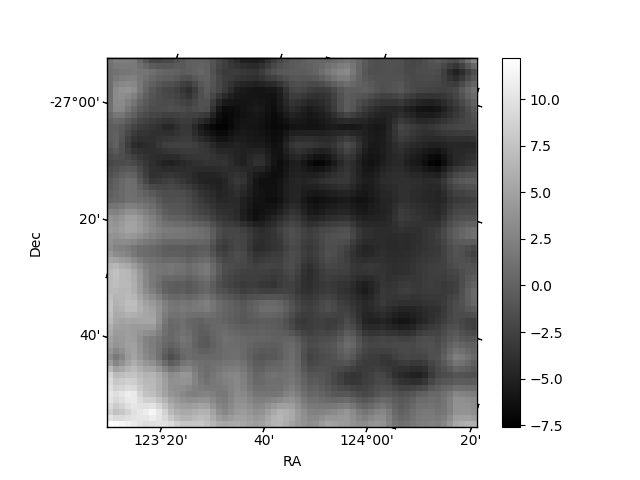
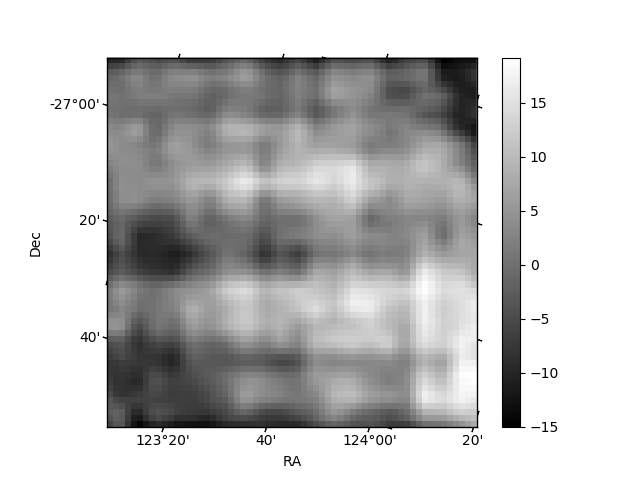
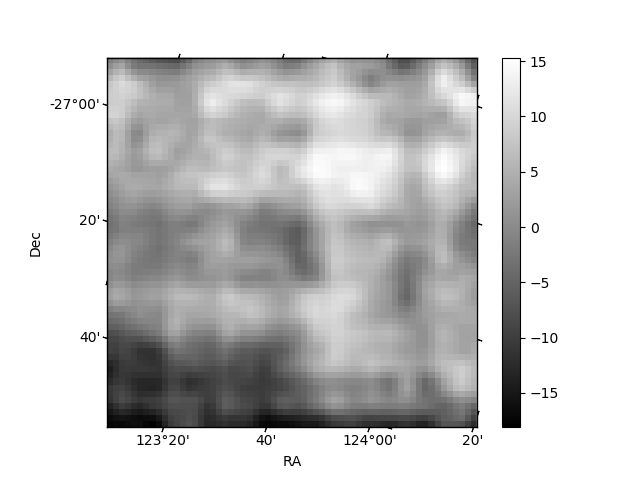
Histogram calculated using DETX and DETY for each event in the final _common_clean file
| Quadrant A | 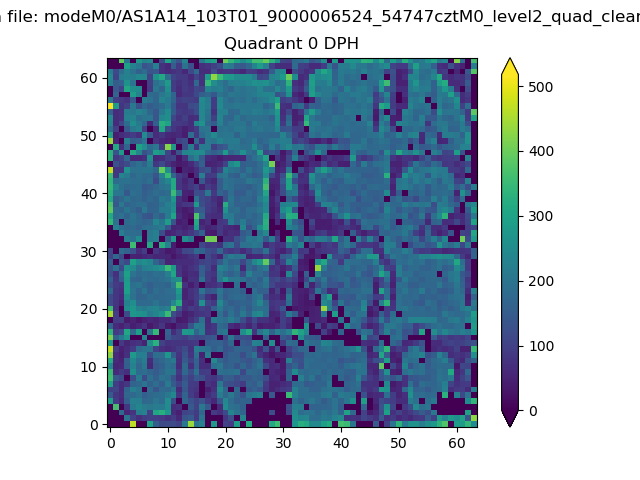 |
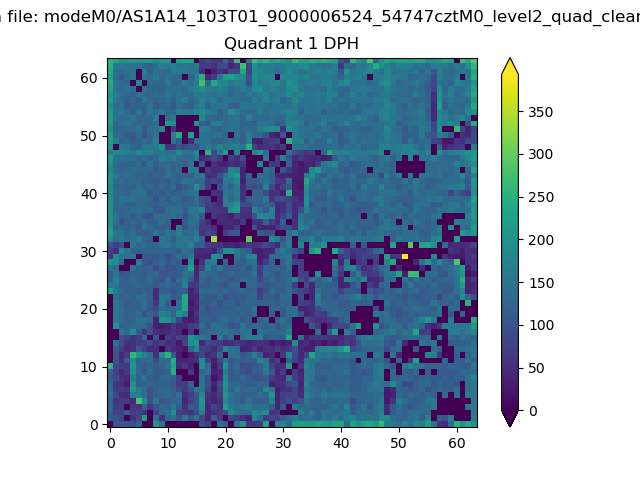 |
Quadrant B |
|---|---|---|---|
| Quadrant D | 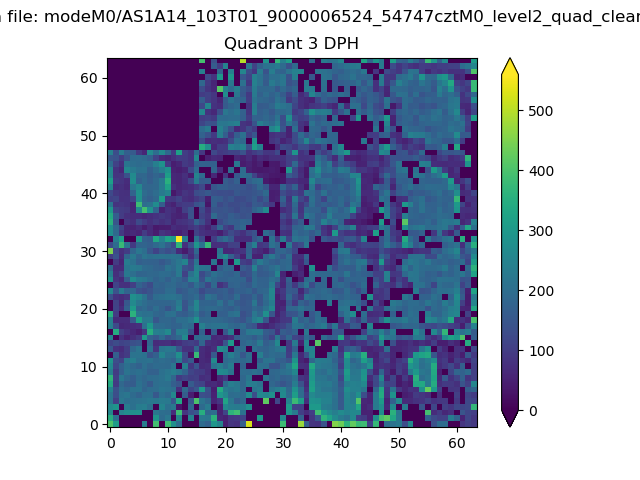 |
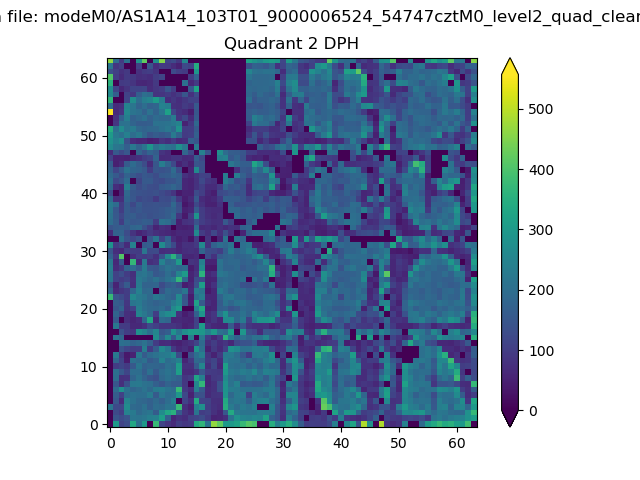 |
Quadrant C |
| Plot type | Count rate plots | Images |
|---|---|---|
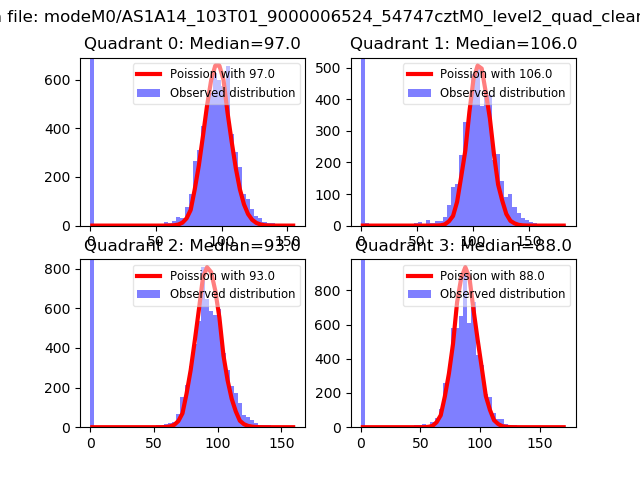
| Comparison with Poisson distribution Blue bars denote a histogram of data divided into 1 sec bins. Red curve is a Poisson curve with rate = median count rate of data. |
 |
 |
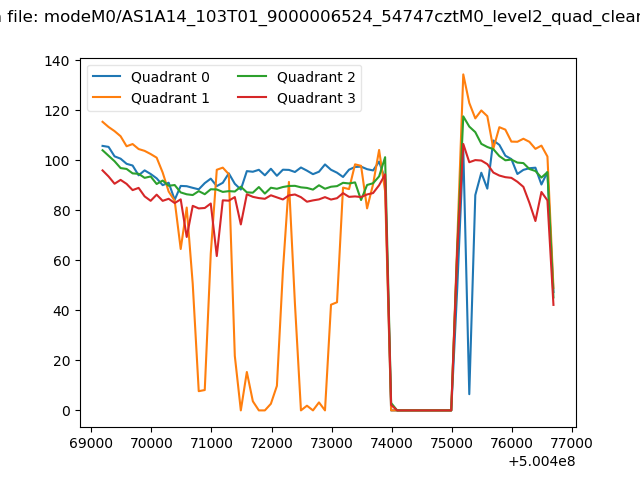
| Quadrant-wise count rates Data is divided into 100 sec bins |
 |
|
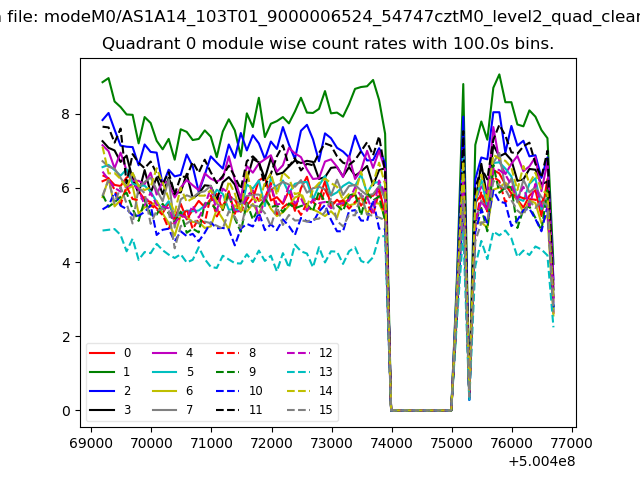
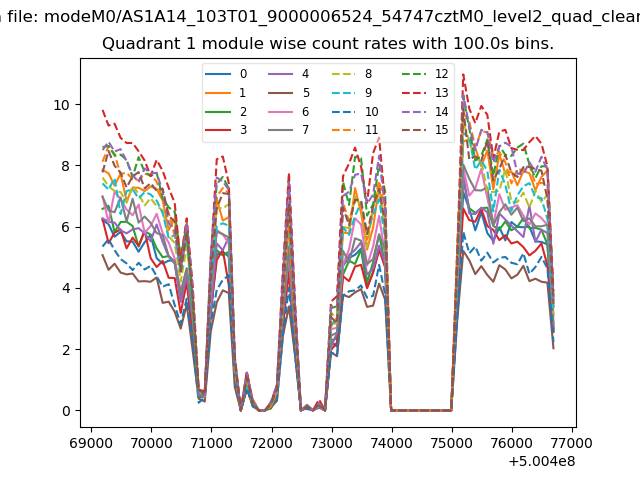
| Module-wise count rates for Quadrant A Data is divided into 100 sec bins |
 |
 |
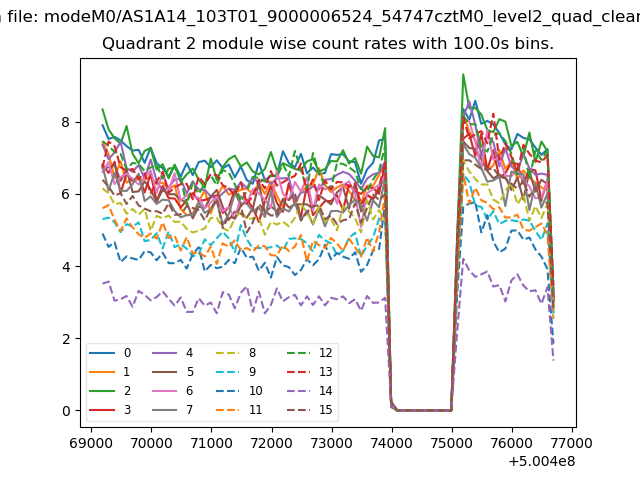
| Module-wise count rates for Quadrant B Data is divided into 100 sec bins |
 |
 |
| Module-wise count rates for Quadrant C Data is divided into 100 sec bins |
 |
 |
| Module-wise count rates for Quadrant D Data is divided into 100 sec bins |
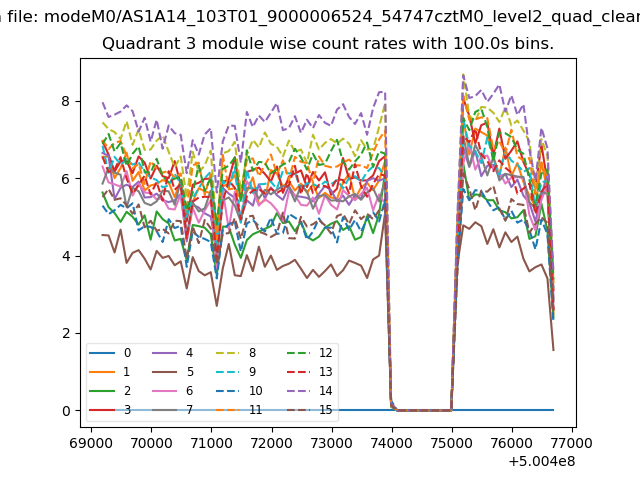 |
 |
| Parameter | Plot |
|---|---|
| CZT HV Monitor | 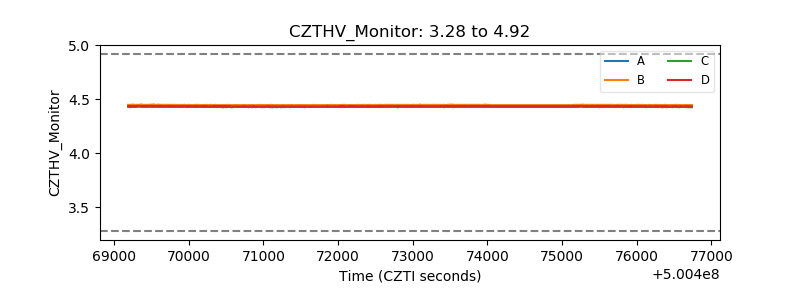 |
| D_VDD | 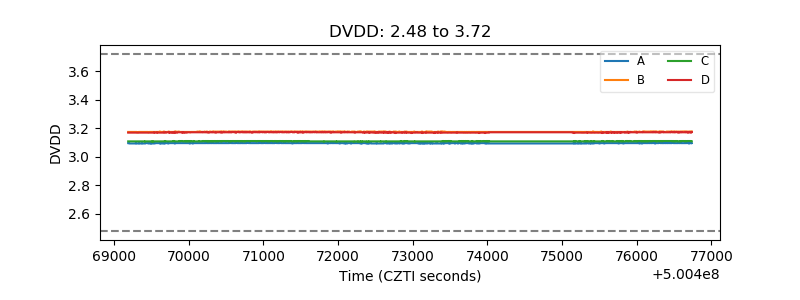 |
| Temperature 1 | 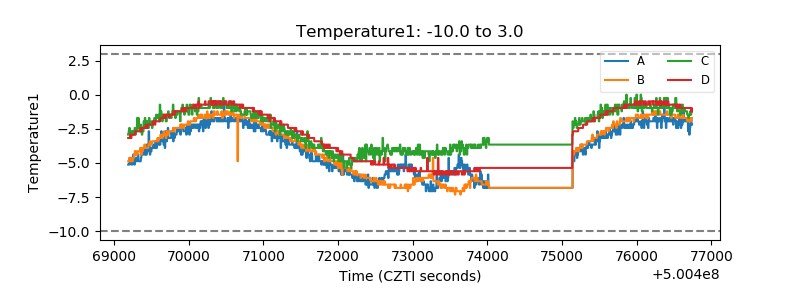 |
| Veto HV Monitor | 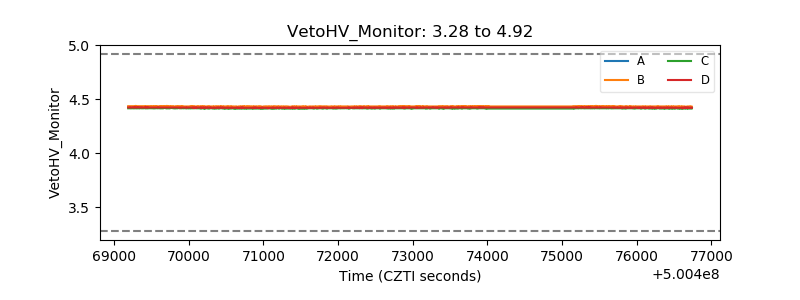 |
| Veto LLD | 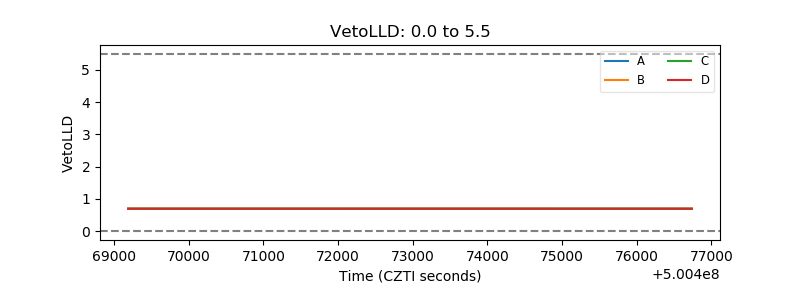 |
| Alpha Counter | 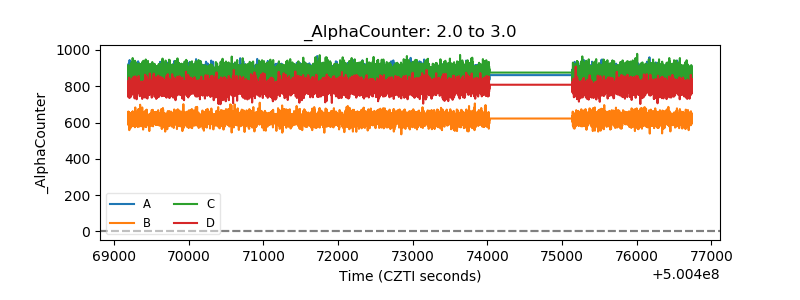 |
| _CPM_Rate | 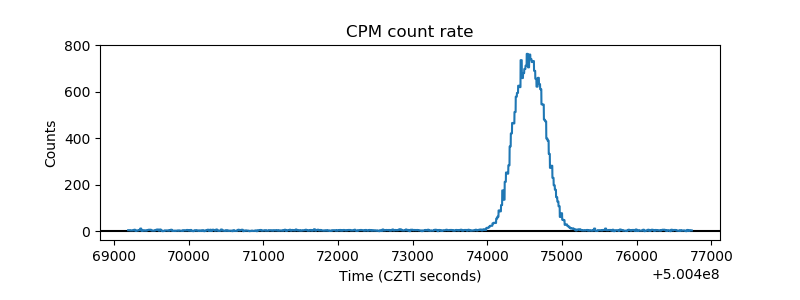 |
| CZT Counter | 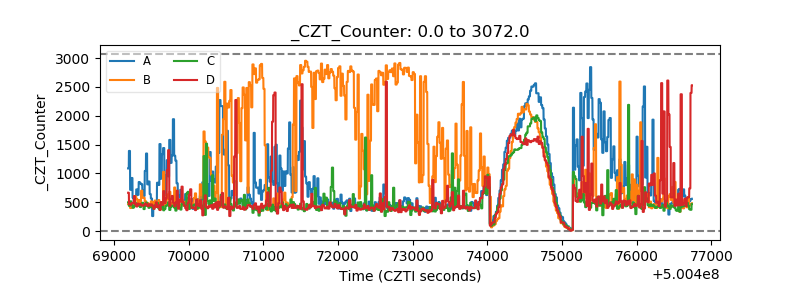 |
| +2.5 Volts monitor |  |
| +5 Volts monitor | 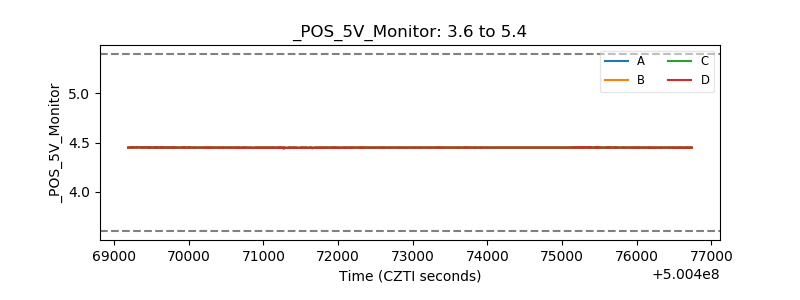 |
| _ROLL_ROT |  |
| _Roll_DEC | 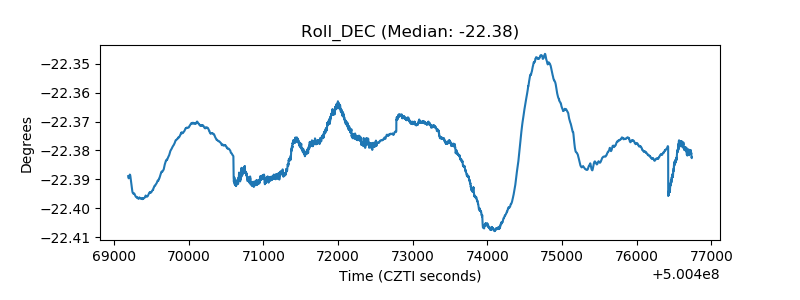 |
| _Roll_RA | 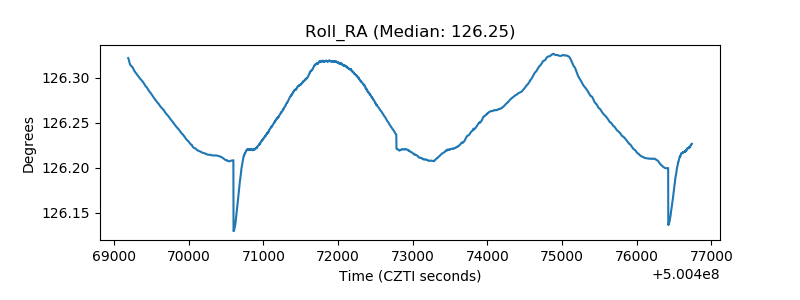 |
| Veto Counter | 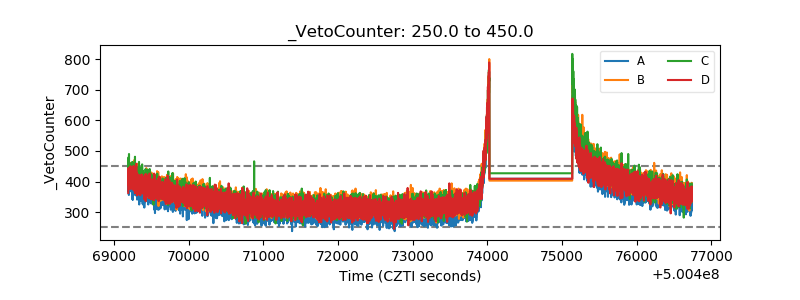 |