| Param | Original file | Final file |
|---|---|---|
| Filename | modeM0/AS1A14_103T01_9000006524_54749cztM0_level2.fits | modeM0/AS1A14_103T01_9000006524_54749cztM0_level2_quad_clean.evt |
| Size (bytes) | 478,264,320 | 97,493,760 |
| Size | 456.1 MB | 93.0 MB |
| Events in quadrant A | 3,796,044 | 648,154 |
| Events in quadrant B | 4,675,600 | 666,946 |
| Events in quadrant C | 3,916,191 | 622,865 |
| Events in quadrant D | 4,809,353 | 559,276 |
| Mode SS | |||
|---|---|---|---|
| Quadrant | BADHDUFLAG | Total packets | Discarded packets |
| A | 0 | 134 | 0 |
| B | 0 | 134 | 0 |
| C | 0 | 134 | 0 |
| D | 0 | 134 | 0 |
| Mode M0 | |||
|---|---|---|---|
| Quadrant | BADHDUFLAG | Total packets | Discarded packets |
| A | 0 | 15430 | 2 |
| B | 0 | 18356 | 2 |
| C | 0 | 16158 | 2 |
| D | 0 | 18790 | 2 |
| Mode M9 | |||
|---|---|---|---|
| Quadrant | BADHDUFLAG | Total packets | Discarded packets |
| A | 0 | 11 | 0 |
| B | 0 | 12 | 0 |
| C | 0 | 12 | 0 |
| D | 0 | 12 | 0 |
| Quadrant | Total seconds | Saturated seconds | Saturation percentage |
|---|---|---|---|
| A | 6519 | 227 | 3.482129% |
| B | 6519 | 568 | 8.712993% |
| C | 6519 | 178 | 2.730480% |
| D | 6519 | 491 | 7.531830% |
Noise dominated data is calculated using 1-second bins in cleaned event files. If a bin has >2000 counts, and if more than 50% of those come from <1% of pixels, then it is considered to be noise-dominated and hence unusable.
| Quadrant | # 1 sec bins | Bins with >0 counts | Bins with >2000 counts | High rate bins dominated by noise | Noise dominated (total time) | Noise dominated (detector-on time) | Marked lightcurve |
|---|---|---|---|---|---|---|---|
| A | 7659 | 6519 | 87 | 87 | 1.14% | 1.33% | 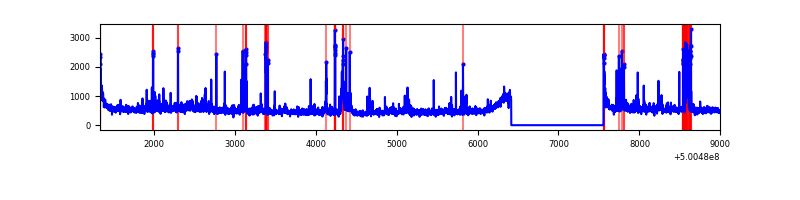 |
| B | 7659 | 6519 | 398 | 398 | 5.20% | 6.11% | 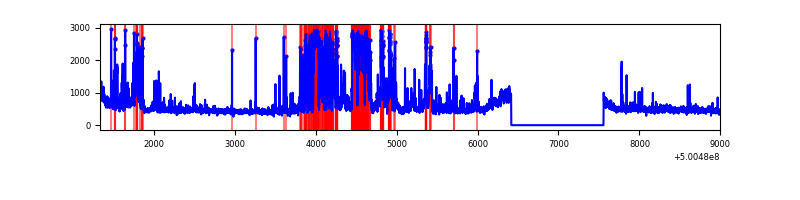 |
| C | 7659 | 6519 | 85 | 85 | 1.11% | 1.30% | 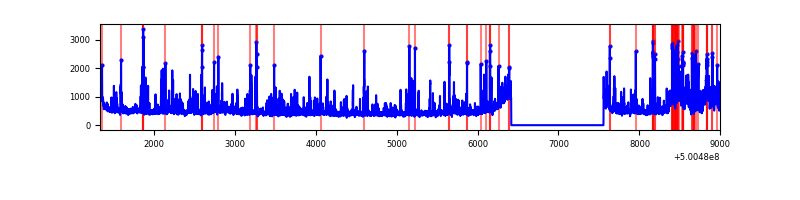 |
| D | 7659 | 6519 | 409 | 409 | 5.34% | 6.27% | 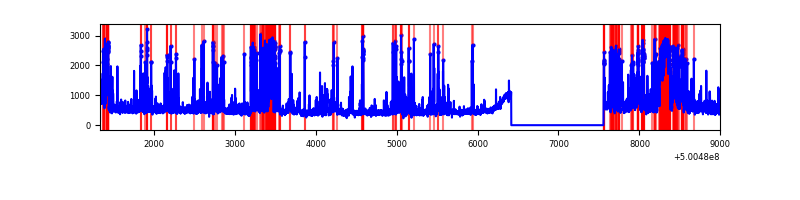 |
Top three noisy pixels from each quadrant. If the there are fewer than three noisy pixels in the level2.evt file, extra rows are filled as -1
| Pixel properties | Quadrant properties | ||||||
|---|---|---|---|---|---|---|---|
| Quadrant | DetID | PixID | Counts | Sigma | Mean | Median | Sigma |
| A | 3 | 14 | 435446 | 2387.17 | 739 | 720 | 182.1 |
| A | 4 | 249 | 191807 | 1049.29 | 739 | 720 | 182.1 |
| A | 0 | 8 | 100809 | 549.61 | 739 | 720 | 182.1 |
| B | 2 | 249 | 1505008 | 9884.36 | 715 | 689 | 152.2 |
| B | 7 | 252 | 106154 | 692.97 | 715 | 689 | 152.2 |
| B | 5 | 185 | 76246 | 496.46 | 715 | 689 | 152.2 |
| C | 9 | 38 | 229555 | 1173.18 | 713 | 708 | 195.1 |
| C | 13 | 3 | 185346 | 946.54 | 713 | 708 | 195.1 |
| C | 1 | 16 | 163538 | 834.74 | 713 | 708 | 195.1 |
| D | 11 | 129 | 592939 | 2988.36 | 701 | 669 | 198.2 |
| D | 6 | 239 | 512191 | 2580.94 | 701 | 669 | 198.2 |
| D | 3 | 12 | 334748 | 1685.63 | 701 | 669 | 198.2 |
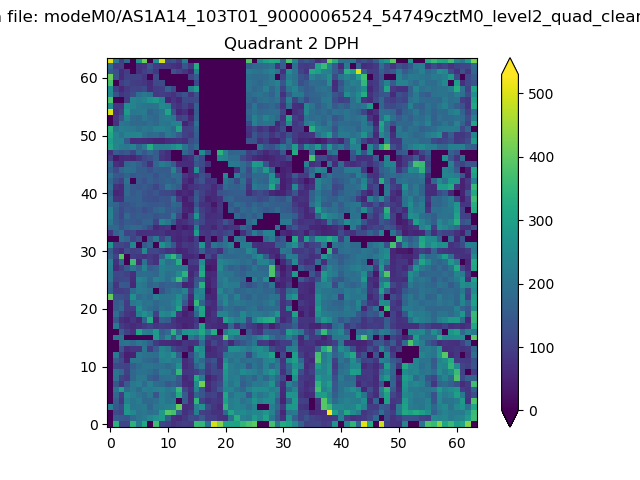
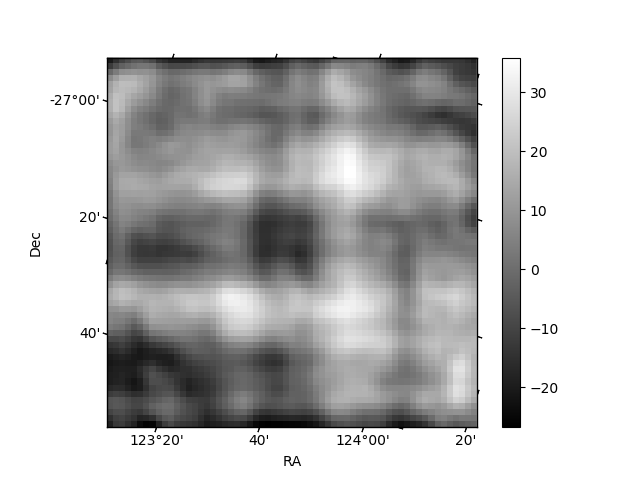
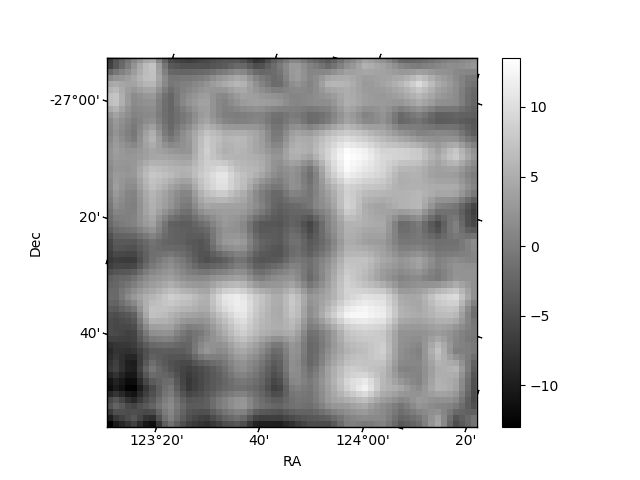
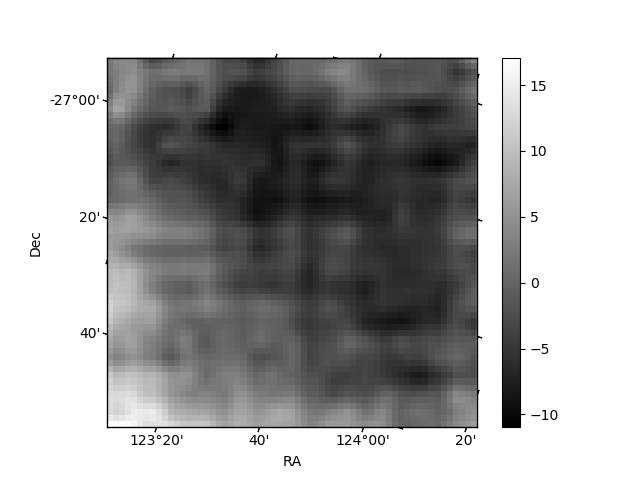
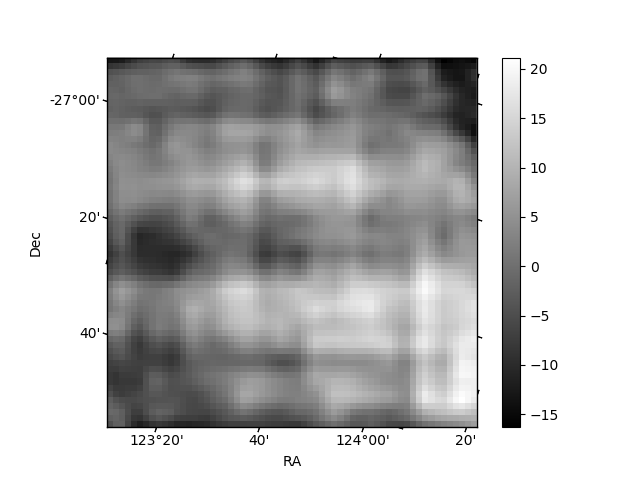
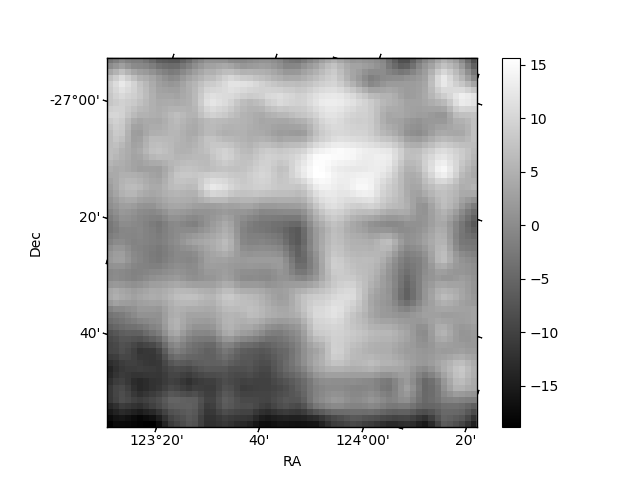
Histogram calculated using DETX and DETY for each event in the final _common_clean file
| Quadrant A | 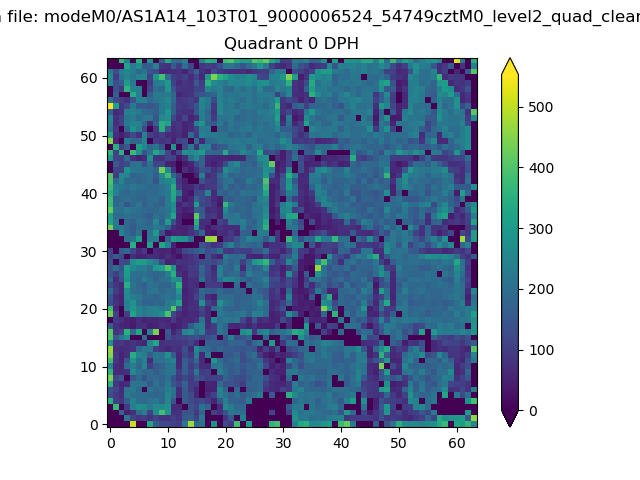 |
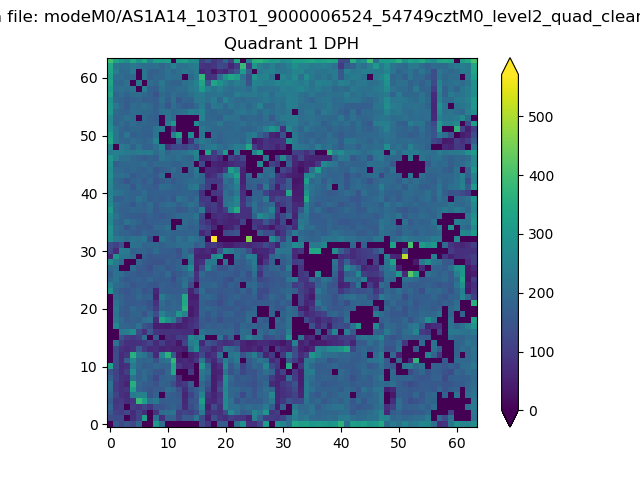 |
Quadrant B |
|---|---|---|---|
| Quadrant D | 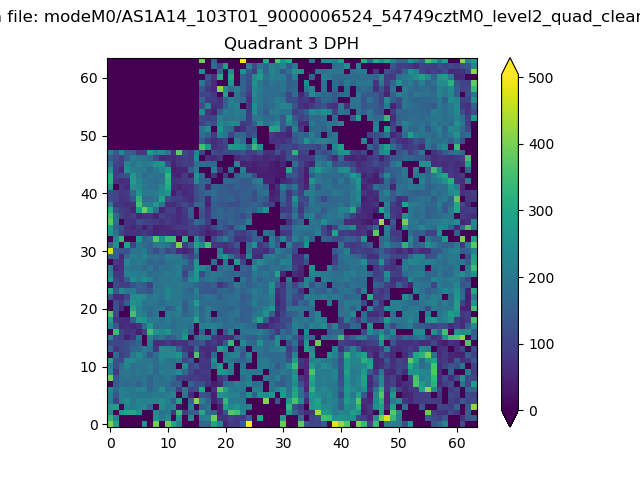 |
 |
Quadrant C |
| Plot type | Count rate plots | Images |
|---|---|---|
| Comparison with Poisson distribution Blue bars denote a histogram of data divided into 1 sec bins. Red curve is a Poisson curve with rate = median count rate of data. |
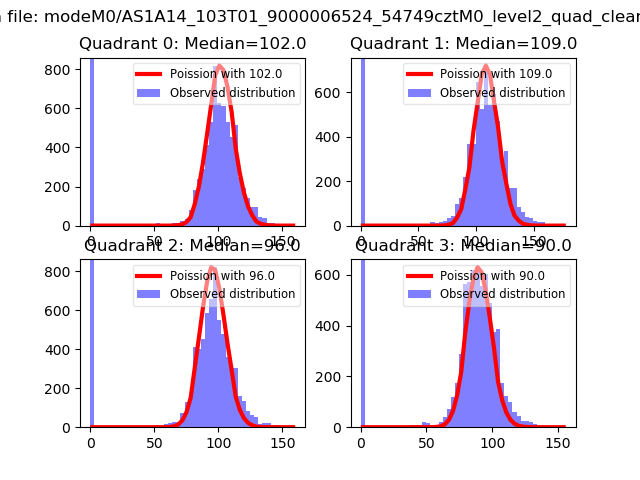 |
 |
| Quadrant-wise count rates Data is divided into 100 sec bins |
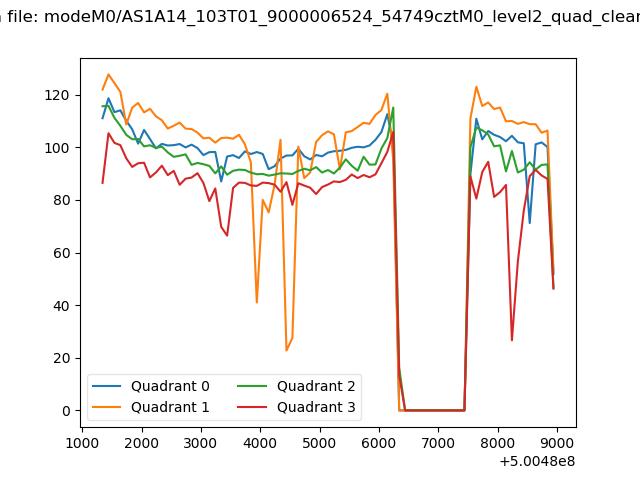 |
|
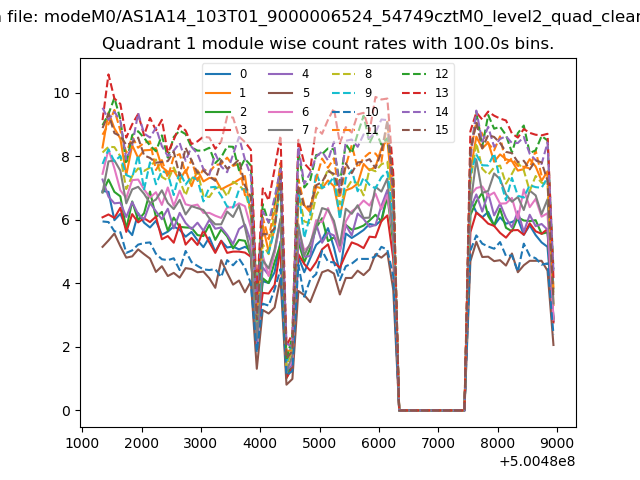
| Module-wise count rates for Quadrant A Data is divided into 100 sec bins |
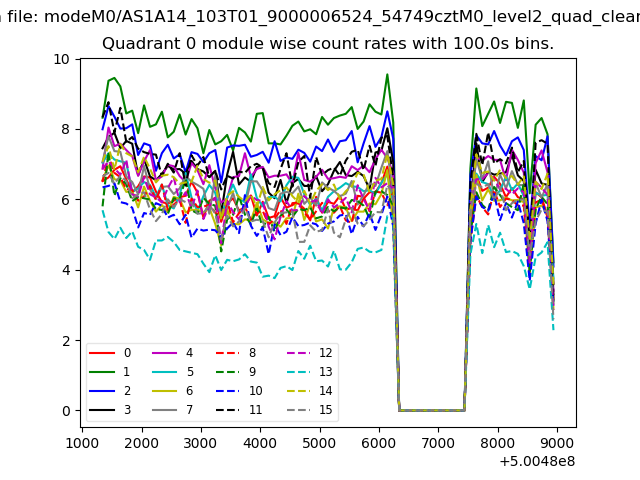 |
 |
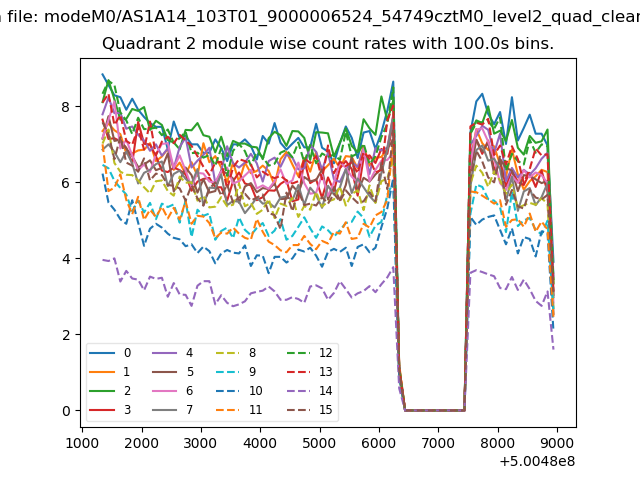
| Module-wise count rates for Quadrant B Data is divided into 100 sec bins |
 |
 |
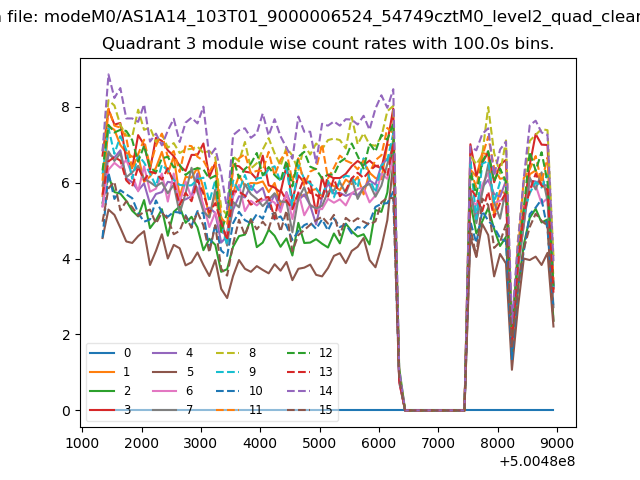
| Module-wise count rates for Quadrant C Data is divided into 100 sec bins |
 |
 |
| Module-wise count rates for Quadrant D Data is divided into 100 sec bins |
 |
 |
| Parameter | Plot |
|---|---|
| CZT HV Monitor | 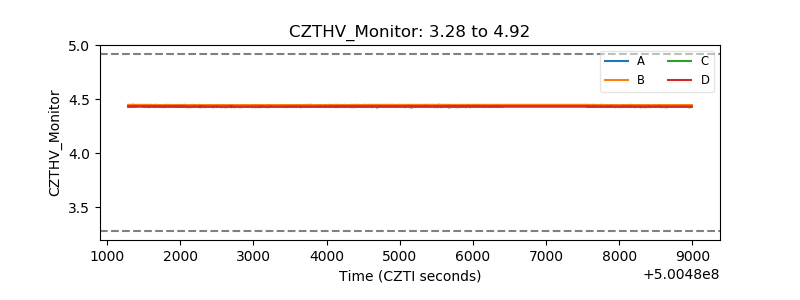 |
| D_VDD | 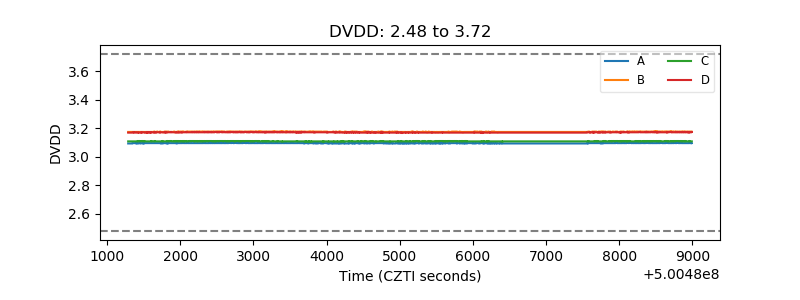 |
| Temperature 1 | 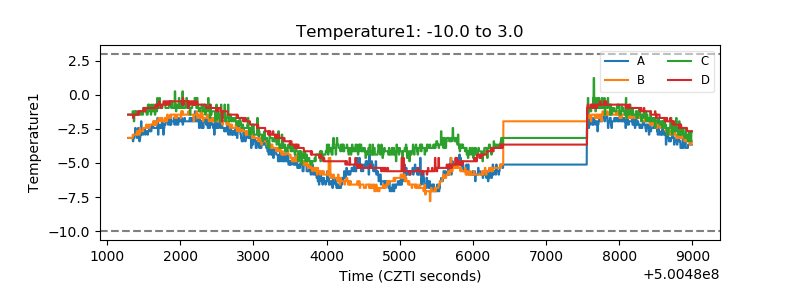 |
| Veto HV Monitor | 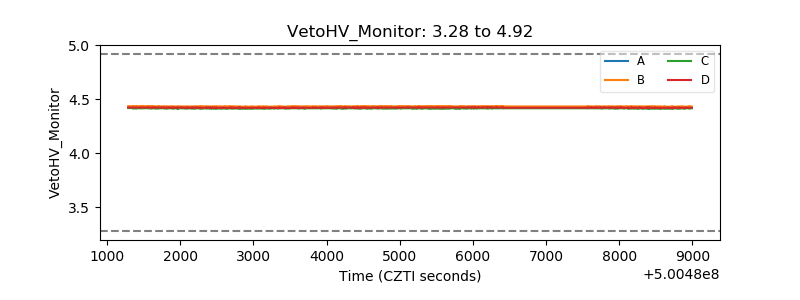 |
| Veto LLD | 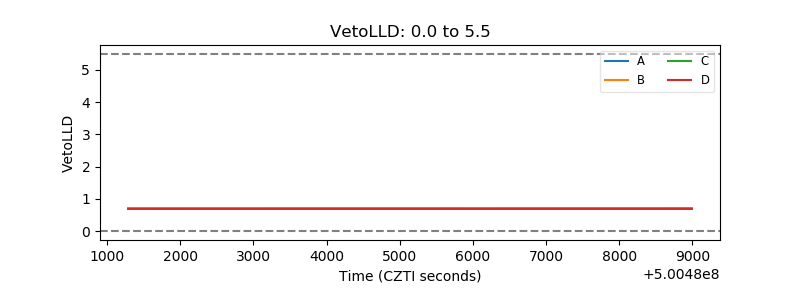 |
| Alpha Counter | 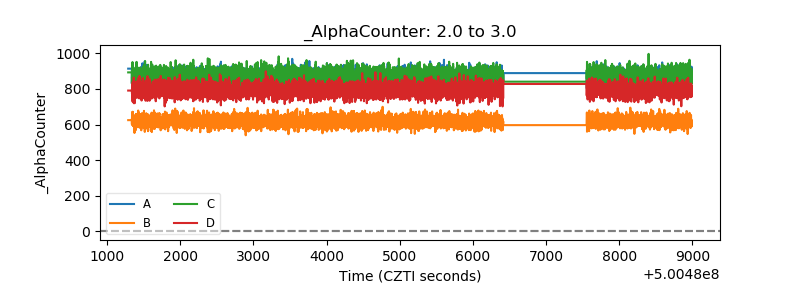 |
| _CPM_Rate | 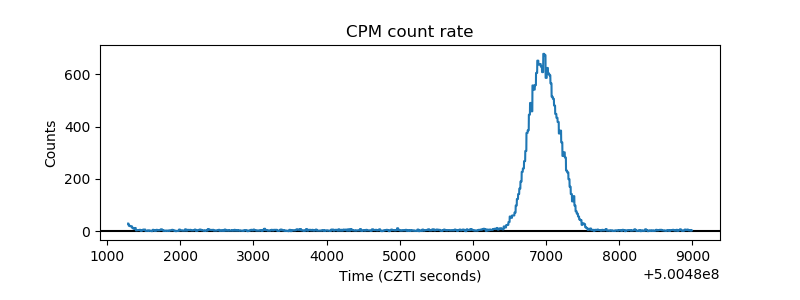 |
| CZT Counter | 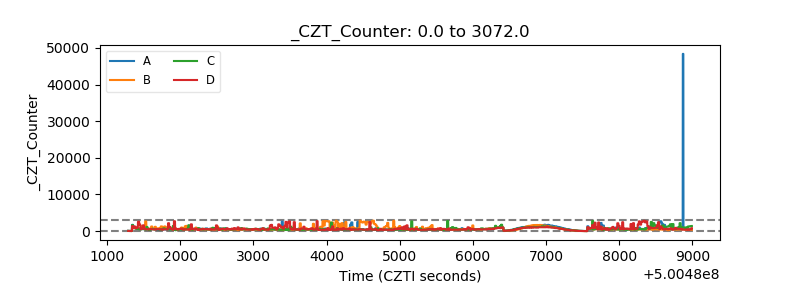 |
| +2.5 Volts monitor |  |
| +5 Volts monitor | 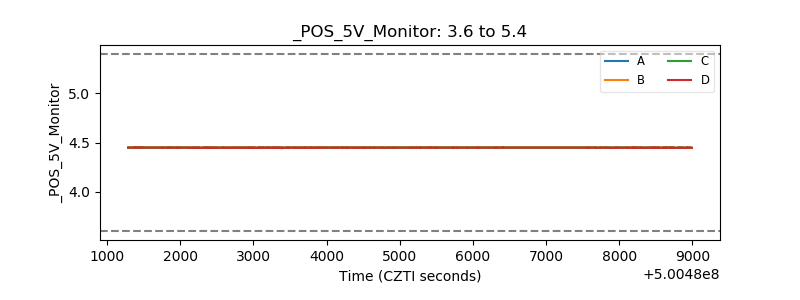 |
| _ROLL_ROT | 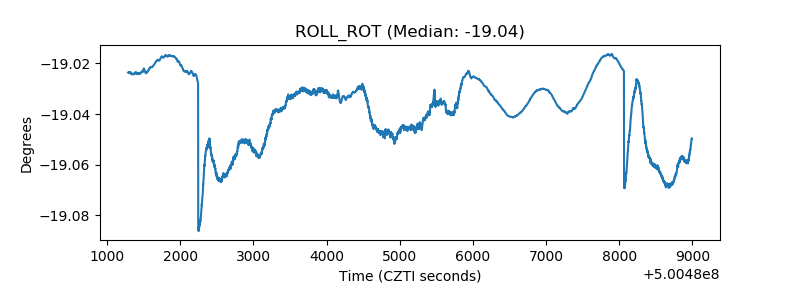 |
| _Roll_DEC | 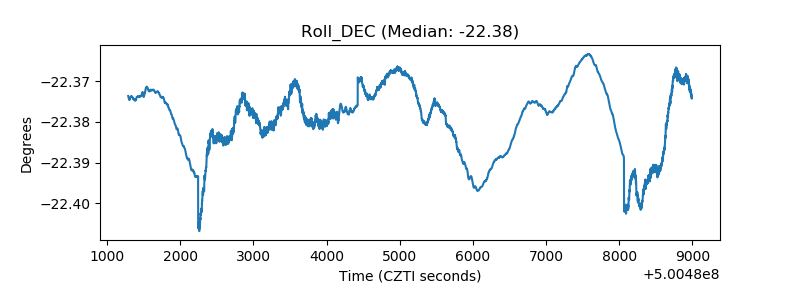 |
| _Roll_RA | 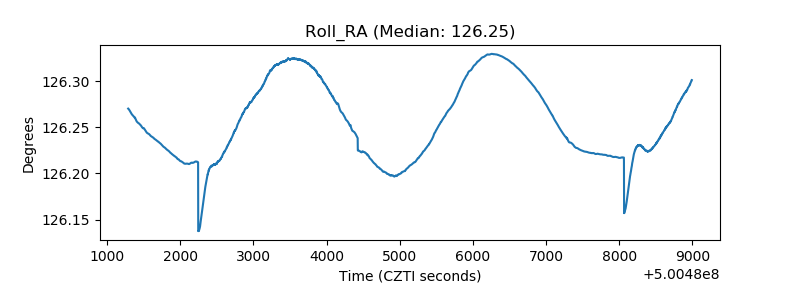 |
| Veto Counter | 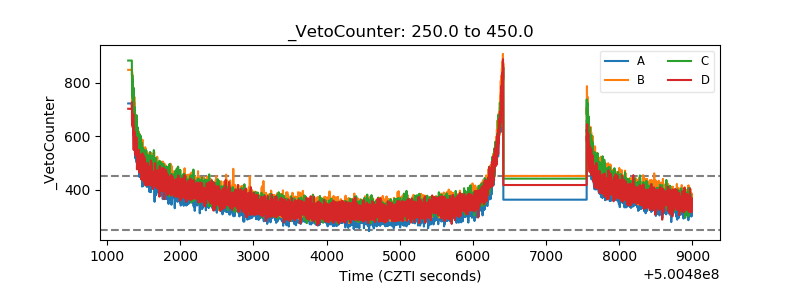 |