| Param | Original file | Final file |
|---|---|---|
| Filename | modeM0/AS1A14_103T01_9000006524_54750cztM0_level2.fits | modeM0/AS1A14_103T01_9000006524_54750cztM0_level2_quad_clean.evt |
| Size (bytes) | 551,664,000 | 93,386,880 |
| Size | 526.1 MB | 89.1 MB |
| Events in quadrant A | 3,433,124 | 641,042 |
| Events in quadrant B | 5,697,315 | 608,817 |
| Events in quadrant C | 5,519,731 | 582,568 |
| Events in quadrant D | 5,263,072 | 539,043 |
| Mode SS | |||
|---|---|---|---|
| Quadrant | BADHDUFLAG | Total packets | Discarded packets |
| A | 0 | 134 | 0 |
| B | 0 | 134 | 0 |
| C | 0 | 134 | 0 |
| D | 0 | 134 | 0 |
| Mode M0 | |||
|---|---|---|---|
| Quadrant | BADHDUFLAG | Total packets | Discarded packets |
| A | 0 | 14625 | 2 |
| B | 0 | 21307 | 2 |
| C | 0 | 20827 | 2 |
| D | 0 | 20159 | 2 |
| Mode M9 | |||
|---|---|---|---|
| Quadrant | BADHDUFLAG | Total packets | Discarded packets |
| A | 0 | 19 | 0 |
| B | 0 | 20 | 0 |
| C | 0 | 20 | 0 |
| D | 0 | 20 | 0 |
| Quadrant | Total seconds | Saturated seconds | Saturation percentage |
|---|---|---|---|
| A | 6538 | 146 | 2.233099% |
| B | 6538 | 916 | 14.010401% |
| C | 6538 | 541 | 8.274702% |
| D | 6538 | 563 | 8.611196% |
Noise dominated data is calculated using 1-second bins in cleaned event files. If a bin has >2000 counts, and if more than 50% of those come from <1% of pixels, then it is considered to be noise-dominated and hence unusable.
| Quadrant | # 1 sec bins | Bins with >0 counts | Bins with >2000 counts | High rate bins dominated by noise | Noise dominated (total time) | Noise dominated (detector-on time) | Marked lightcurve |
|---|---|---|---|---|---|---|---|
| A | 7663 | 6538 | 62 | 62 | 0.81% | 0.95% | 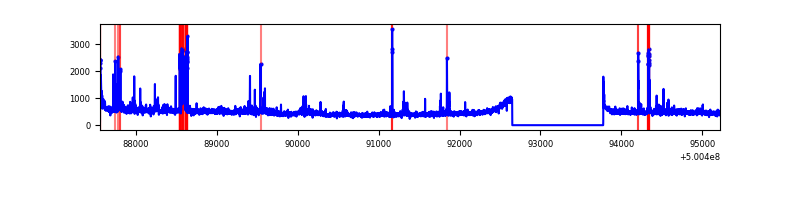 |
| B | 7663 | 6538 | 846 | 846 | 11.04% | 12.94% | 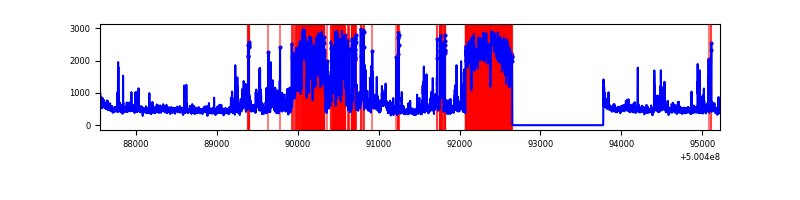 |
| C | 7663 | 6538 | 405 | 405 | 5.29% | 6.19% | 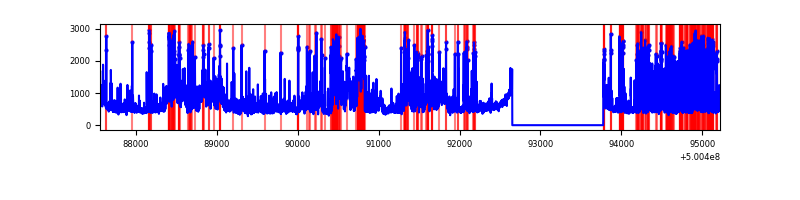 |
| D | 7662 | 6537 | 546 | 546 | 7.13% | 8.35% | 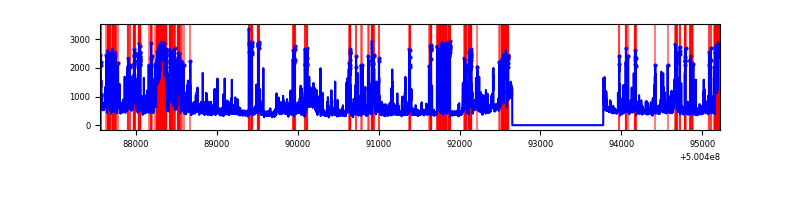 |
Top three noisy pixels from each quadrant. If the there are fewer than three noisy pixels in the level2.evt file, extra rows are filled as -1
| Pixel properties | Quadrant properties | ||||||
|---|---|---|---|---|---|---|---|
| Quadrant | DetID | PixID | Counts | Sigma | Mean | Median | Sigma |
| A | 3 | 14 | 285783 | 1612.21 | 721 | 705 | 176.8 |
| A | 4 | 249 | 152063 | 855.98 | 721 | 705 | 176.8 |
| A | 0 | 8 | 60281 | 336.92 | 721 | 705 | 176.8 |
| B | 2 | 249 | 2843852 | 20469.21 | 655 | 633 | 138.9 |
| B | 5 | 185 | 90677 | 648.25 | 655 | 633 | 138.9 |
| B | 0 | 213 | 54164 | 385.39 | 655 | 633 | 138.9 |
| C | 4 | 5 | 1033289 | 5548.54 | 676 | 670 | 186.1 |
| C | 13 | 3 | 525013 | 2817.44 | 676 | 670 | 186.1 |
| C | 12 | 252 | 474078 | 2543.75 | 676 | 670 | 186.1 |
| D | 11 | 129 | 947193 | 4919.79 | 673 | 643 | 192.4 |
| D | 3 | 12 | 481225 | 2497.87 | 673 | 643 | 192.4 |
| D | 2 | 120 | 478603 | 2484.25 | 673 | 643 | 192.4 |
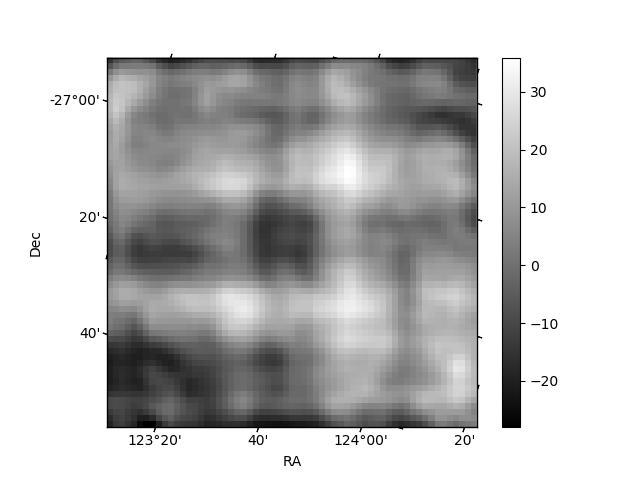
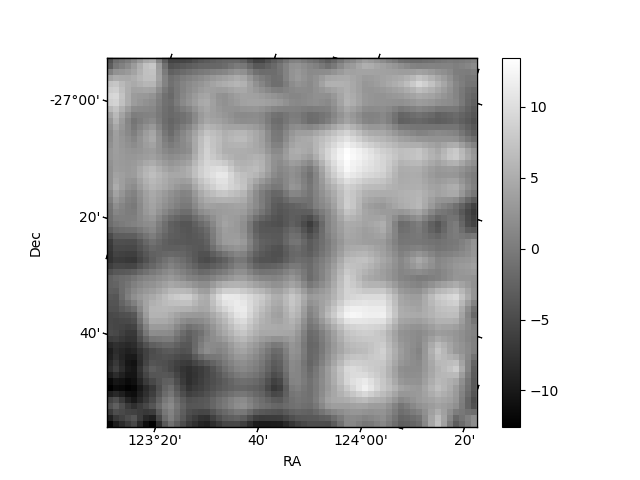
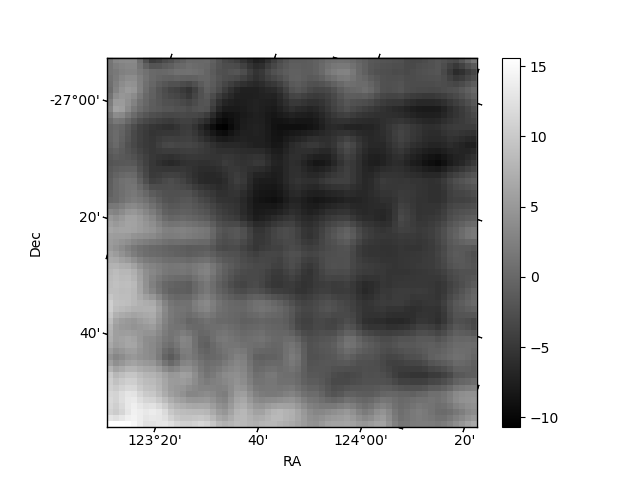
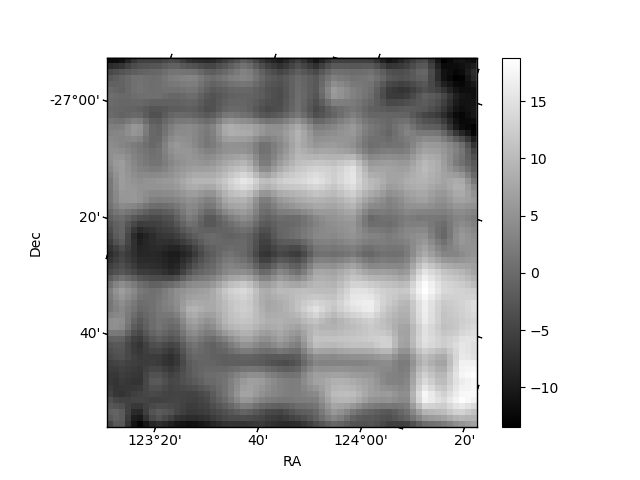
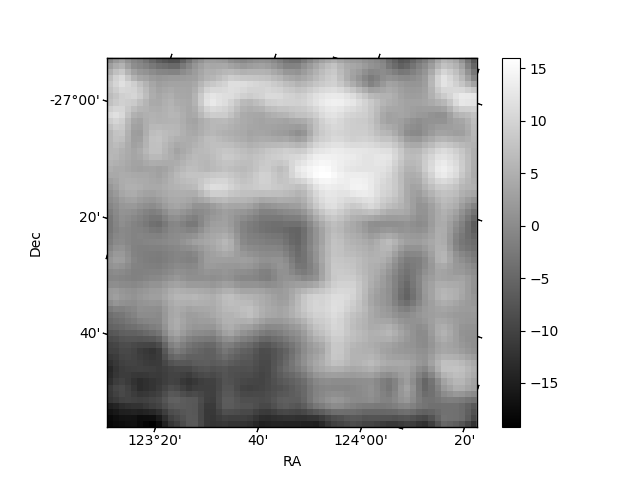
Histogram calculated using DETX and DETY for each event in the final _common_clean file
| Quadrant A | 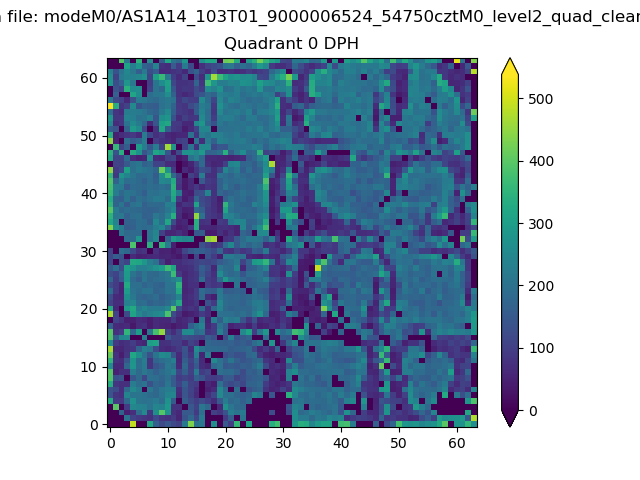 |
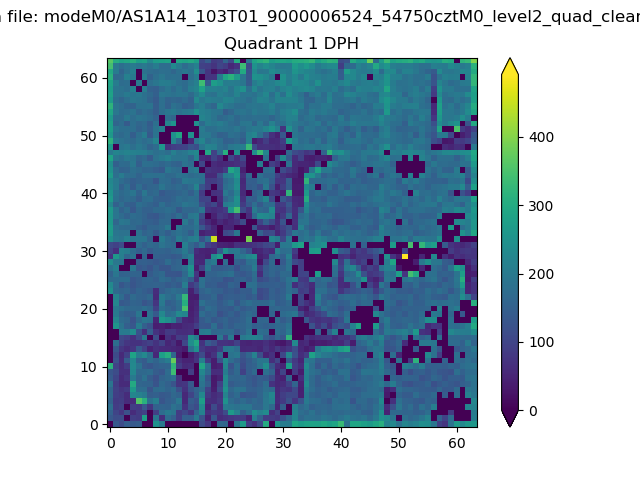 |
Quadrant B |
|---|---|---|---|
| Quadrant D | 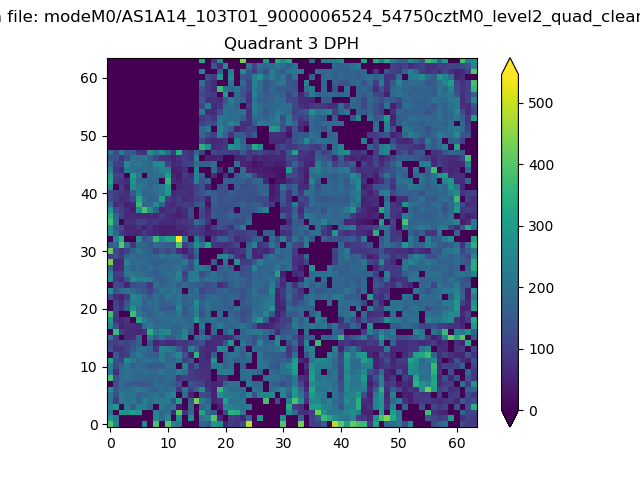 |
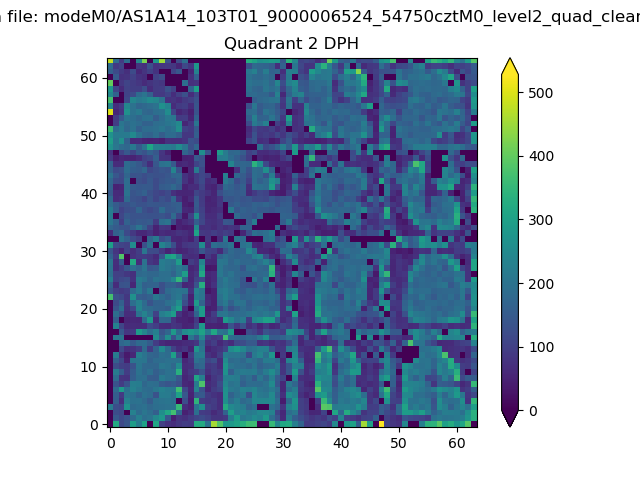 |
Quadrant C |
| Plot type | Count rate plots | Images |
|---|---|---|
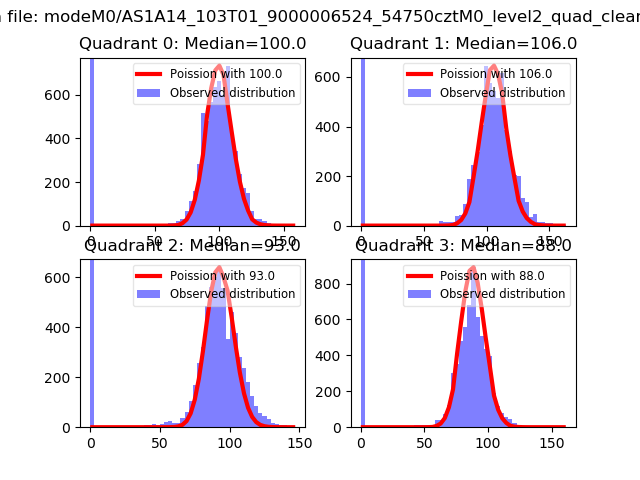
| Comparison with Poisson distribution Blue bars denote a histogram of data divided into 1 sec bins. Red curve is a Poisson curve with rate = median count rate of data. |
 |
 |
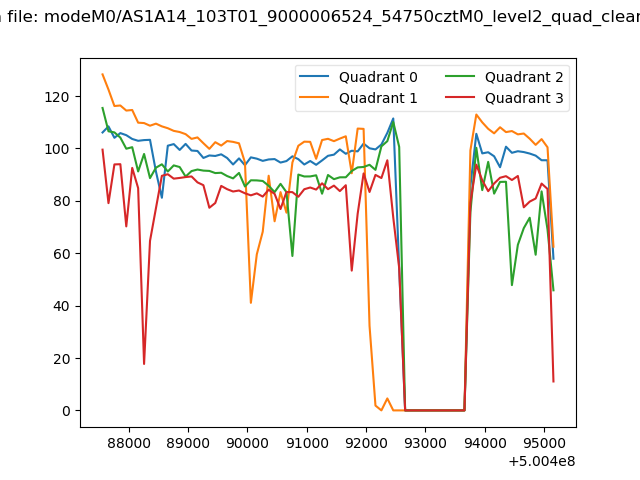
| Quadrant-wise count rates Data is divided into 100 sec bins |
 |
|
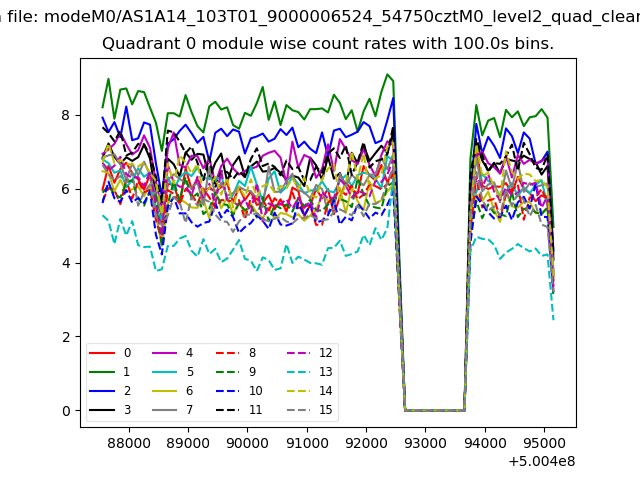
| Module-wise count rates for Quadrant A Data is divided into 100 sec bins |
 |
 |
| Module-wise count rates for Quadrant B Data is divided into 100 sec bins |
 |
 |
| Module-wise count rates for Quadrant C Data is divided into 100 sec bins |
 |
 |
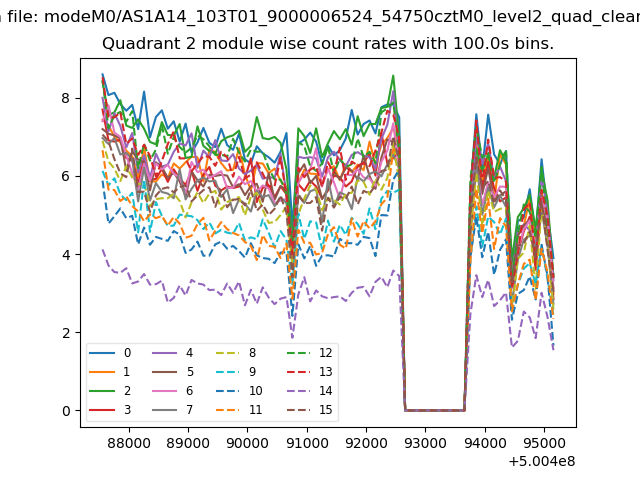
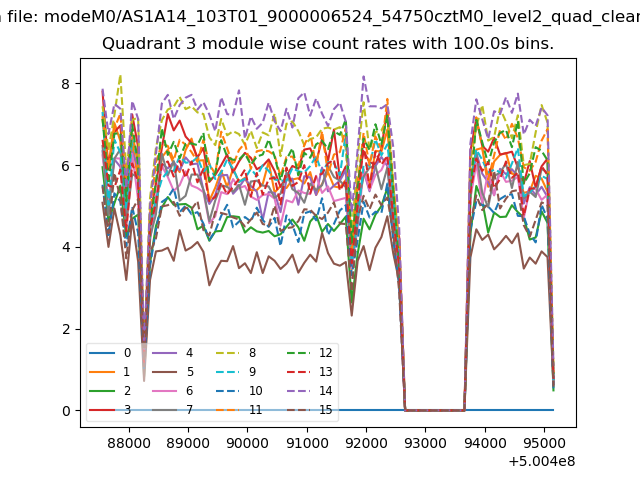
| Module-wise count rates for Quadrant D Data is divided into 100 sec bins |
 |
 |
| Parameter | Plot |
|---|---|
| CZT HV Monitor |  |
| D_VDD | 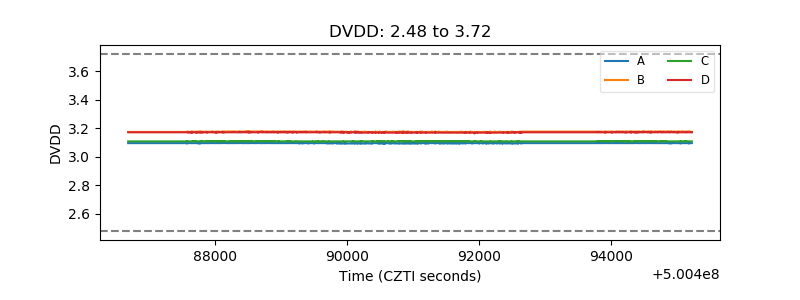 |
| Temperature 1 | 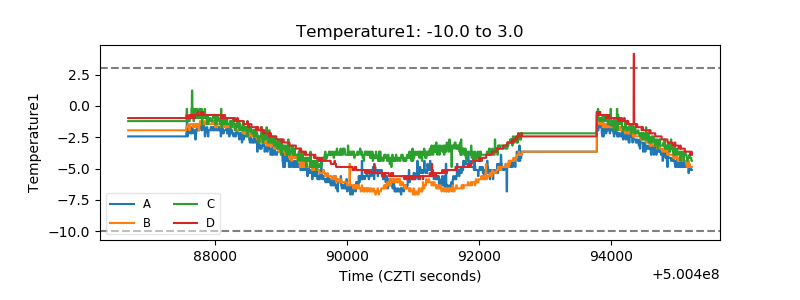 |
| Veto HV Monitor | 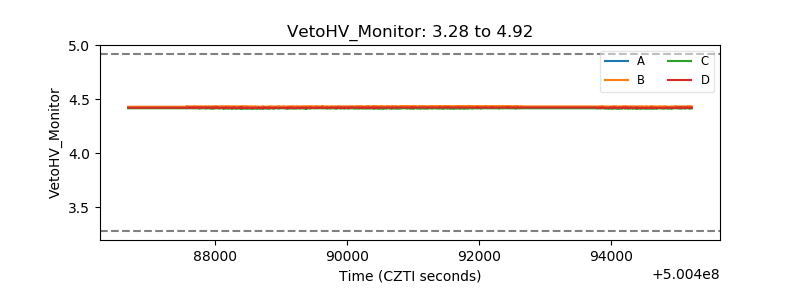 |
| Veto LLD | 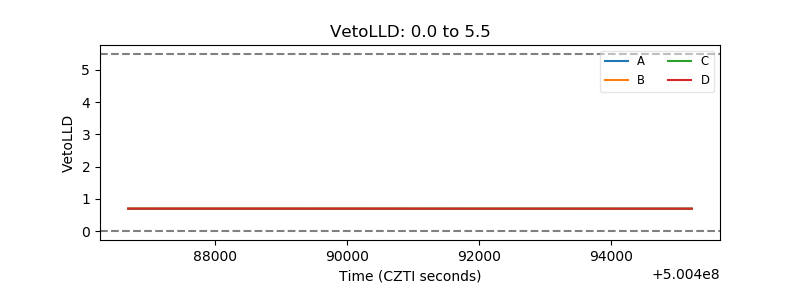 |
| Alpha Counter | 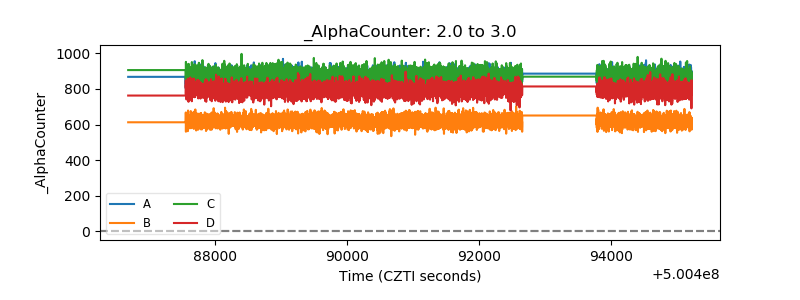 |
| _CPM_Rate | 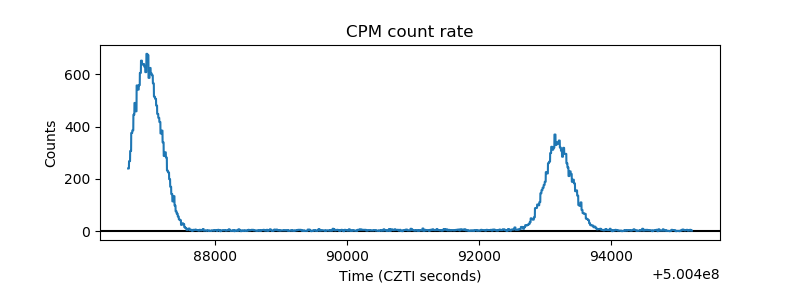 |
| CZT Counter | 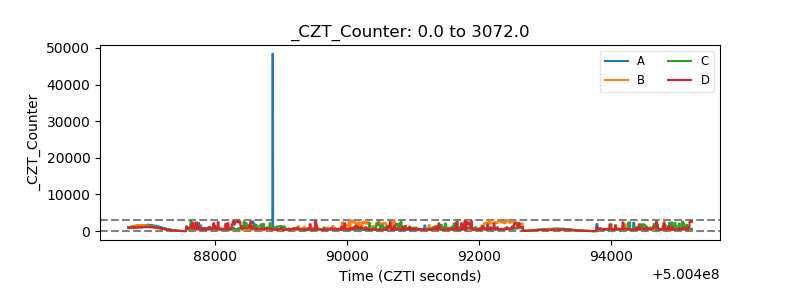 |
| +2.5 Volts monitor | 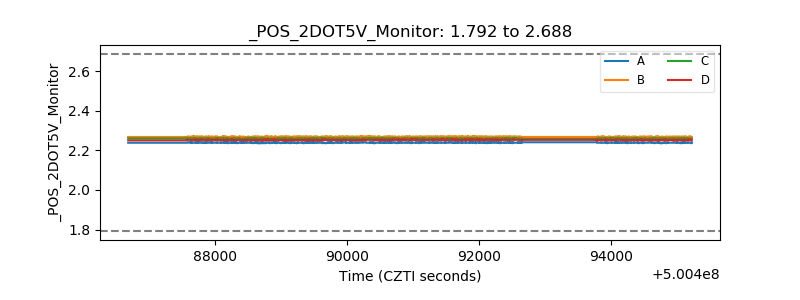 |
| +5 Volts monitor | 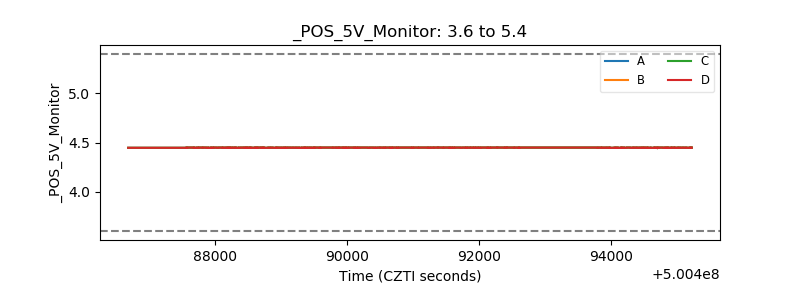 |
| _ROLL_ROT | 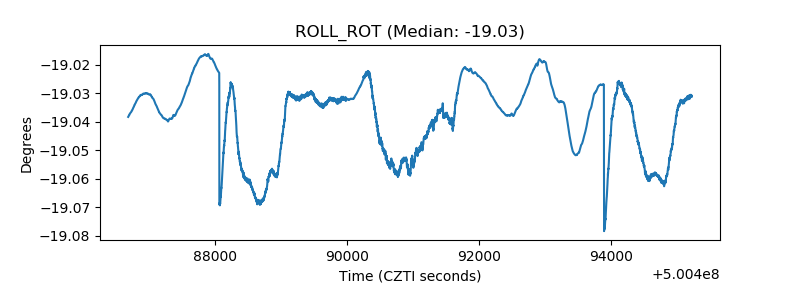 |
| _Roll_DEC | 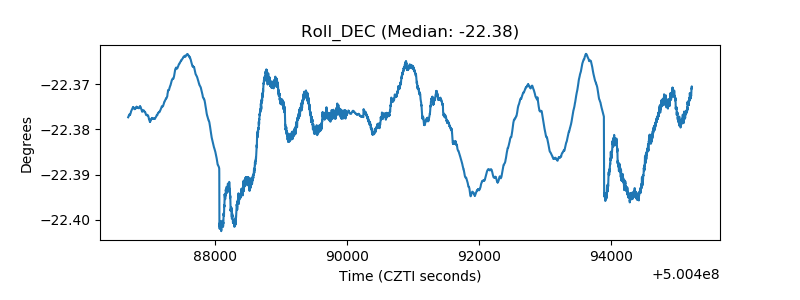 |
| _Roll_RA | 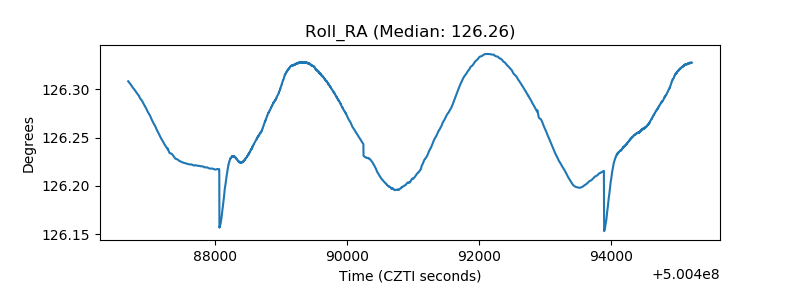 |
| Veto Counter | 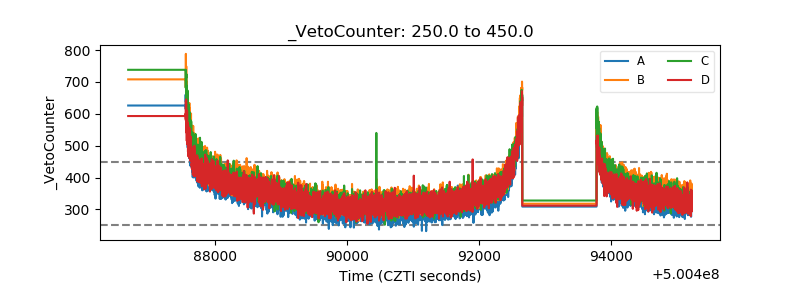 |