| Param | Original file | Final file |
|---|---|---|
| Filename | modeM0/AS1A14_103T01_9000006524_54751cztM0_level2.fits | modeM0/AS1A14_103T01_9000006524_54751cztM0_level2_quad_clean.evt |
| Size (bytes) | 505,923,840 | 96,344,640 |
| Size | 482.5 MB | 91.9 MB |
| Events in quadrant A | 3,330,674 | 648,567 |
| Events in quadrant B | 5,086,499 | 664,714 |
| Events in quadrant C | 5,108,707 | 566,091 |
| Events in quadrant D | 4,671,762 | 562,254 |
| Mode SS | |||
|---|---|---|---|
| Quadrant | BADHDUFLAG | Total packets | Discarded packets |
| A | 0 | 140 | 0 |
| B | 0 | 140 | 0 |
| C | 0 | 140 | 0 |
| D | 0 | 140 | 0 |
| Mode M0 | |||
|---|---|---|---|
| Quadrant | BADHDUFLAG | Total packets | Discarded packets |
| A | 0 | 14828 | 2 |
| B | 0 | 19682 | 2 |
| C | 0 | 20176 | 2 |
| D | 0 | 18877 | 2 |
| Mode M9 | |||
|---|---|---|---|
| Quadrant | BADHDUFLAG | Total packets | Discarded packets |
| A | 0 | 17 | 0 |
| B | 0 | 17 | 0 |
| C | 0 | 18 | 0 |
| D | 0 | 18 | 0 |
| Quadrant | Total seconds | Saturated seconds | Saturation percentage |
|---|---|---|---|
| A | 6819 | 119 | 1.745124% |
| B | 6819 | 504 | 7.391113% |
| C | 6818 | 775 | 11.366970% |
| D | 6818 | 397 | 5.822822% |
Noise dominated data is calculated using 1-second bins in cleaned event files. If a bin has >2000 counts, and if more than 50% of those come from <1% of pixels, then it is considered to be noise-dominated and hence unusable.
| Quadrant | # 1 sec bins | Bins with >0 counts | Bins with >2000 counts | High rate bins dominated by noise | Noise dominated (total time) | Noise dominated (detector-on time) | Marked lightcurve |
|---|---|---|---|---|---|---|---|
| A | 7654 | 6819 | 22 | 22 | 0.29% | 0.32% | 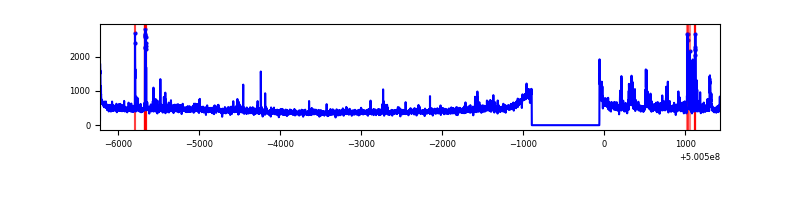 |
| B | 7654 | 6819 | 361 | 361 | 4.72% | 5.29% | 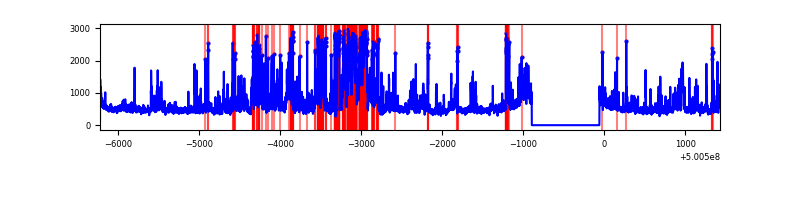 |
| C | 7653 | 6819 | 511 | 511 | 6.68% | 7.49% | 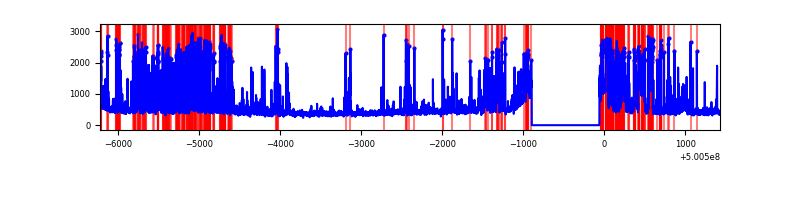 |
| D | 7653 | 6818 | 351 | 351 | 4.59% | 5.15% | 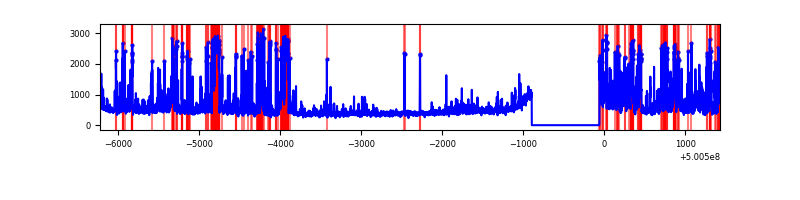 |
Top three noisy pixels from each quadrant. If the there are fewer than three noisy pixels in the level2.evt file, extra rows are filled as -1
| Pixel properties | Quadrant properties | ||||||
|---|---|---|---|---|---|---|---|
| Quadrant | DetID | PixID | Counts | Sigma | Mean | Median | Sigma |
| A | 3 | 14 | 144462 | 787.01 | 738 | 719 | 182.6 |
| A | 0 | 8 | 119303 | 649.26 | 738 | 719 | 182.6 |
| A | 12 | 115 | 87833 | 476.96 | 738 | 719 | 182.6 |
| B | 2 | 249 | 1832016 | 11950.88 | 715 | 692 | 153.2 |
| B | 0 | 213 | 155714 | 1011.64 | 715 | 692 | 153.2 |
| B | 5 | 185 | 91792 | 594.5 | 715 | 692 | 153.2 |
| C | 4 | 5 | 1260490 | 6854.52 | 676 | 671 | 183.8 |
| C | 9 | 38 | 355684 | 1931.58 | 676 | 671 | 183.8 |
| C | 12 | 252 | 263357 | 1429.24 | 676 | 671 | 183.8 |
| D | 11 | 129 | 780251 | 3899.95 | 698 | 668 | 199.9 |
| D | 3 | 12 | 712182 | 3559.43 | 698 | 668 | 199.9 |
| D | 6 | 239 | 156496 | 779.55 | 698 | 668 | 199.9 |
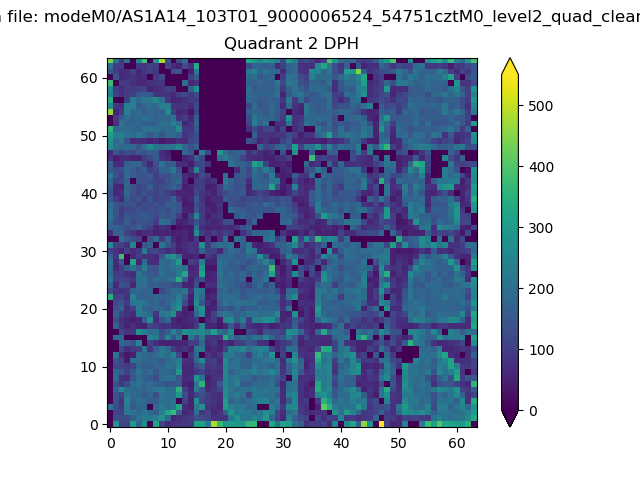
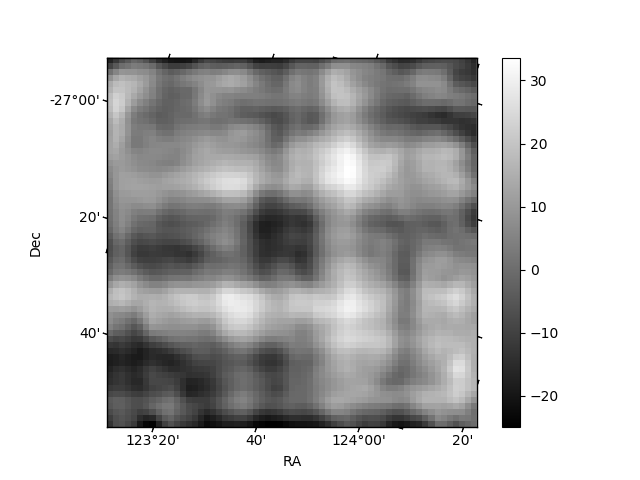
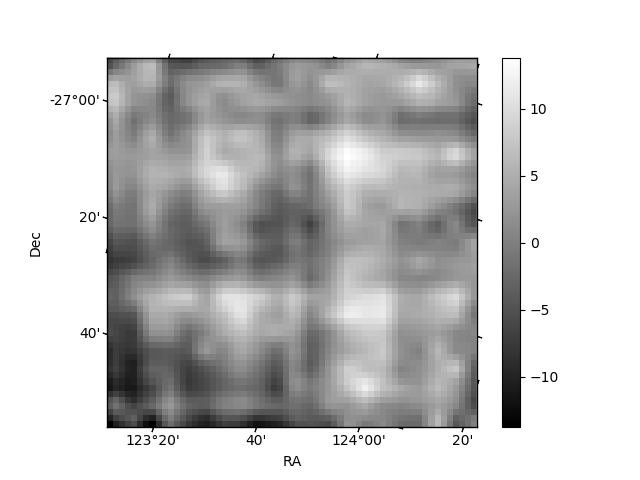
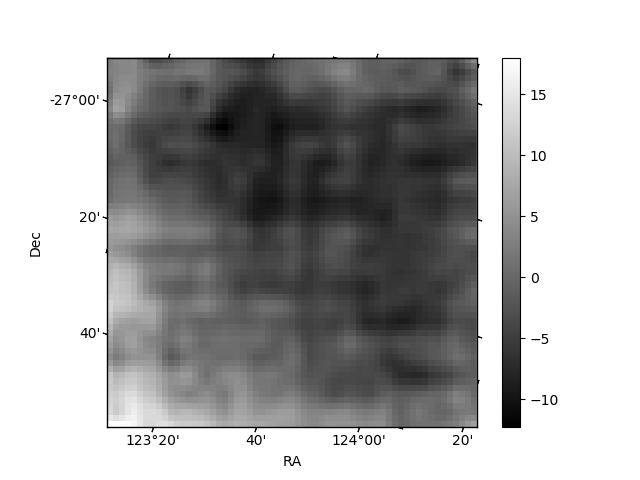
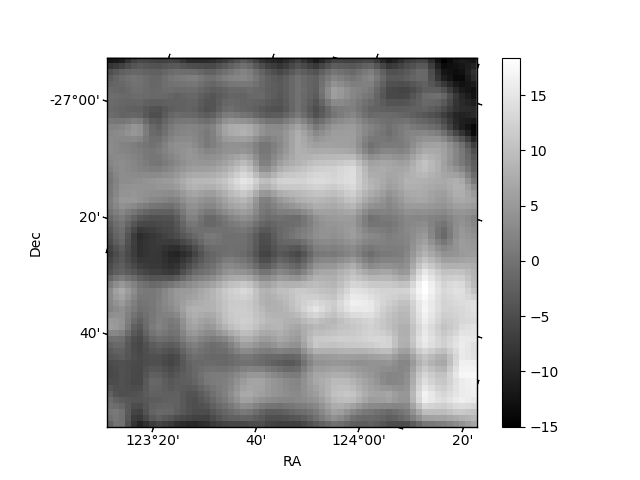
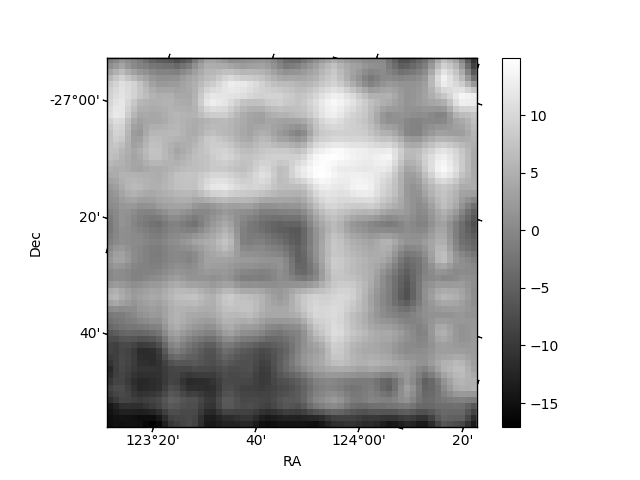
Histogram calculated using DETX and DETY for each event in the final _common_clean file
| Quadrant A | 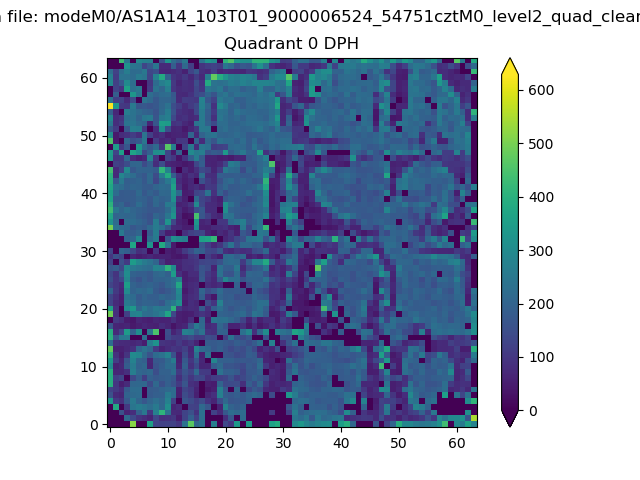 |
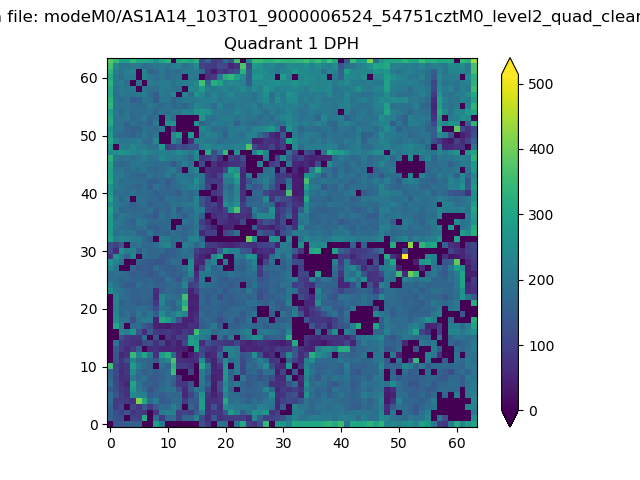 |
Quadrant B |
|---|---|---|---|
| Quadrant D | 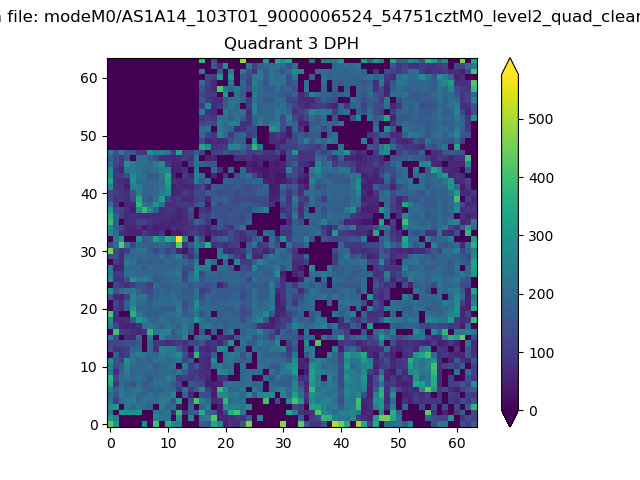 |
 |
Quadrant C |
| Plot type | Count rate plots | Images |
|---|---|---|
| Comparison with Poisson distribution Blue bars denote a histogram of data divided into 1 sec bins. Red curve is a Poisson curve with rate = median count rate of data. |
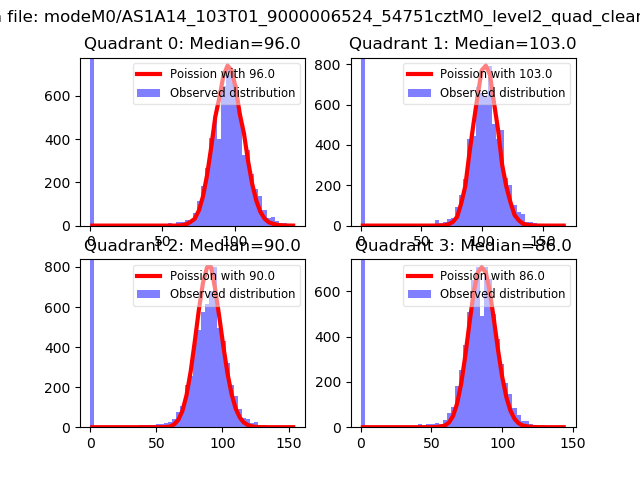 |
 |
| Quadrant-wise count rates Data is divided into 100 sec bins |
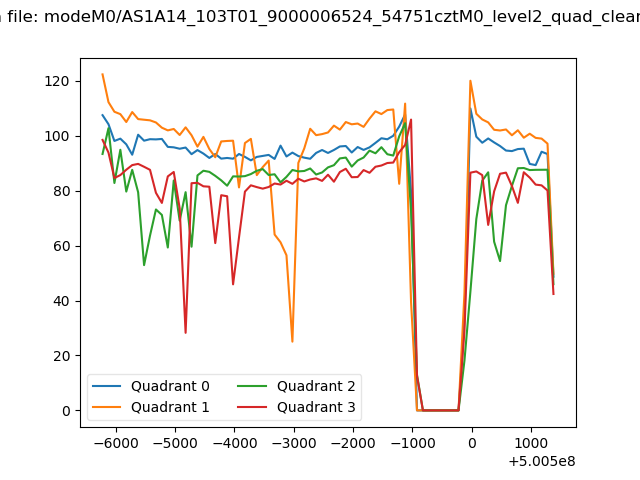 |
|
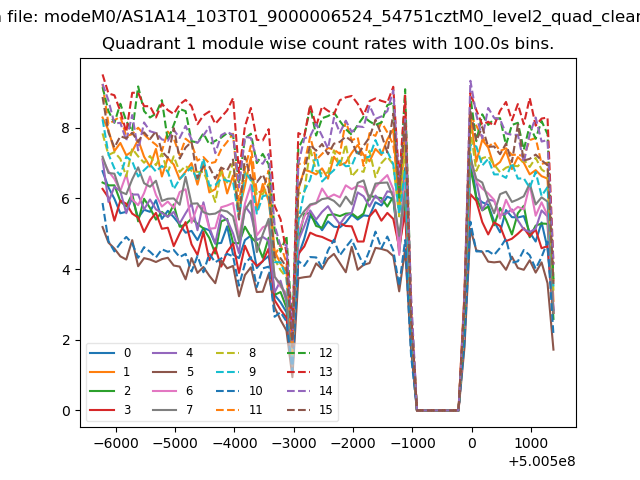
| Module-wise count rates for Quadrant A Data is divided into 100 sec bins |
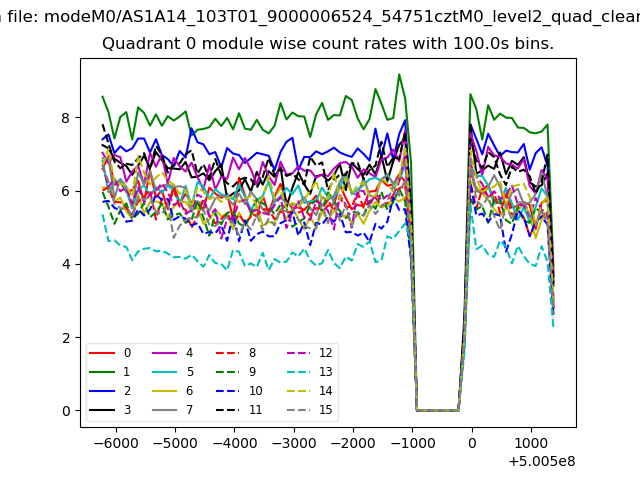 |
 |
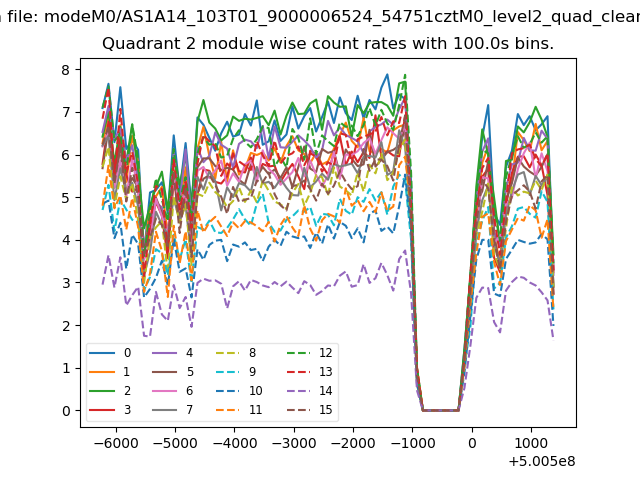
| Module-wise count rates for Quadrant B Data is divided into 100 sec bins |
 |
 |
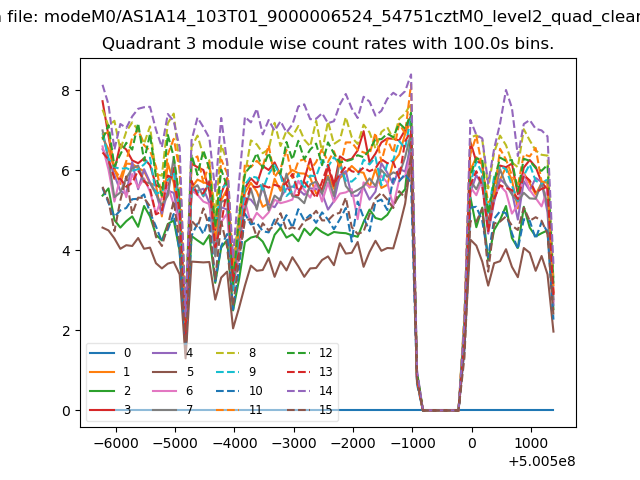
| Module-wise count rates for Quadrant C Data is divided into 100 sec bins |
 |
 |
| Module-wise count rates for Quadrant D Data is divided into 100 sec bins |
 |
 |
| Parameter | Plot |
|---|---|
| CZT HV Monitor | 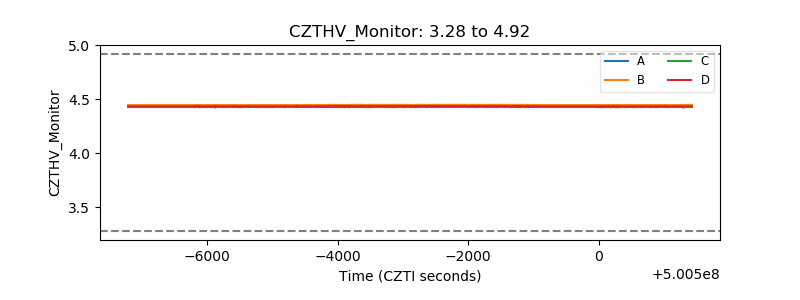 |
| D_VDD | 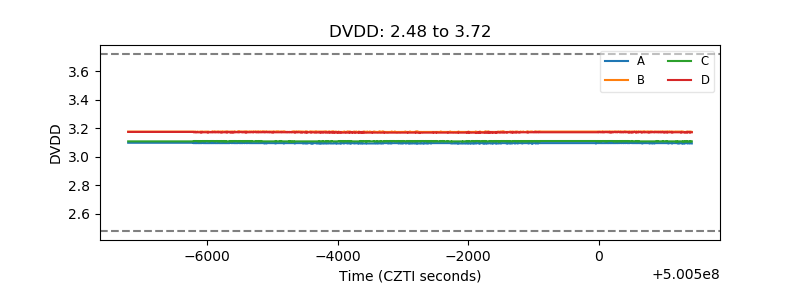 |
| Temperature 1 | 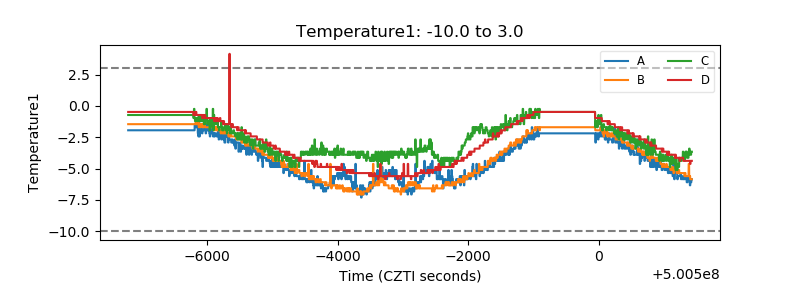 |
| Veto HV Monitor |  |
| Veto LLD | 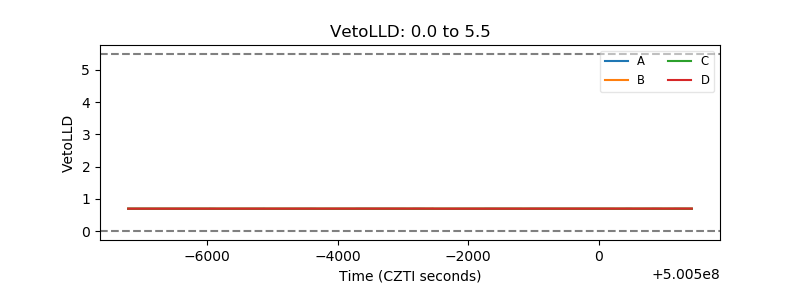 |
| Alpha Counter | 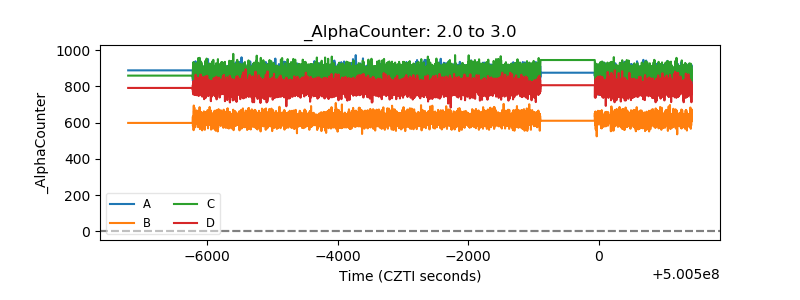 |
| _CPM_Rate | 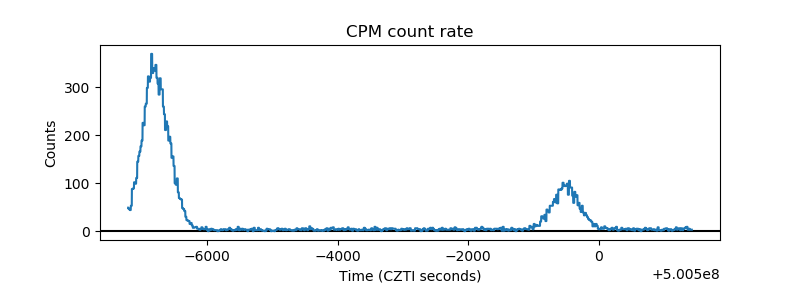 |
| CZT Counter | 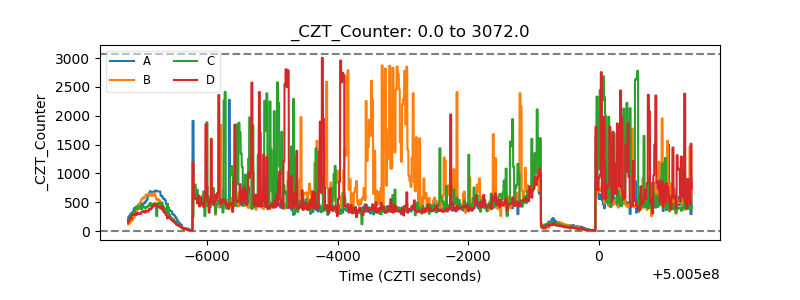 |
| +2.5 Volts monitor |  |
| +5 Volts monitor |  |
| _ROLL_ROT | 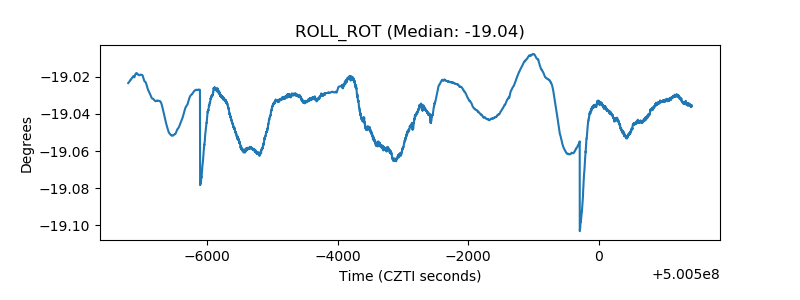 |
| _Roll_DEC | 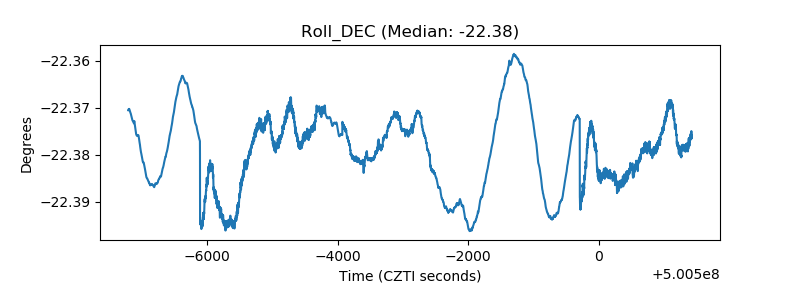 |
| _Roll_RA | 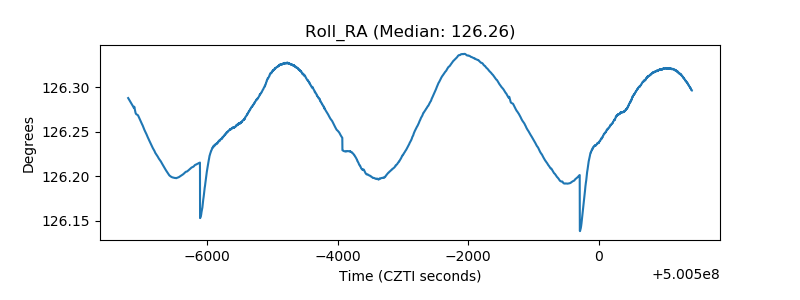 |
| Veto Counter | 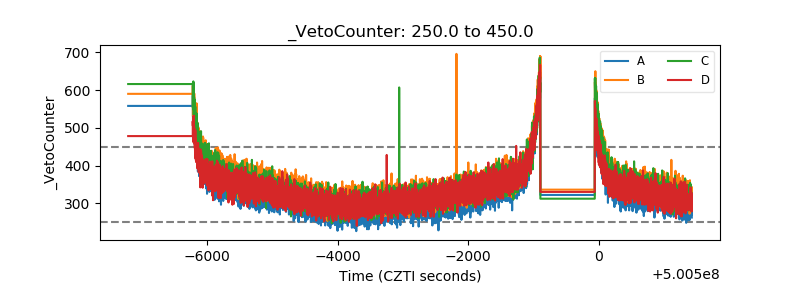 |