| Param | Original file | Final file |
|---|---|---|
| Filename | modeM0/AS1A14_103T01_9000006524_54753cztM0_level2.fits | modeM0/AS1A14_103T01_9000006524_54753cztM0_level2_quad_clean.evt |
| Size (bytes) | 578,502,720 | 111,291,840 |
| Size | 551.7 MB | 106.1 MB |
| Events in quadrant A | 3,795,887 | 740,940 |
| Events in quadrant B | 7,096,158 | 721,104 |
| Events in quadrant C | 4,915,589 | 694,191 |
| Events in quadrant D | 4,989,554 | 660,563 |
| Mode SS | |||
|---|---|---|---|
| Quadrant | BADHDUFLAG | Total packets | Discarded packets |
| A | 0 | 160 | 0 |
| B | 0 | 160 | 0 |
| C | 0 | 160 | 0 |
| D | 0 | 160 | 0 |
| Mode M0 | |||
|---|---|---|---|
| Quadrant | BADHDUFLAG | Total packets | Discarded packets |
| A | 0 | 17293 | 1 |
| B | 0 | 26555 | 1 |
| C | 0 | 20375 | 1 |
| D | 0 | 20602 | 1 |
| Mode M9 | |||
|---|---|---|---|
| Quadrant | BADHDUFLAG | Total packets | Discarded packets |
| A | 1 | 139938439325736 | 139934329471022 |
| B | 1 | -1 | -1 |
| C | 1 | -1 | -1 |
| D | 1 | -1 | -1 |
| Quadrant | Total seconds | Saturated seconds | Saturation percentage |
|---|---|---|---|
| A | 7952 | 81 | 1.018612% |
| B | 7952 | 958 | 12.047284% |
| C | 7952 | 269 | 3.382797% |
| D | 7952 | 146 | 1.836016% |
Noise dominated data is calculated using 1-second bins in cleaned event files. If a bin has >2000 counts, and if more than 50% of those come from <1% of pixels, then it is considered to be noise-dominated and hence unusable.
| Quadrant | # 1 sec bins | Bins with >0 counts | Bins with >2000 counts | High rate bins dominated by noise | Noise dominated (total time) | Noise dominated (detector-on time) | Marked lightcurve |
|---|---|---|---|---|---|---|---|
| A | 7951 | 7951 | 53 | 53 | 0.67% | 0.67% | 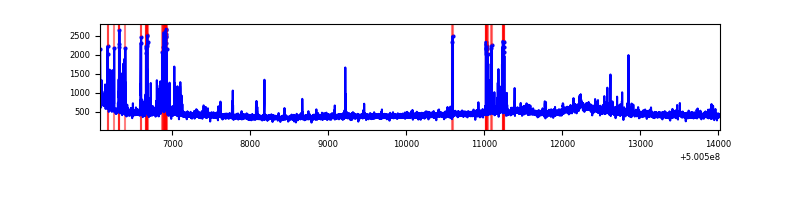 |
| B | 7951 | 7951 | 861 | 861 | 10.83% | 10.83% | 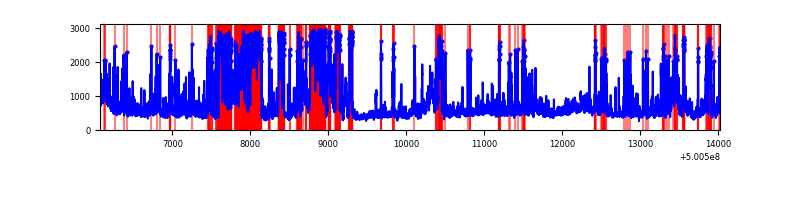 |
| C | 7951 | 7951 | 276 | 276 | 3.47% | 3.47% | 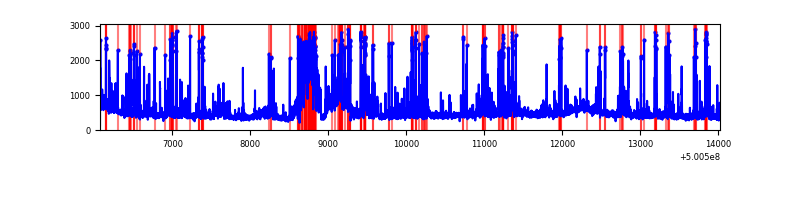 |
| D | 7951 | 7951 | 135 | 135 | 1.70% | 1.70% | 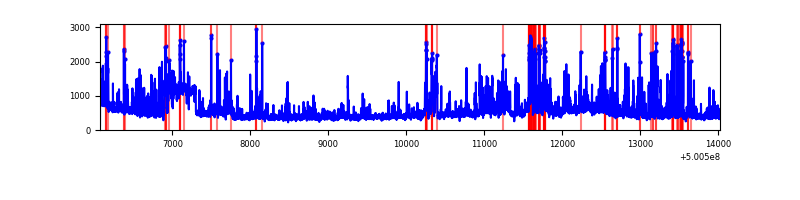 |
Top three noisy pixels from each quadrant. If the there are fewer than three noisy pixels in the level2.evt file, extra rows are filled as -1
| Pixel properties | Quadrant properties | ||||||
|---|---|---|---|---|---|---|---|
| Quadrant | DetID | PixID | Counts | Sigma | Mean | Median | Sigma |
| A | 0 | 8 | 108899 | 513.76 | 840 | 820 | 210.4 |
| A | 3 | 114 | 101623 | 479.17 | 840 | 820 | 210.4 |
| A | 3 | 14 | 92959 | 437.99 | 840 | 820 | 210.4 |
| B | 2 | 249 | 2825634 | 16511.35 | 793 | 765 | 171.1 |
| B | 0 | 213 | 390758 | 2279.51 | 793 | 765 | 171.1 |
| B | 5 | 185 | 357943 | 2087.7 | 793 | 765 | 171.1 |
| C | 4 | 5 | 860139 | 3833.14 | 811 | 802 | 224.2 |
| C | 13 | 3 | 540623 | 2407.91 | 811 | 802 | 224.2 |
| C | 6 | 223 | 85102 | 376.03 | 811 | 802 | 224.2 |
| D | 11 | 129 | 864811 | 3744.94 | 807 | 771 | 230.7 |
| D | 10 | 181 | 405333 | 1753.46 | 807 | 771 | 230.7 |
| D | 6 | 239 | 167917 | 724.45 | 807 | 771 | 230.7 |
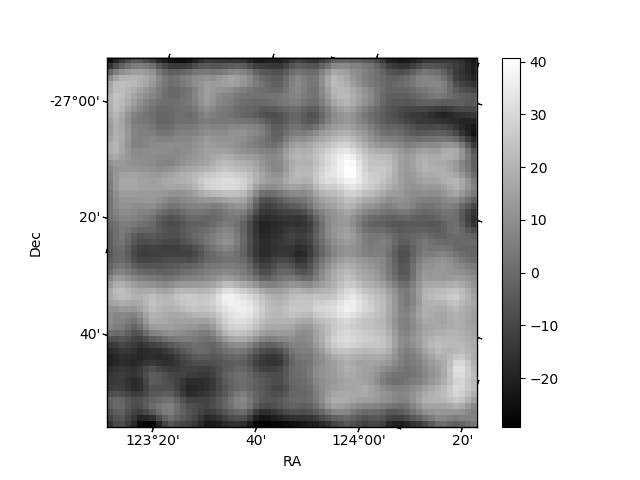
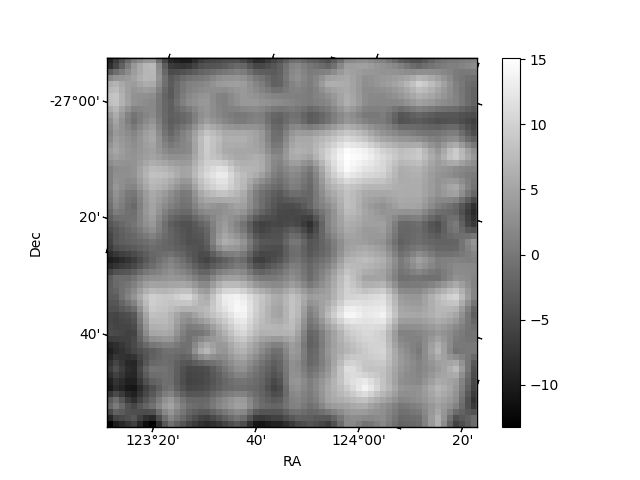
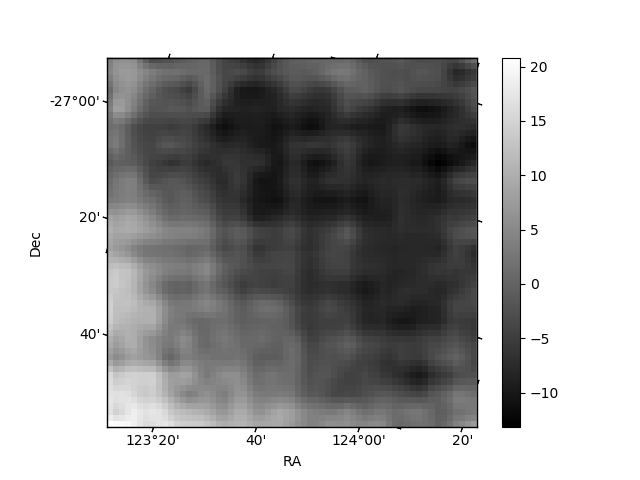
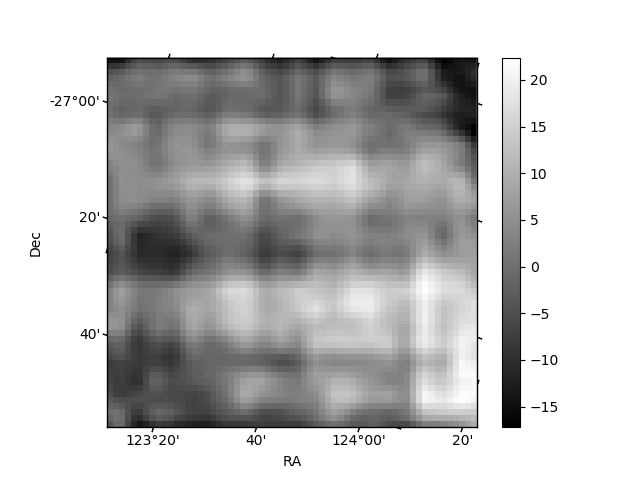
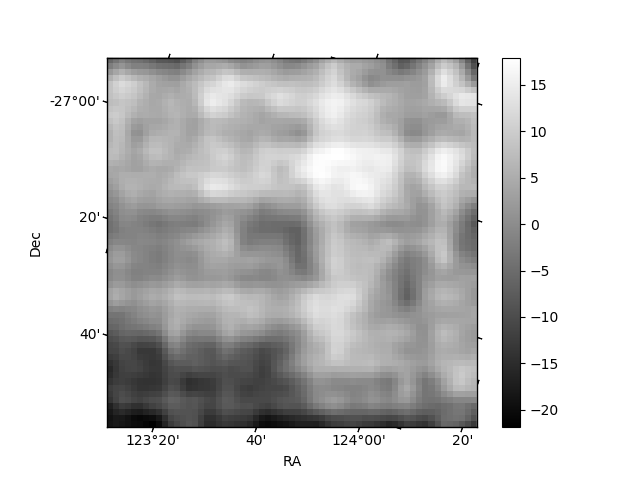
Histogram calculated using DETX and DETY for each event in the final _common_clean file
| Quadrant A | 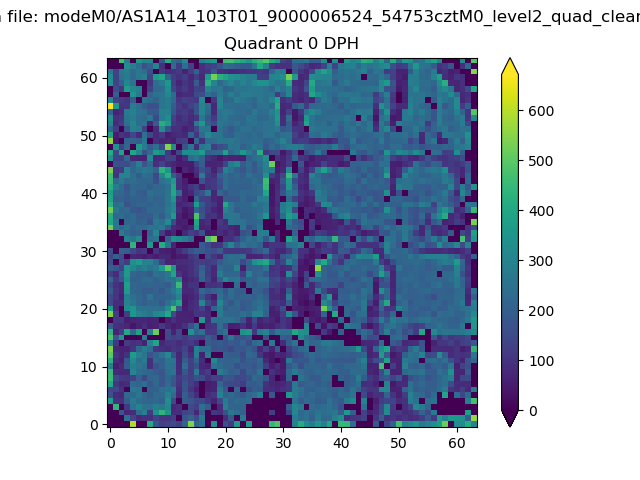 |
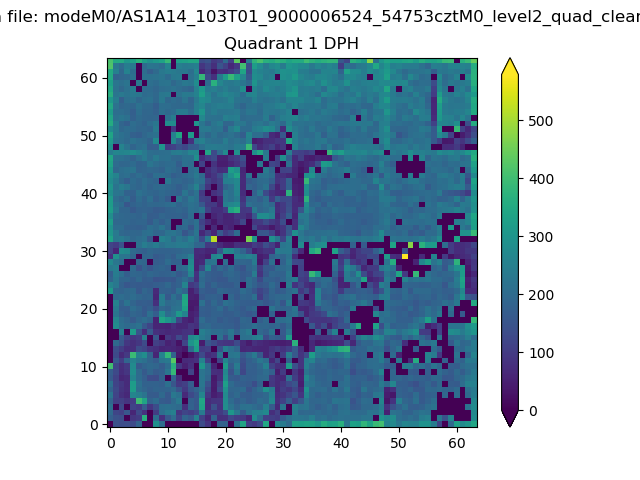 |
Quadrant B |
|---|---|---|---|
| Quadrant D | 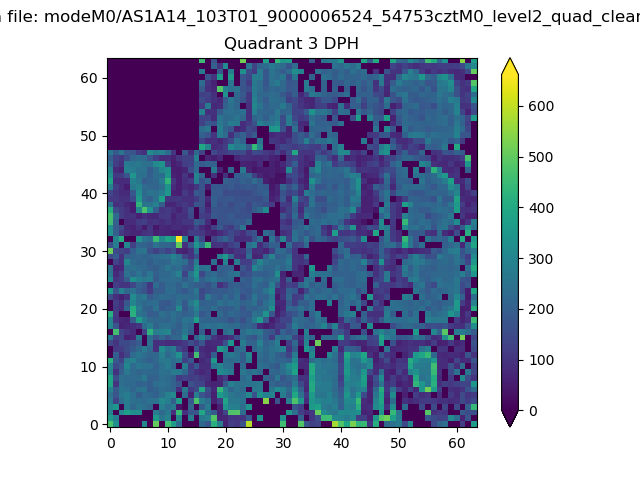 |
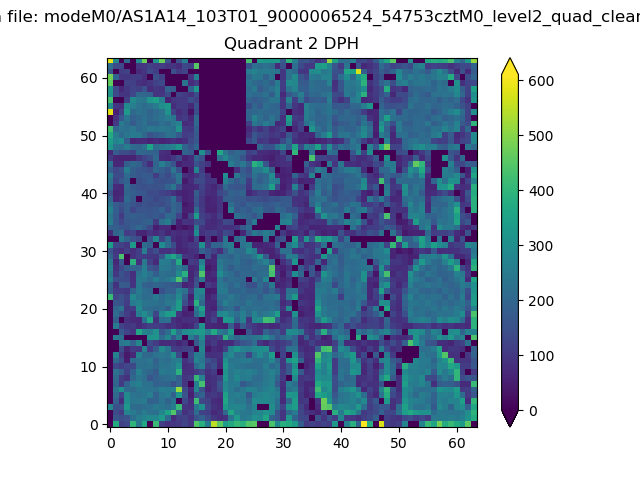 |
Quadrant C |
| Plot type | Count rate plots | Images |
|---|---|---|
| Comparison with Poisson distribution Blue bars denote a histogram of data divided into 1 sec bins. Red curve is a Poisson curve with rate = median count rate of data. |
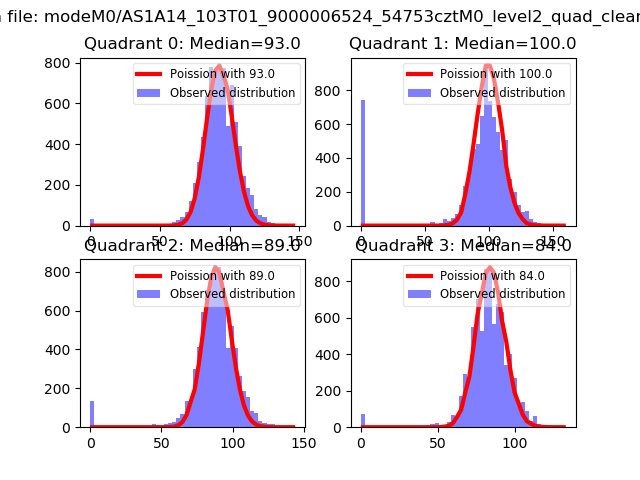 |
 |
| Quadrant-wise count rates Data is divided into 100 sec bins |
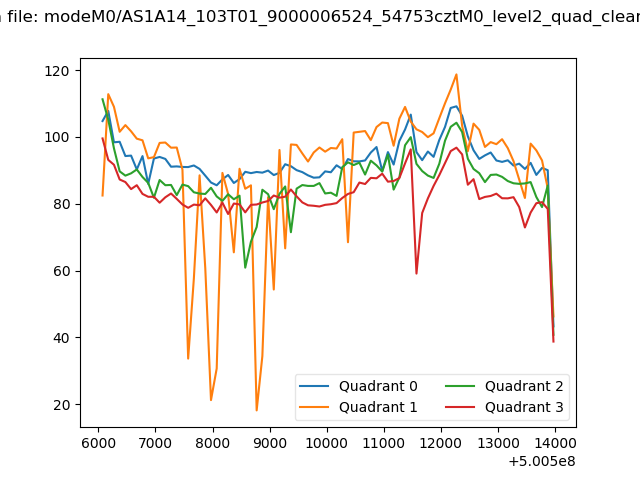 |
|
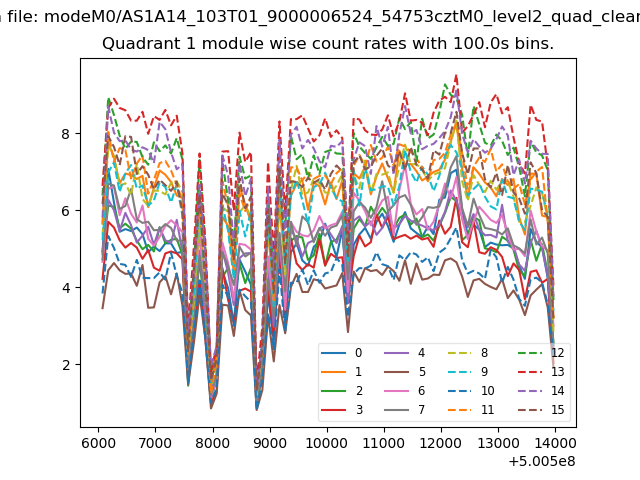
| Module-wise count rates for Quadrant A Data is divided into 100 sec bins |
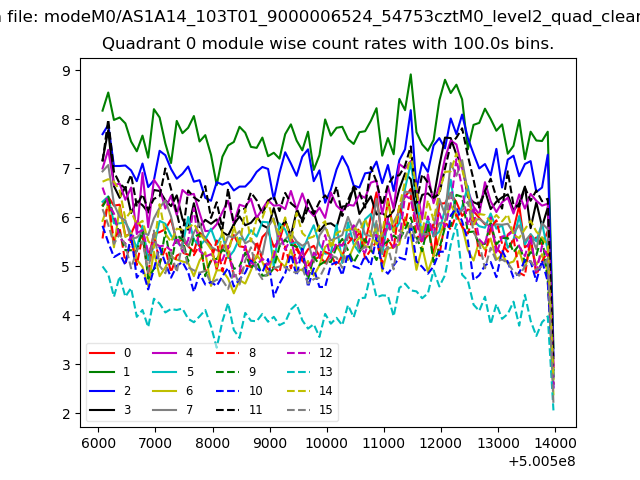 |
 |
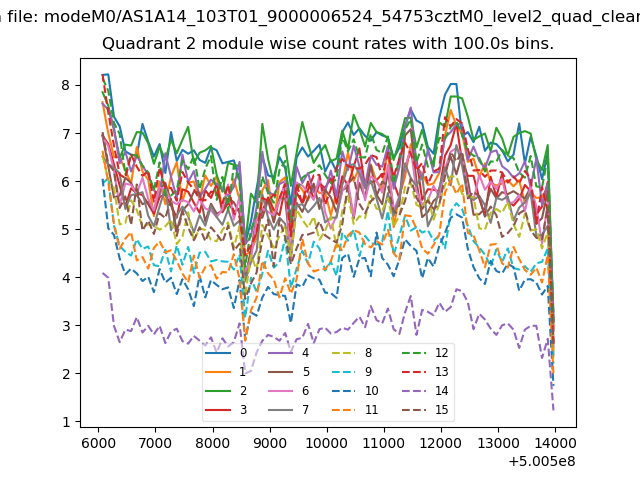
| Module-wise count rates for Quadrant B Data is divided into 100 sec bins |
 |
 |
| Module-wise count rates for Quadrant C Data is divided into 100 sec bins |
 |
 |
| Module-wise count rates for Quadrant D Data is divided into 100 sec bins |
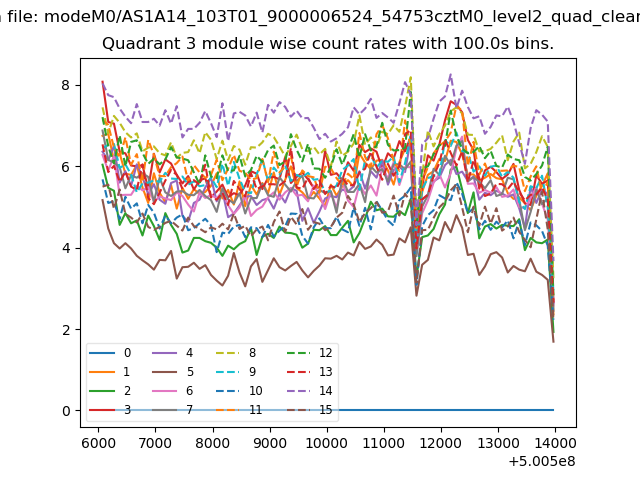 |
 |
| Parameter | Plot |
|---|---|
| CZT HV Monitor | 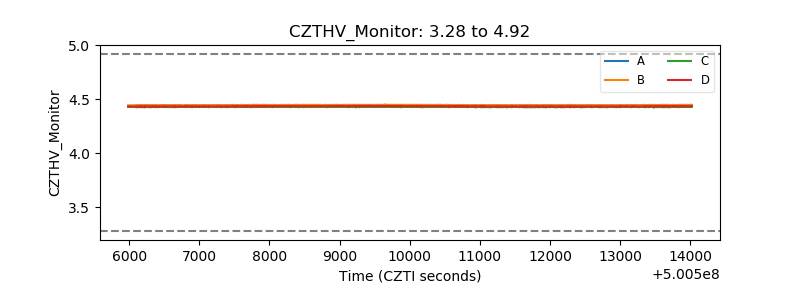 |
| D_VDD | 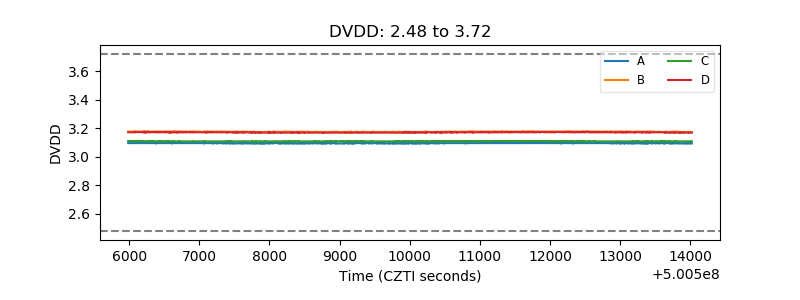 |
| Temperature 1 | 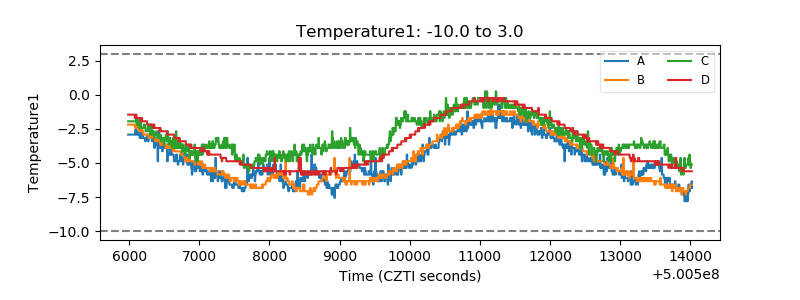 |
| Veto HV Monitor | 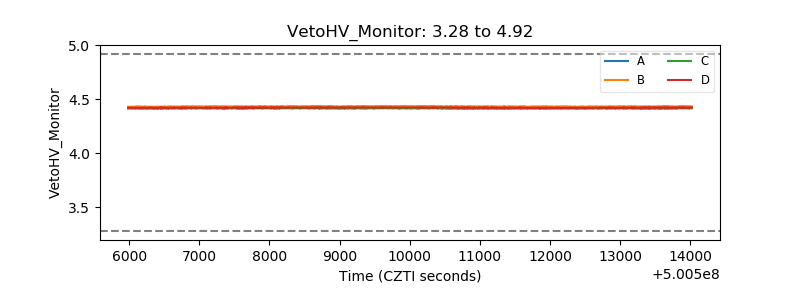 |
| Veto LLD | 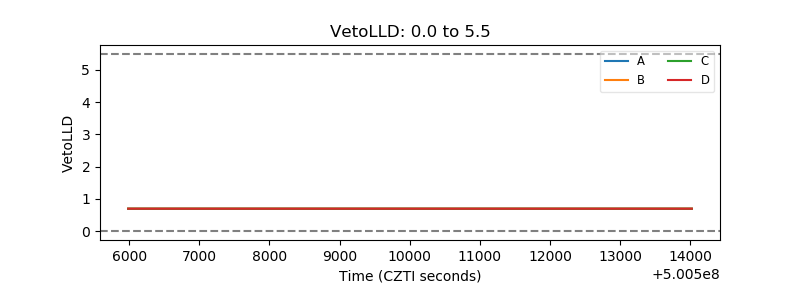 |
| Alpha Counter | 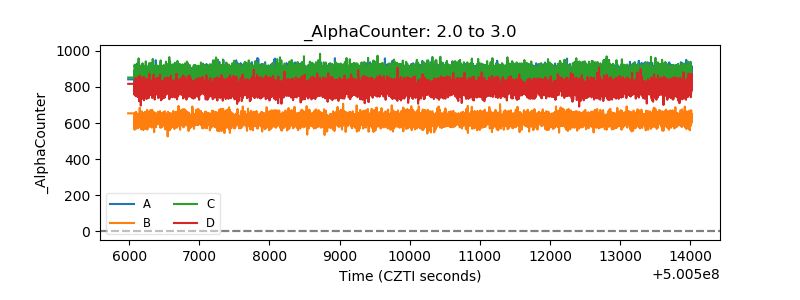 |
| _CPM_Rate | 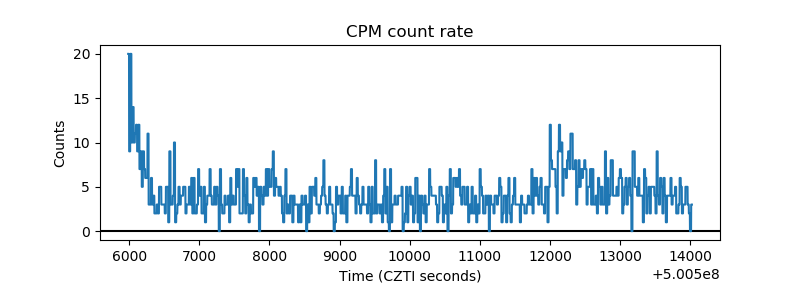 |
| CZT Counter | 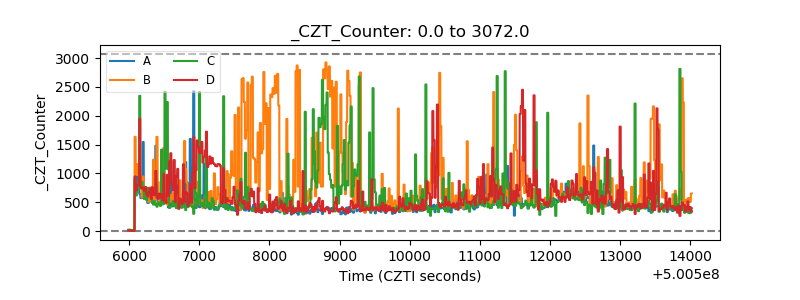 |
| +2.5 Volts monitor | 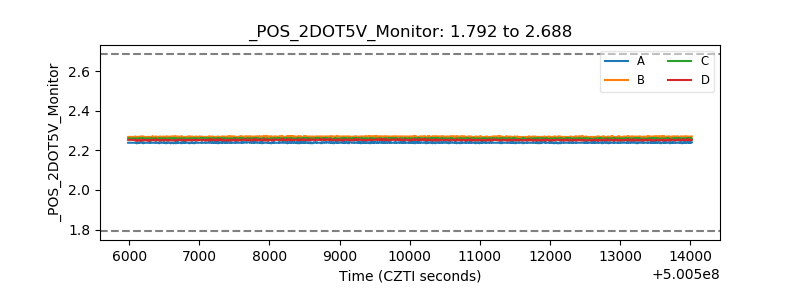 |
| +5 Volts monitor |  |
| _ROLL_ROT | 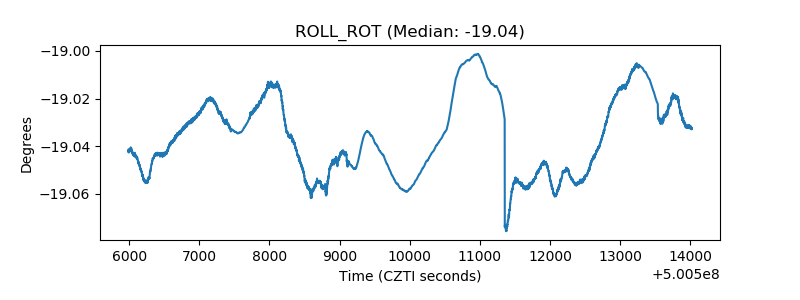 |
| _Roll_DEC | 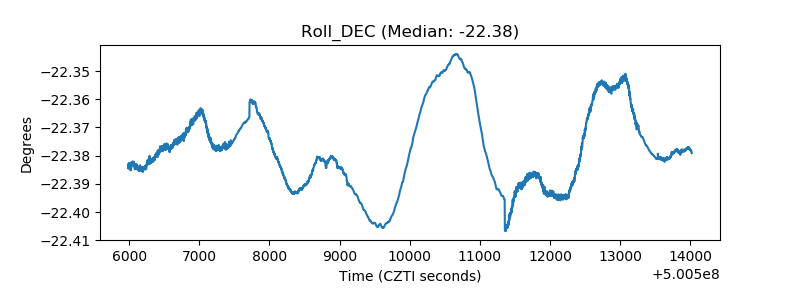 |
| _Roll_RA | 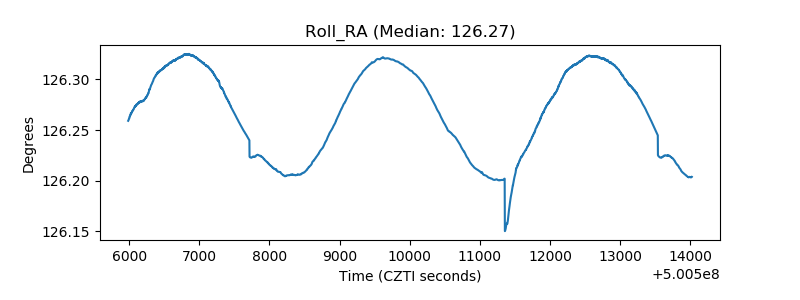 |
| Veto Counter | 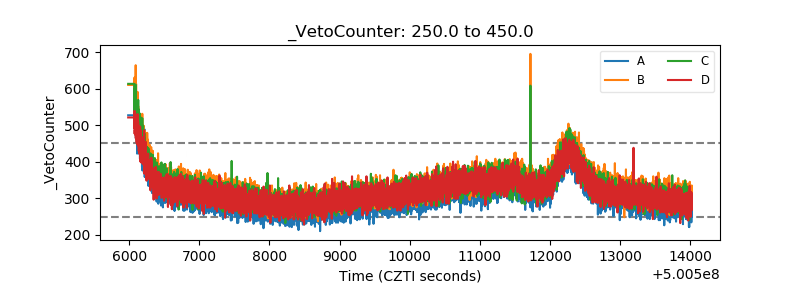 |