| Param | Original file | Final file |
|---|---|---|
| Filename | modeM0/AS1A14_103T01_9000006524_54758cztM0_level2.fits | modeM0/AS1A14_103T01_9000006524_54758cztM0_level2_quad_clean.evt |
| Size (bytes) | 503,392,320 | 97,632,000 |
| Size | 480.1 MB | 93.1 MB |
| Events in quadrant A | 3,365,826 | 655,039 |
| Events in quadrant B | 4,773,414 | 692,064 |
| Events in quadrant C | 5,756,911 | 543,037 |
| Events in quadrant D | 4,193,545 | 578,107 |
| Mode SS | |||
|---|---|---|---|
| Quadrant | BADHDUFLAG | Total packets | Discarded packets |
| A | 0 | 140 | 0 |
| B | 0 | 140 | 0 |
| C | 0 | 140 | 0 |
| D | 0 | 140 | 0 |
| Mode M0 | |||
|---|---|---|---|
| Quadrant | BADHDUFLAG | Total packets | Discarded packets |
| A | 0 | 15095 | 0 |
| B | 0 | 19071 | 0 |
| C | 0 | 22300 | 6 |
| D | 0 | 17498 | 0 |
| Quadrant | Total seconds | Saturated seconds | Saturation percentage |
|---|---|---|---|
| A | 7004 | 21 | 0.299829% |
| B | 7005 | 242 | 3.454675% |
| C | 7004 | 1009 | 14.406054% |
| D | 7004 | 157 | 2.241576% |
Noise dominated data is calculated using 1-second bins in cleaned event files. If a bin has >2000 counts, and if more than 50% of those come from <1% of pixels, then it is considered to be noise-dominated and hence unusable.
| Quadrant | # 1 sec bins | Bins with >0 counts | Bins with >2000 counts | High rate bins dominated by noise | Noise dominated (total time) | Noise dominated (detector-on time) | Marked lightcurve |
|---|---|---|---|---|---|---|---|
| A | 7004 | 7004 | 12 | 12 | 0.17% | 0.17% | 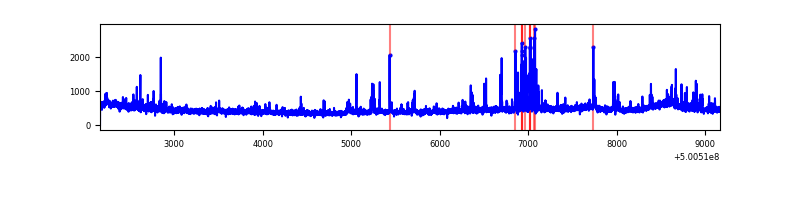 |
| B | 7005 | 7005 | 179 | 179 | 2.56% | 2.56% | 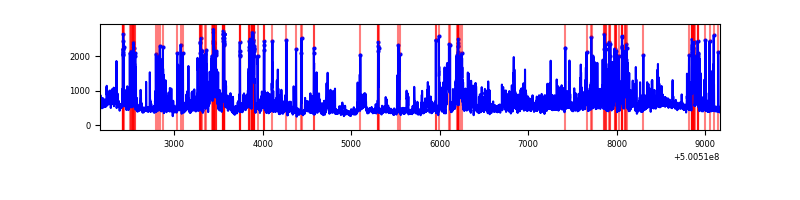 |
| C | 7003 | 7003 | 970 | 970 | 13.85% | 13.85% | 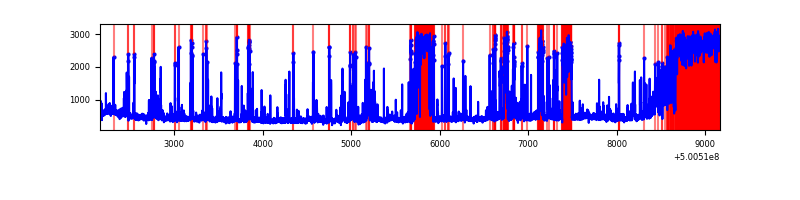 |
| D | 7004 | 7004 | 142 | 142 | 2.03% | 2.03% | 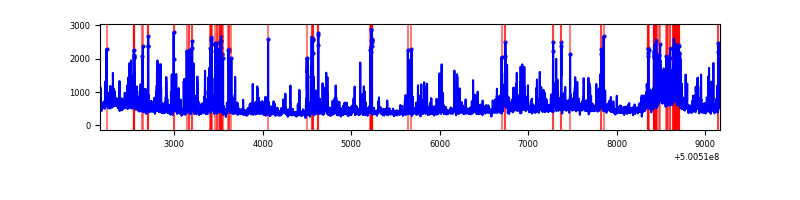 |
Top three noisy pixels from each quadrant. If the there are fewer than three noisy pixels in the level2.evt file, extra rows are filled as -1
| Pixel properties | Quadrant properties | ||||||
|---|---|---|---|---|---|---|---|
| Quadrant | DetID | PixID | Counts | Sigma | Mean | Median | Sigma |
| A | 4 | 206 | 161123 | 866.0 | 746 | 726 | 185.2 |
| A | 3 | 14 | 142602 | 766.0 | 746 | 726 | 185.2 |
| A | 5 | 240 | 83743 | 448.22 | 746 | 726 | 185.2 |
| B | 2 | 249 | 780847 | 4925.52 | 733 | 706 | 158.4 |
| B | 0 | 213 | 399232 | 2516.14 | 733 | 706 | 158.4 |
| B | 5 | 185 | 204040 | 1283.77 | 733 | 706 | 158.4 |
| C | 4 | 5 | 2208409 | 11984.65 | 666 | 659 | 184.2 |
| C | 13 | 3 | 326781 | 1770.34 | 666 | 659 | 184.2 |
| C | 14 | 254 | 184297 | 996.87 | 666 | 659 | 184.2 |
| D | 11 | 129 | 742383 | 3661.16 | 714 | 683 | 202.6 |
| D | 3 | 12 | 151245 | 743.2 | 714 | 683 | 202.6 |
| D | 2 | 120 | 90036 | 441.06 | 714 | 683 | 202.6 |
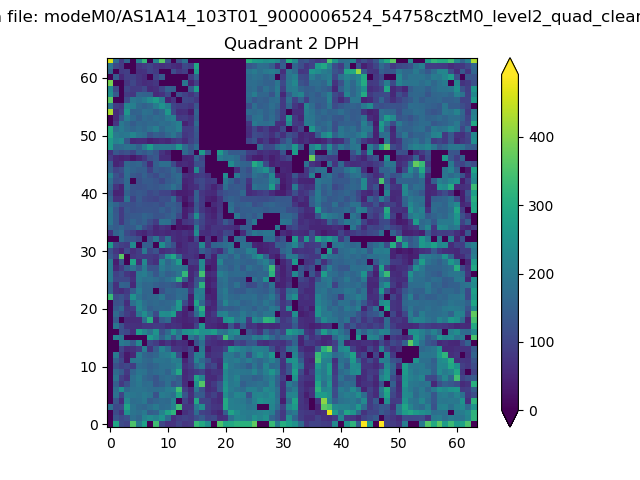
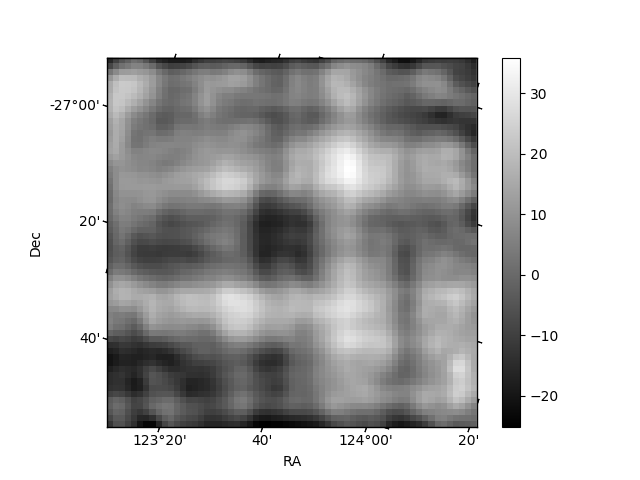
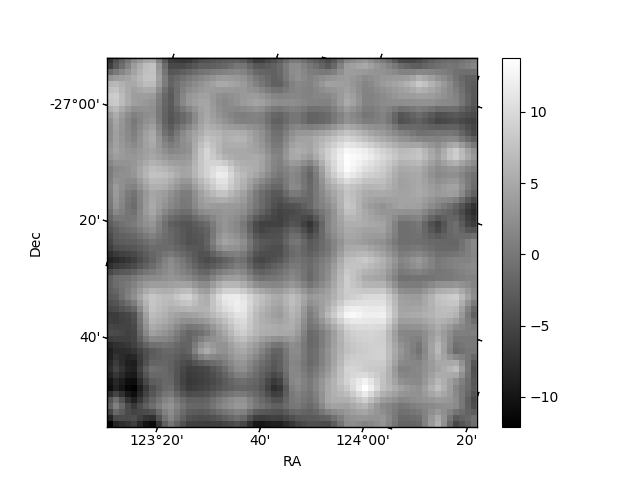
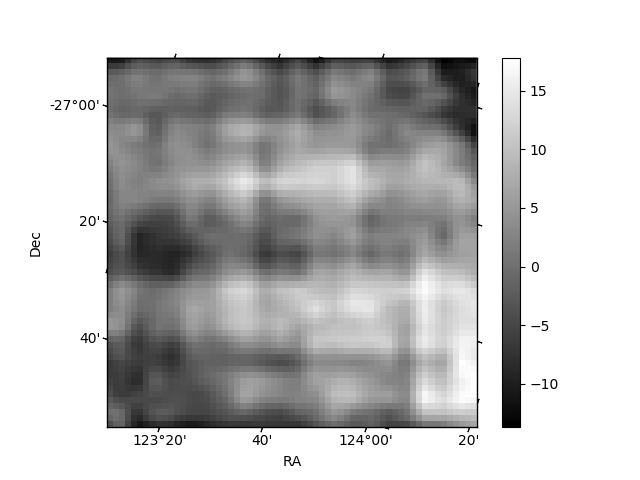
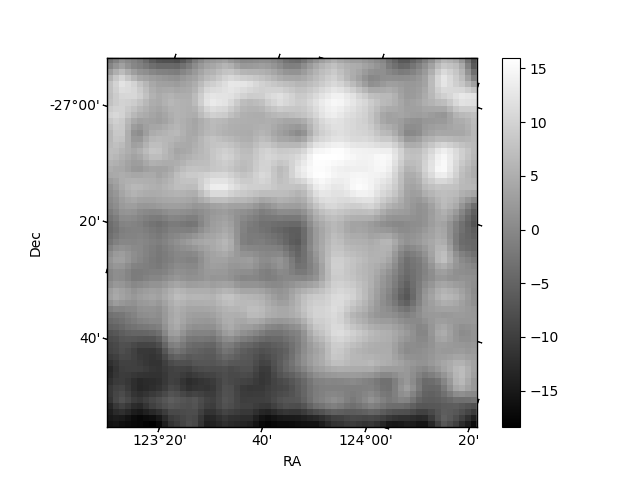
Histogram calculated using DETX and DETY for each event in the final _common_clean file
| Quadrant A | 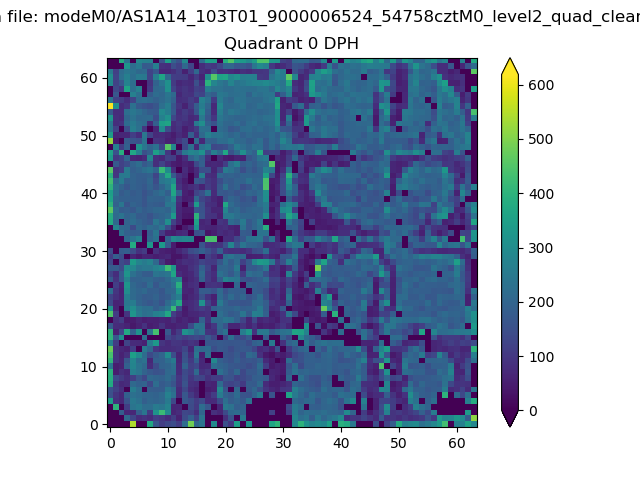 |
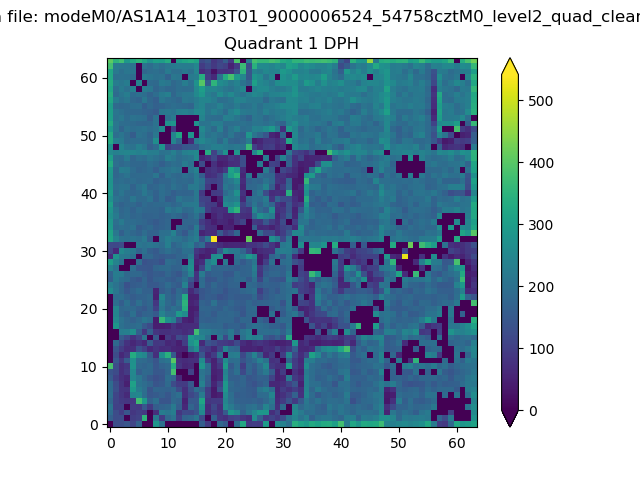 |
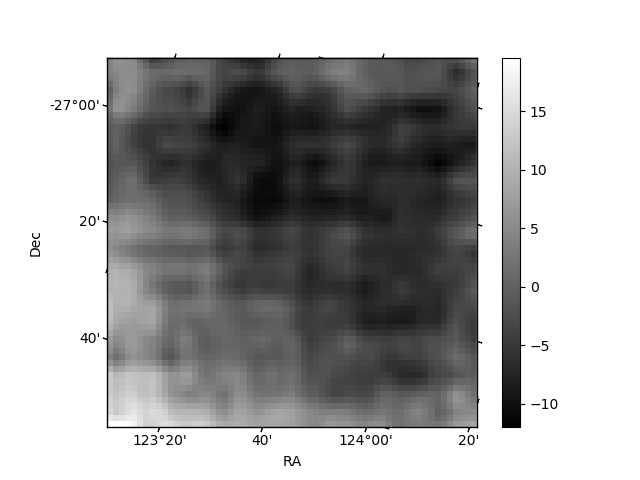
Quadrant B |
|---|---|---|---|
| Quadrant D | 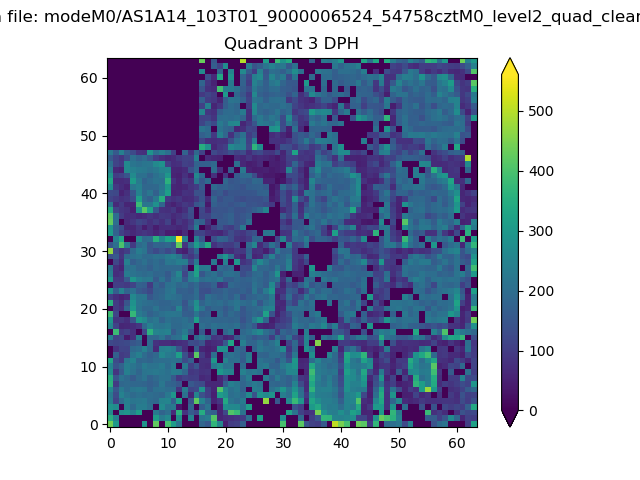 |
 |
Quadrant C |
| Plot type | Count rate plots | Images |
|---|---|---|
| Comparison with Poisson distribution Blue bars denote a histogram of data divided into 1 sec bins. Red curve is a Poisson curve with rate = median count rate of data. |
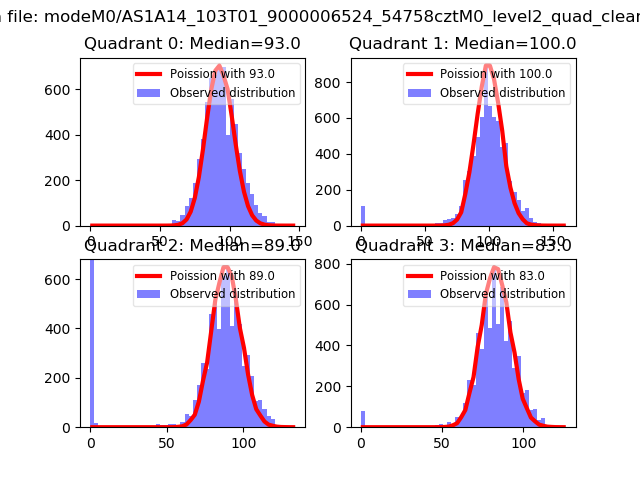 |
 |
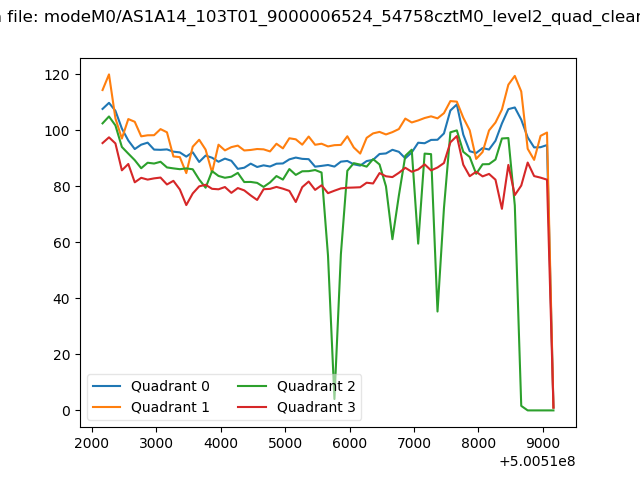
| Quadrant-wise count rates Data is divided into 100 sec bins |
 |
|
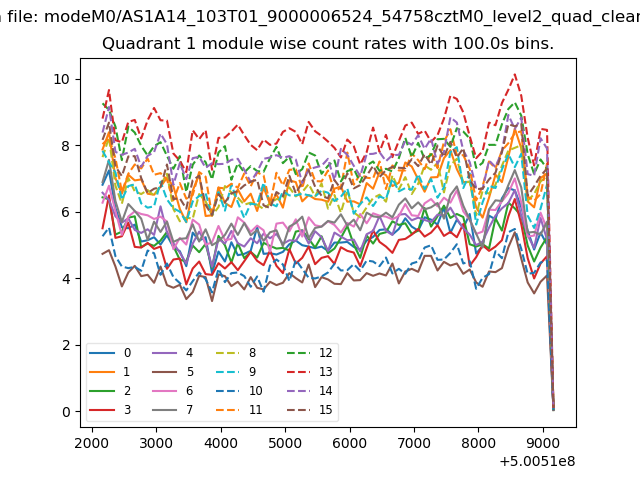
| Module-wise count rates for Quadrant A Data is divided into 100 sec bins |
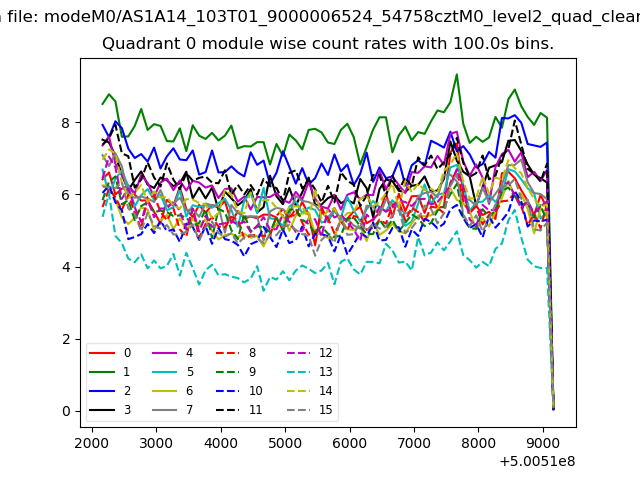 |
 |
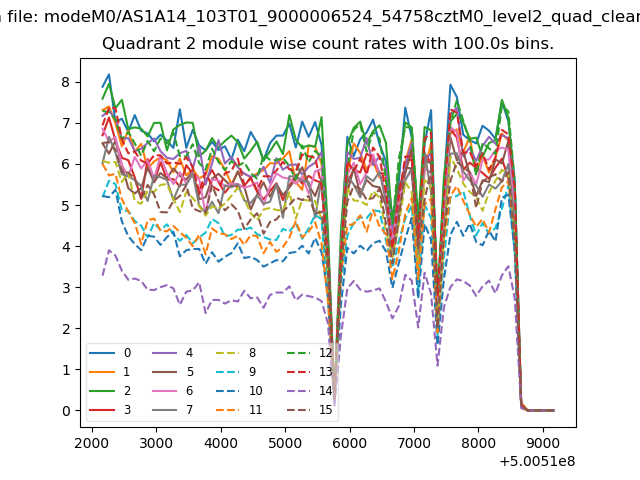
| Module-wise count rates for Quadrant B Data is divided into 100 sec bins |
 |
 |
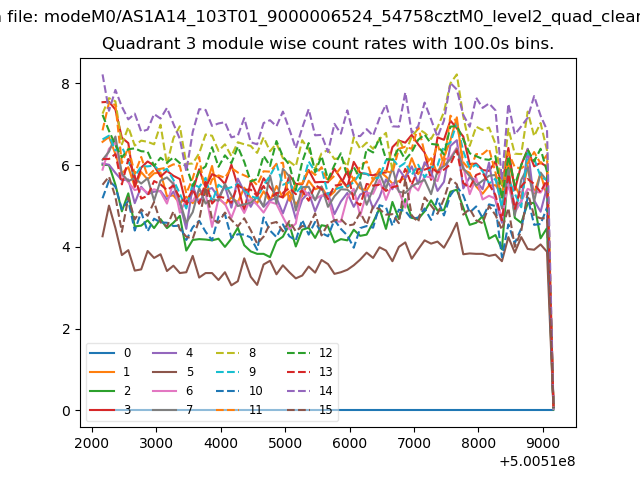
| Module-wise count rates for Quadrant C Data is divided into 100 sec bins |
 |
 |
| Module-wise count rates for Quadrant D Data is divided into 100 sec bins |
 |
 |
| Parameter | Plot |
|---|---|
| CZT HV Monitor | 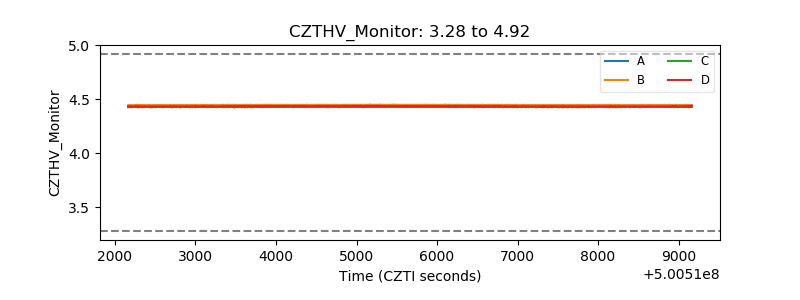 |
| D_VDD | 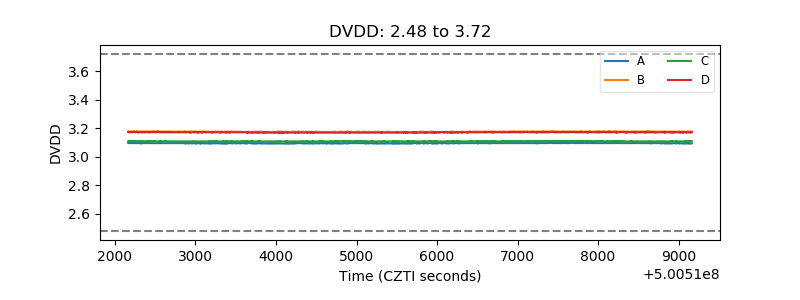 |
| Temperature 1 | 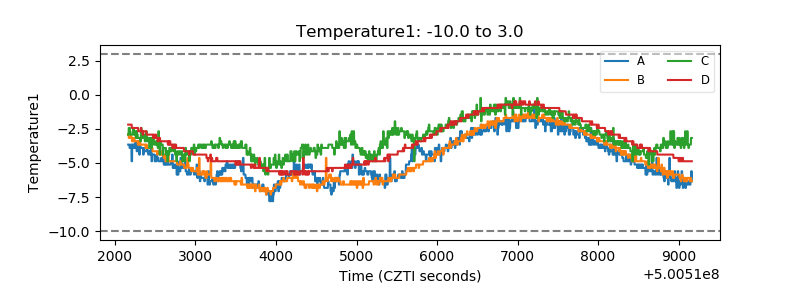 |
| Veto HV Monitor | 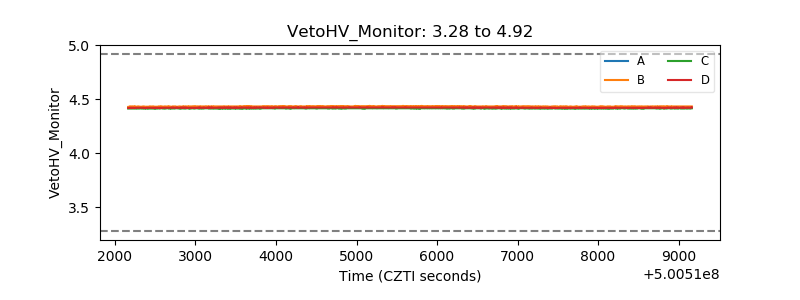 |
| Veto LLD | 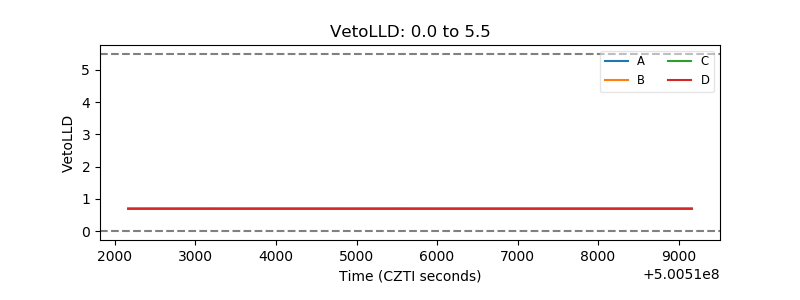 |
| Alpha Counter | 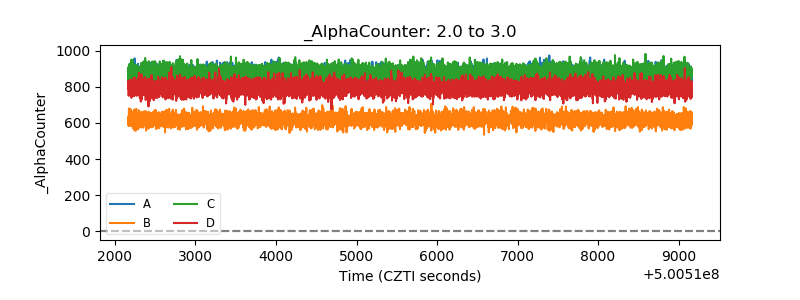 |
| _CPM_Rate | 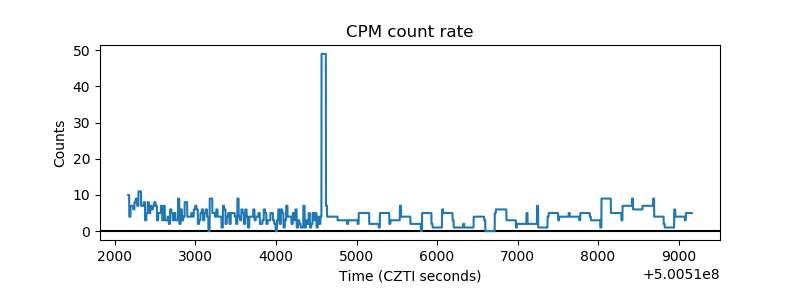 |
| CZT Counter | 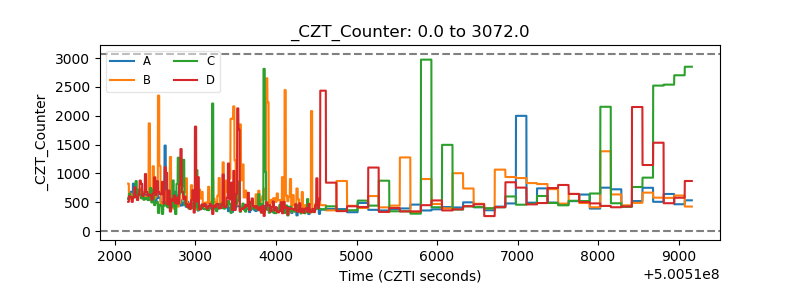 |
| +2.5 Volts monitor |  |
| +5 Volts monitor |  |
| _ROLL_ROT |  |
| _Roll_DEC | 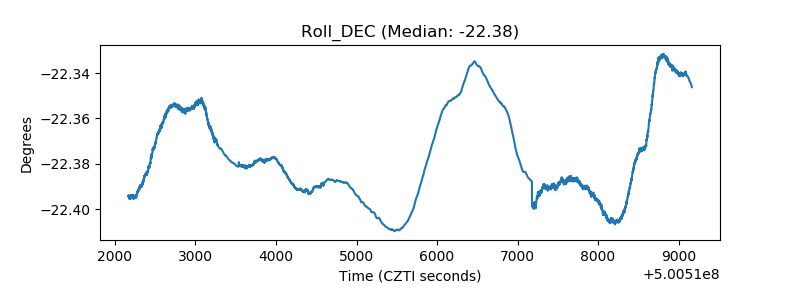 |
| _Roll_RA | 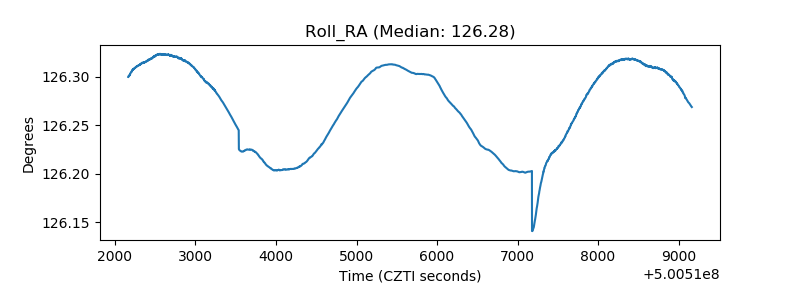 |
| Veto Counter | 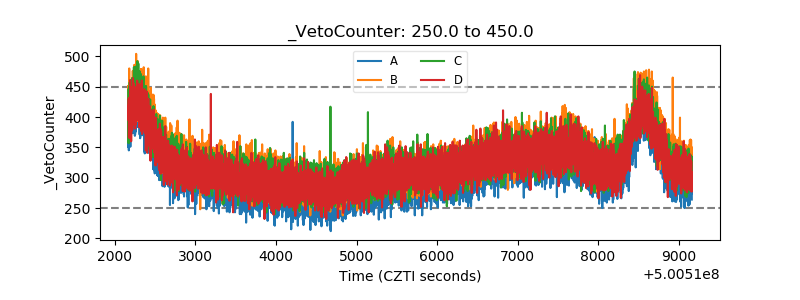 |