| Param | Original file | Final file |
|---|---|---|
| Filename | modeM0/AS1A14_103T01_9000006524_54761cztM0_level2.fits | modeM0/AS1A14_103T01_9000006524_54761cztM0_level2_quad_clean.evt |
| Size (bytes) | 1,027,572,480 | 175,720,320 |
| Size | 980.0 MB | 167.6 MB |
| Events in quadrant A | 5,517,761 | 1,274,418 |
| Events in quadrant B | 15,223,179 | 1,017,075 |
| Events in quadrant C | 8,972,031 | 1,106,901 |
| Events in quadrant D | 7,424,490 | 1,118,433 |
| Mode SS | |||
|---|---|---|---|
| Quadrant | BADHDUFLAG | Total packets | Discarded packets |
| A | 0 | 236 | 0 |
| B | 0 | 236 | 0 |
| C | 0 | 236 | 0 |
| D | 0 | 236 | 0 |
| Mode M0 | |||
|---|---|---|---|
| Quadrant | BADHDUFLAG | Total packets | Discarded packets |
| A | 0 | 25207 | 2 |
| B | 0 | 53297 | 2 |
| C | 0 | 34926 | 2 |
| D | 0 | 30208 | 2 |
| Mode M9 | |||
|---|---|---|---|
| Quadrant | BADHDUFLAG | Total packets | Discarded packets |
| A | 0 | 20 | 0 |
| B | 0 | 20 | 0 |
| C | 0 | 20 | 0 |
| D | 0 | 20 | 0 |
| Quadrant | Total seconds | Saturated seconds | Saturation percentage |
|---|---|---|---|
| A | 11622 | 234 | 2.013423% |
| B | 11623 | 3530 | 30.370816% |
| C | 11622 | 1130 | 9.722939% |
| D | 11622 | 432 | 3.717088% |
Noise dominated data is calculated using 1-second bins in cleaned event files. If a bin has >2000 counts, and if more than 50% of those come from <1% of pixels, then it is considered to be noise-dominated and hence unusable.
| Quadrant | # 1 sec bins | Bins with >0 counts | Bins with >2000 counts | High rate bins dominated by noise | Noise dominated (total time) | Noise dominated (detector-on time) | Marked lightcurve |
|---|---|---|---|---|---|---|---|
| A | 13552 | 11624 | 94 | 94 | 0.69% | 0.81% | 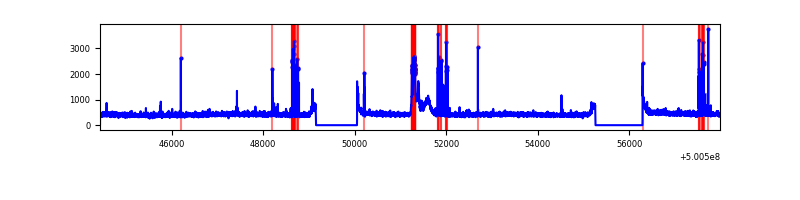 |
| B | 13553 | 11625 | 3006 | 3006 | 22.18% | 25.86% | 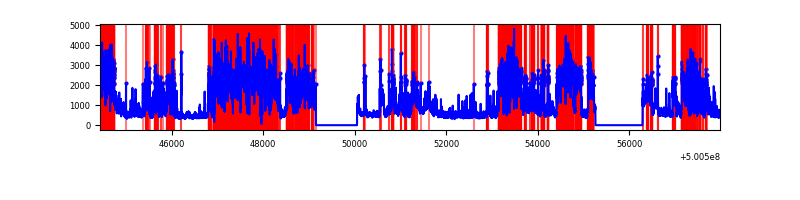 |
| C | 13552 | 11624 | 902 | 902 | 6.66% | 7.76% | 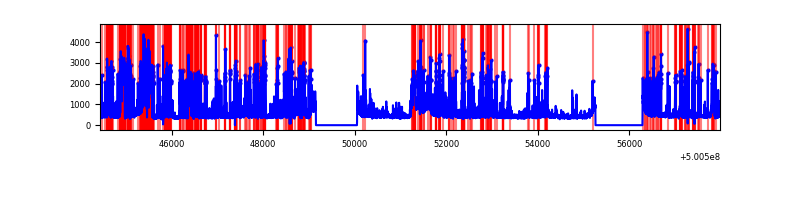 |
| D | 13552 | 11624 | 334 | 334 | 2.46% | 2.87% | 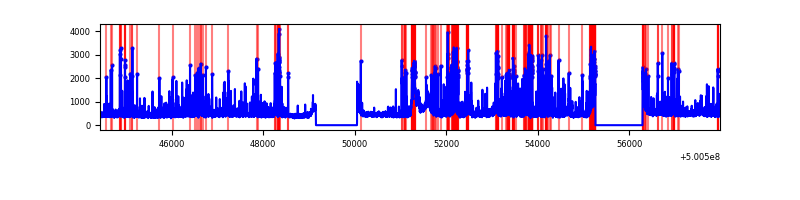 |
Top three noisy pixels from each quadrant. If the there are fewer than three noisy pixels in the level2.evt file, extra rows are filled as -1
| Pixel properties | Quadrant properties | ||||||
|---|---|---|---|---|---|---|---|
| Quadrant | DetID | PixID | Counts | Sigma | Mean | Median | Sigma |
| A | 5 | 240 | 132820 | 384.75 | 1333 | 1303 | 341.8 |
| A | 0 | 8 | 101017 | 291.71 | 1333 | 1303 | 341.8 |
| A | 4 | 3 | 44598 | 126.66 | 1333 | 1303 | 341.8 |
| B | 2 | 249 | 9458786 | 39046.68 | 1122 | 1089 | 242.2 |
| B | 0 | 213 | 411506 | 1694.43 | 1122 | 1089 | 242.2 |
| B | 5 | 185 | 286734 | 1179.3 | 1122 | 1089 | 242.2 |
| C | 4 | 5 | 2549175 | 7273.18 | 1232 | 1221 | 350.3 |
| C | 13 | 3 | 743162 | 2117.88 | 1232 | 1221 | 350.3 |
| C | 12 | 252 | 337416 | 959.67 | 1232 | 1221 | 350.3 |
| D | 3 | 12 | 800057 | 2128.36 | 1276 | 1221 | 375.3 |
| D | 11 | 129 | 653338 | 1737.45 | 1276 | 1221 | 375.3 |
| D | 6 | 239 | 301507 | 800.06 | 1276 | 1221 | 375.3 |
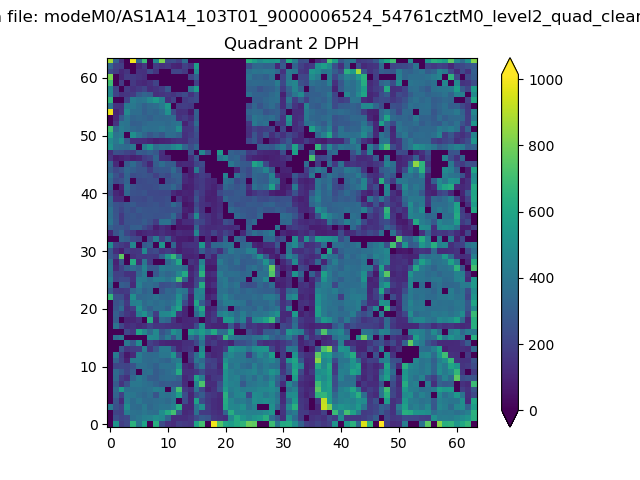
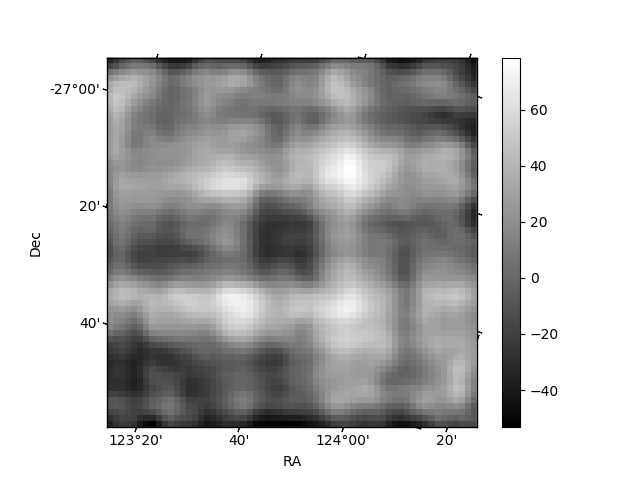
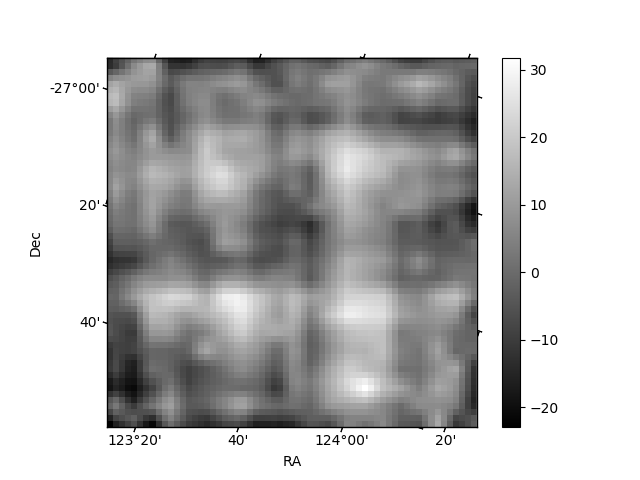
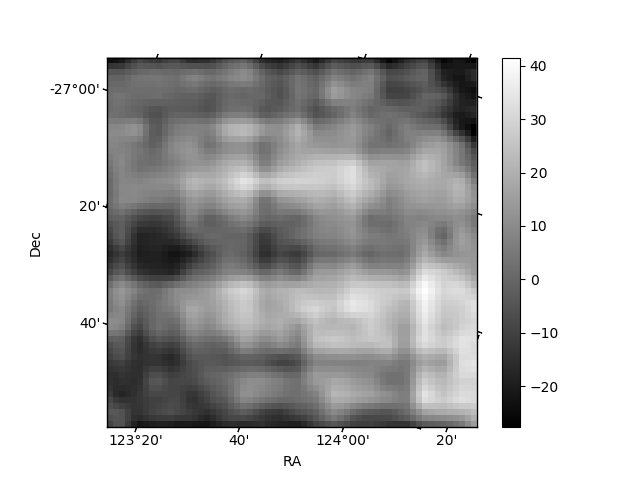
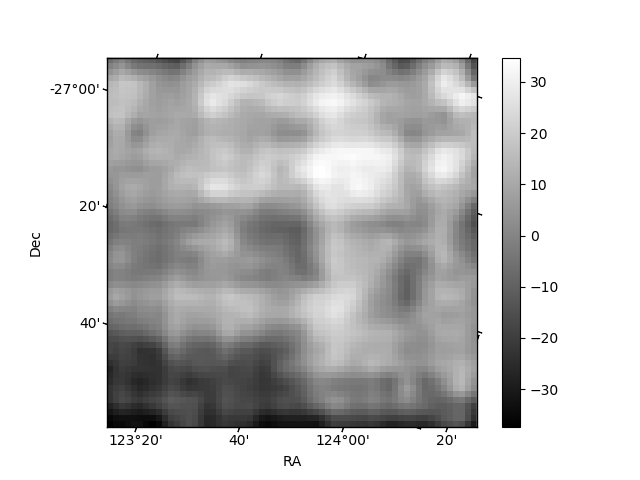
Histogram calculated using DETX and DETY for each event in the final _common_clean file
| Quadrant A | 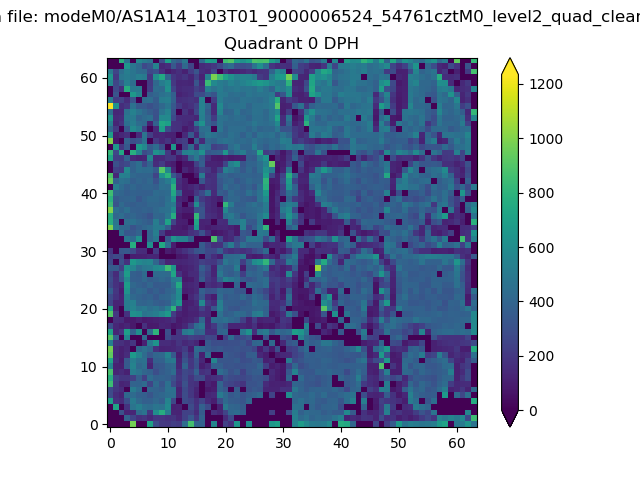 |
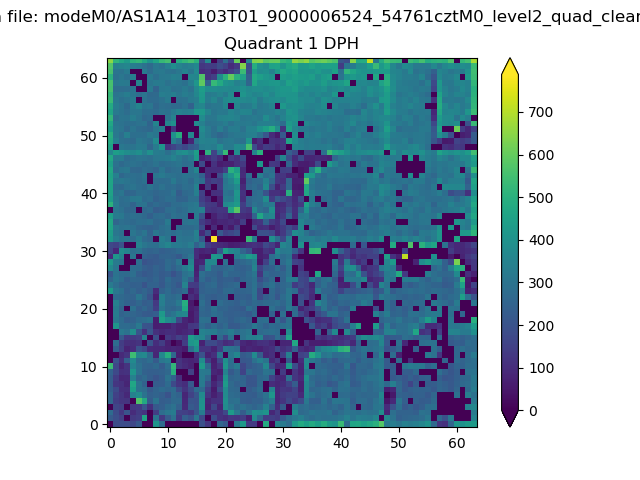 |
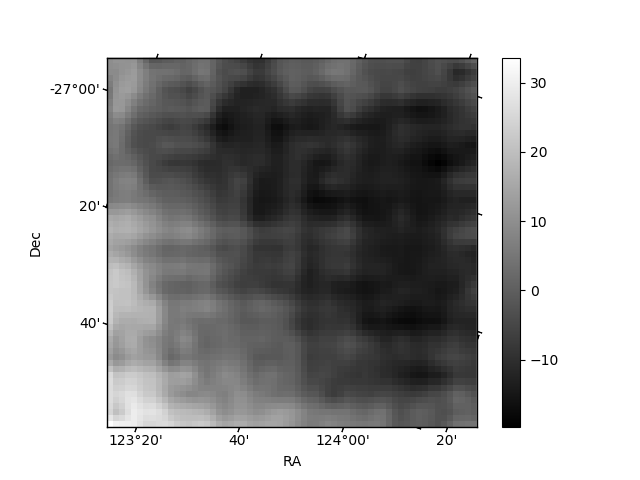
Quadrant B |
|---|---|---|---|
| Quadrant D | 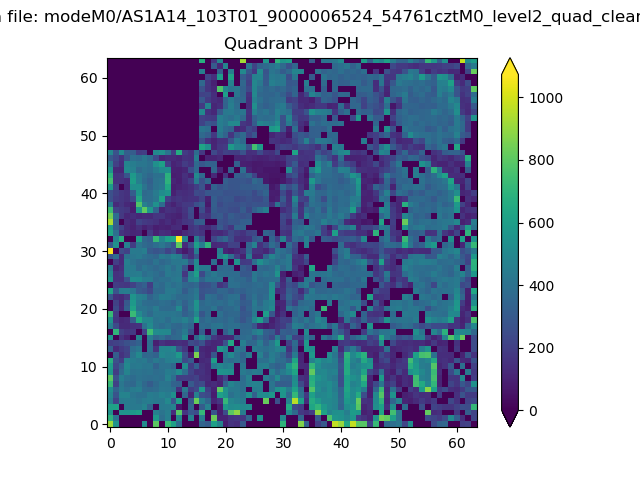 |
 |
Quadrant C |
| Plot type | Count rate plots | Images |
|---|---|---|
| Comparison with Poisson distribution Blue bars denote a histogram of data divided into 1 sec bins. Red curve is a Poisson curve with rate = median count rate of data. |
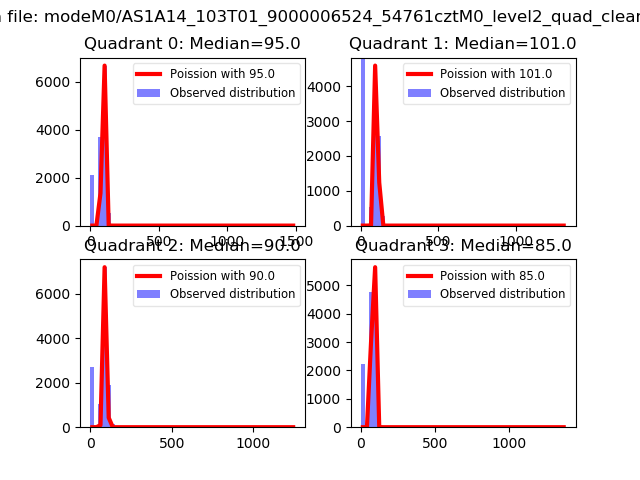 |
 |
| Quadrant-wise count rates Data is divided into 100 sec bins |
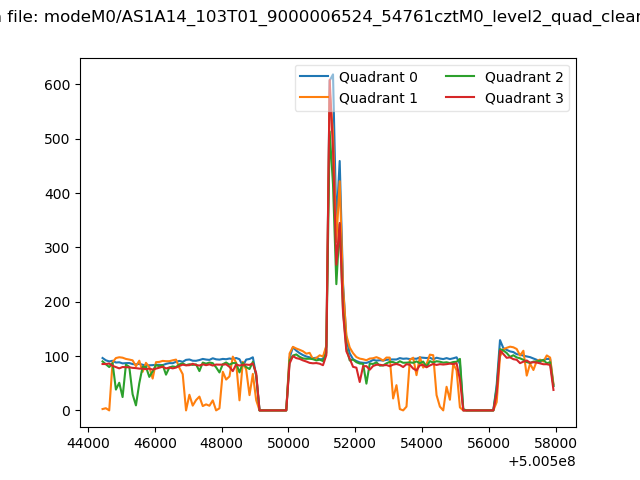 |
|
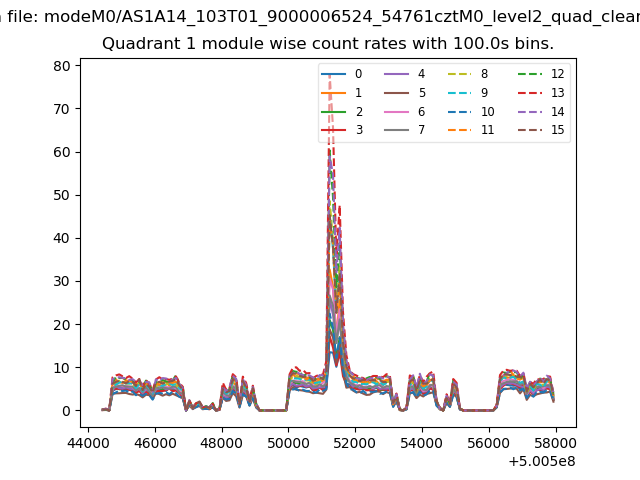
| Module-wise count rates for Quadrant A Data is divided into 100 sec bins |
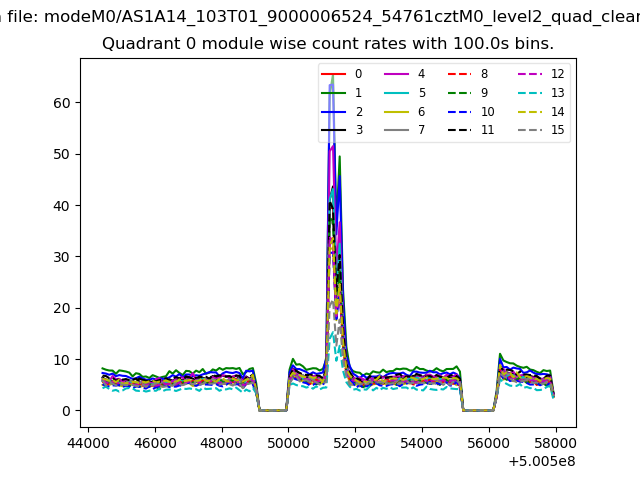 |
 |
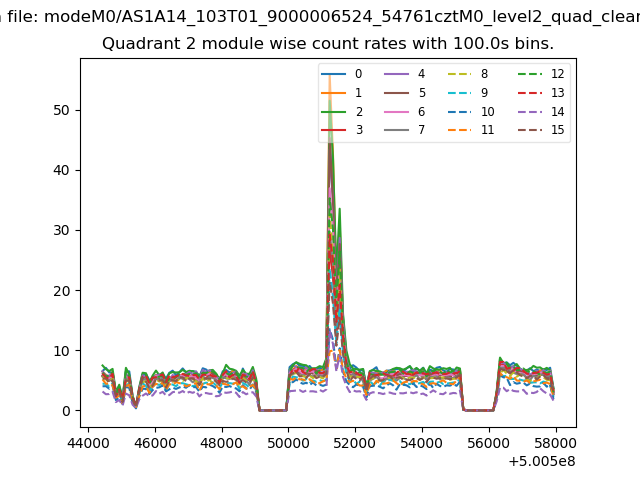
| Module-wise count rates for Quadrant B Data is divided into 100 sec bins |
 |
 |
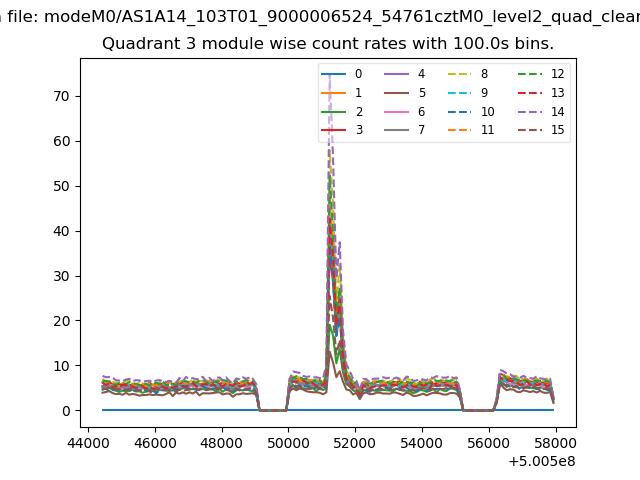
| Module-wise count rates for Quadrant C Data is divided into 100 sec bins |
 |
 |
| Module-wise count rates for Quadrant D Data is divided into 100 sec bins |
 |
 |
| Parameter | Plot |
|---|---|
| CZT HV Monitor | 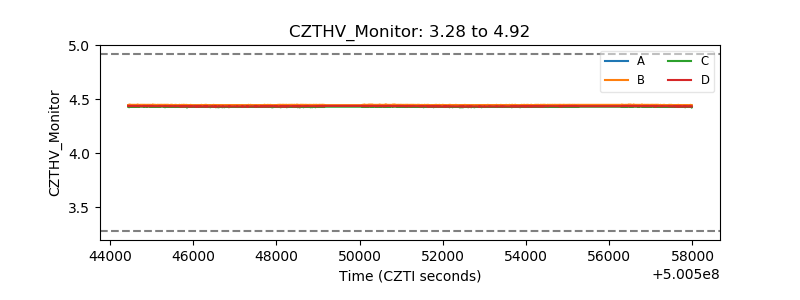 |
| D_VDD | 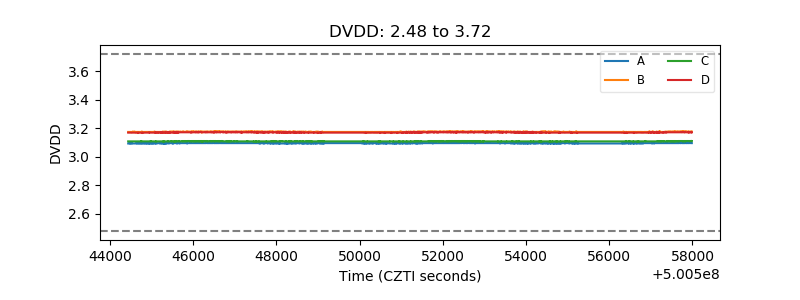 |
| Temperature 1 | 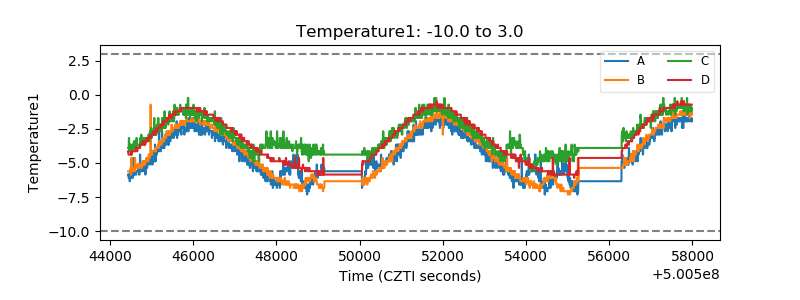 |
| Veto HV Monitor | 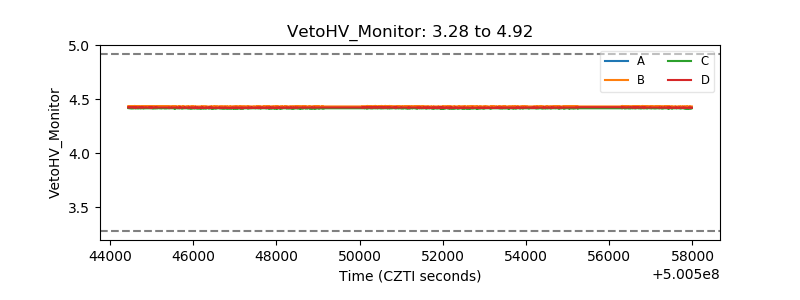 |
| Veto LLD | 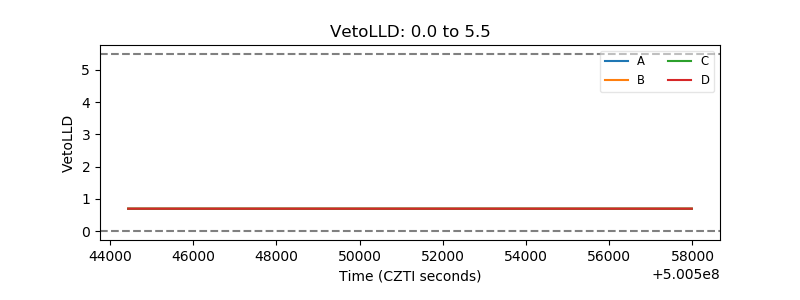 |
| Alpha Counter | 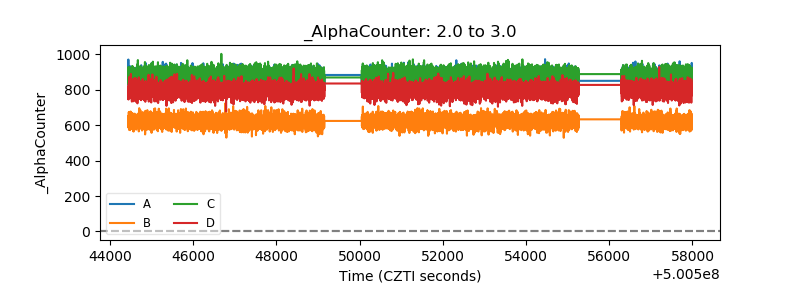 |
| _CPM_Rate | 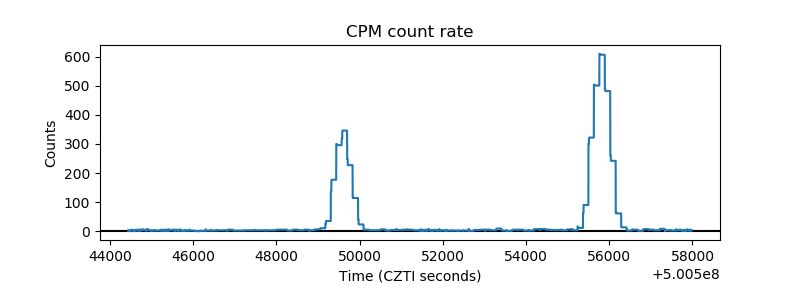 |
| CZT Counter | 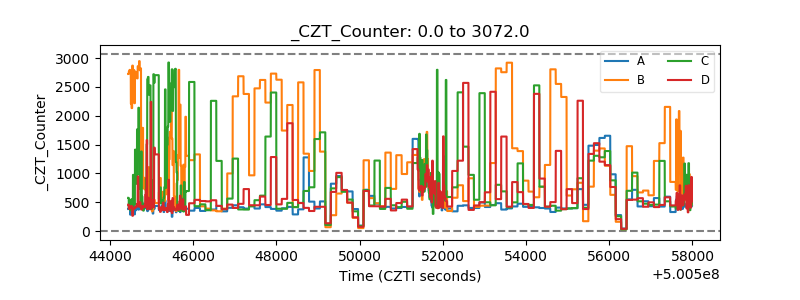 |
| +2.5 Volts monitor |  |
| +5 Volts monitor | 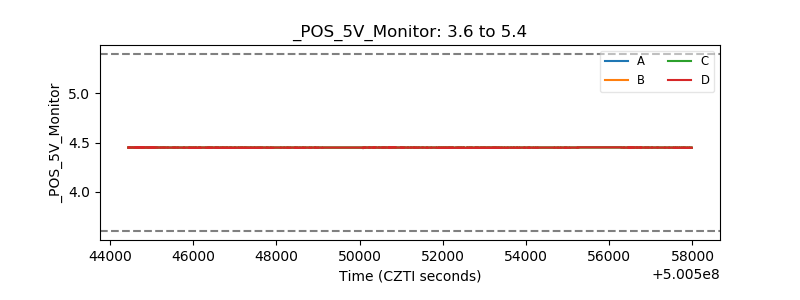 |
| _ROLL_ROT | 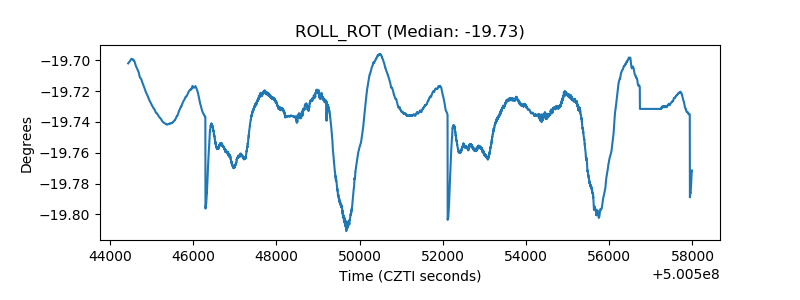 |
| _Roll_DEC | 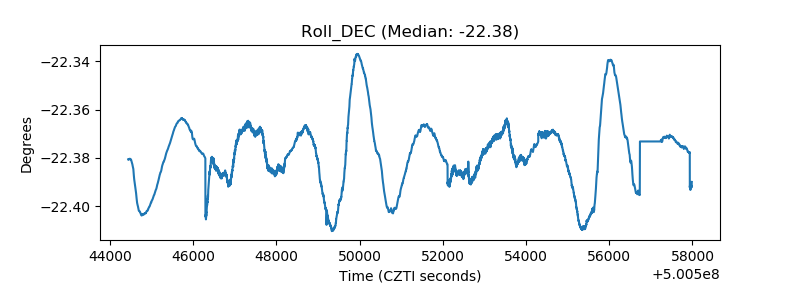 |
| _Roll_RA | 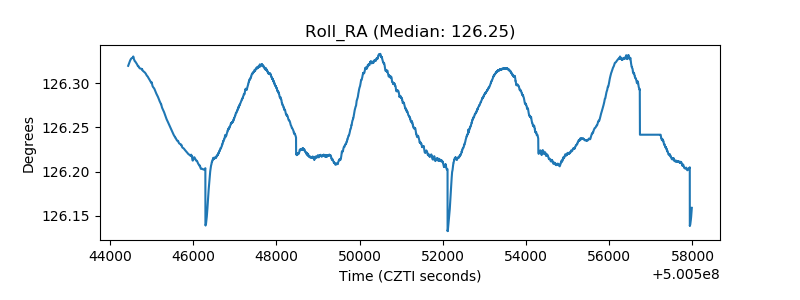 |
| Veto Counter | 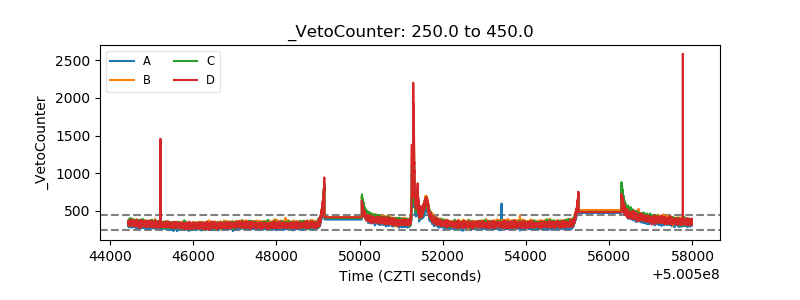 |