| Param | Original file | Final file |
|---|---|---|
| Filename | modeM0/AS1A14_103T01_9000006524_54762cztM0_level2.fits | modeM0/AS1A14_103T01_9000006524_54762cztM0_level2_quad_clean.evt |
| Size (bytes) | 519,577,920 | 99,524,160 |
| Size | 495.5 MB | 94.9 MB |
| Events in quadrant A | 3,148,043 | 675,983 |
| Events in quadrant B | 6,567,856 | 643,758 |
| Events in quadrant C | 4,353,761 | 635,170 |
| Events in quadrant D | 4,635,954 | 586,006 |
| Mode SS | |||
|---|---|---|---|
| Quadrant | BADHDUFLAG | Total packets | Discarded packets |
| A | 0 | 136 | 0 |
| B | 0 | 136 | 0 |
| C | 0 | 136 | 0 |
| D | 0 | 136 | 0 |
| Mode M0 | |||
|---|---|---|---|
| Quadrant | BADHDUFLAG | Total packets | Discarded packets |
| A | 0 | 14226 | 2 |
| B | 0 | 24208 | 2 |
| C | 0 | 17631 | 2 |
| D | 0 | 18471 | 2 |
| Mode M9 | |||
|---|---|---|---|
| Quadrant | BADHDUFLAG | Total packets | Discarded packets |
| A | 0 | 14 | 0 |
| B | 0 | 15 | 0 |
| C | 0 | 15 | 0 |
| D | 0 | 15 | 0 |
| Quadrant | Total seconds | Saturated seconds | Saturation percentage |
|---|---|---|---|
| A | 6790 | 135 | 1.988218% |
| B | 6790 | 1009 | 14.860088% |
| C | 6790 | 305 | 4.491900% |
| D | 6790 | 387 | 5.699558% |
Noise dominated data is calculated using 1-second bins in cleaned event files. If a bin has >2000 counts, and if more than 50% of those come from <1% of pixels, then it is considered to be noise-dominated and hence unusable.
| Quadrant | # 1 sec bins | Bins with >0 counts | Bins with >2000 counts | High rate bins dominated by noise | Noise dominated (total time) | Noise dominated (detector-on time) | Marked lightcurve |
|---|---|---|---|---|---|---|---|
| A | 7880 | 6791 | 15 | 15 | 0.19% | 0.22% | 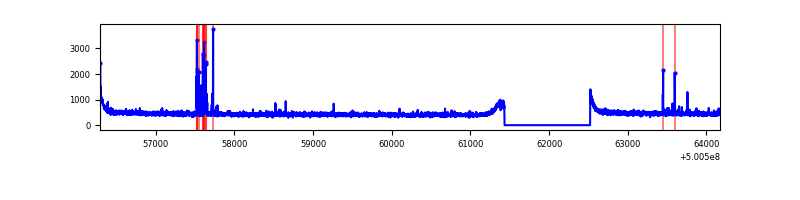 |
| B | 7880 | 6791 | 756 | 756 | 9.59% | 11.13% | 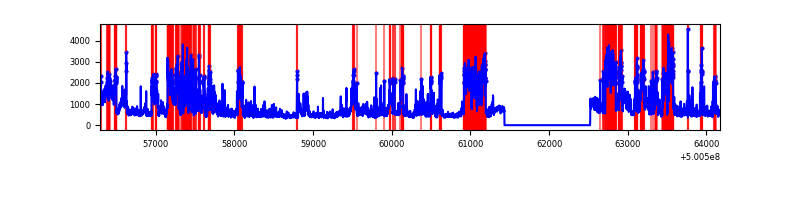 |
| C | 7880 | 6791 | 177 | 177 | 2.25% | 2.61% | 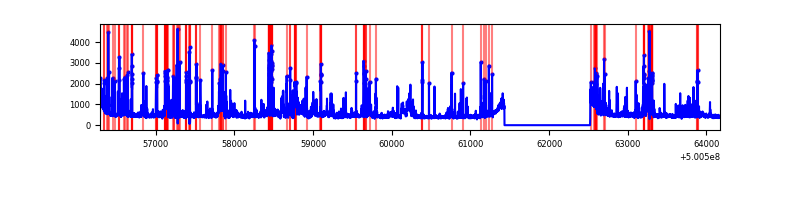 |
| D | 7880 | 6791 | 260 | 260 | 3.30% | 3.83% | 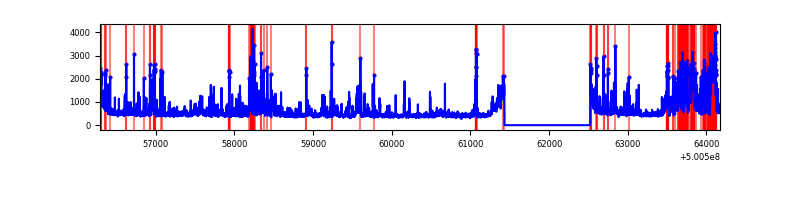 |
Top three noisy pixels from each quadrant. If the there are fewer than three noisy pixels in the level2.evt file, extra rows are filled as -1
| Pixel properties | Quadrant properties | ||||||
|---|---|---|---|---|---|---|---|
| Quadrant | DetID | PixID | Counts | Sigma | Mean | Median | Sigma |
| A | 5 | 240 | 79108 | 414.84 | 772 | 755 | 188.9 |
| A | 4 | 3 | 35340 | 183.11 | 772 | 755 | 188.9 |
| A | 8 | 249 | 17086 | 86.47 | 772 | 755 | 188.9 |
| B | 2 | 249 | 2831548 | 18589.32 | 718 | 693 | 152.3 |
| B | 0 | 213 | 338946 | 2221.2 | 718 | 693 | 152.3 |
| B | 1 | 207 | 165734 | 1083.77 | 718 | 693 | 152.3 |
| C | 4 | 5 | 607102 | 3033.18 | 736 | 731 | 199.9 |
| C | 13 | 3 | 524411 | 2619.55 | 736 | 731 | 199.9 |
| C | 6 | 223 | 157149 | 782.43 | 736 | 731 | 199.9 |
| D | 3 | 12 | 637498 | 3060.19 | 732 | 701 | 208.1 |
| D | 11 | 129 | 258547 | 1239.11 | 732 | 701 | 208.1 |
| D | 6 | 239 | 255513 | 1224.52 | 732 | 701 | 208.1 |
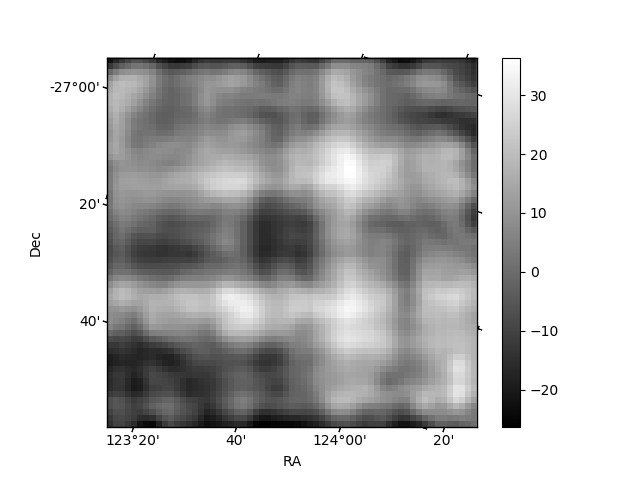
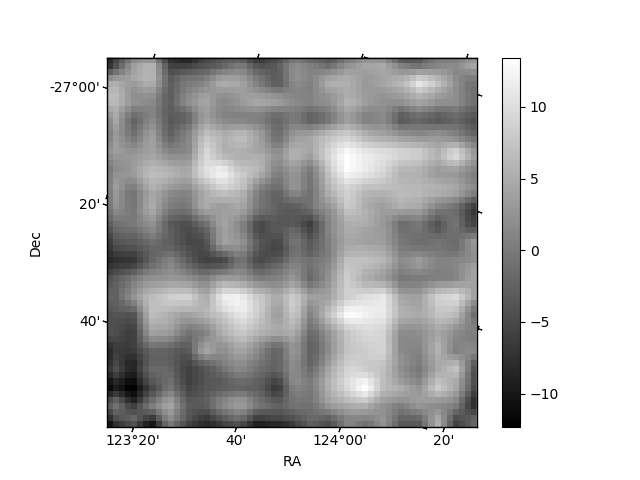
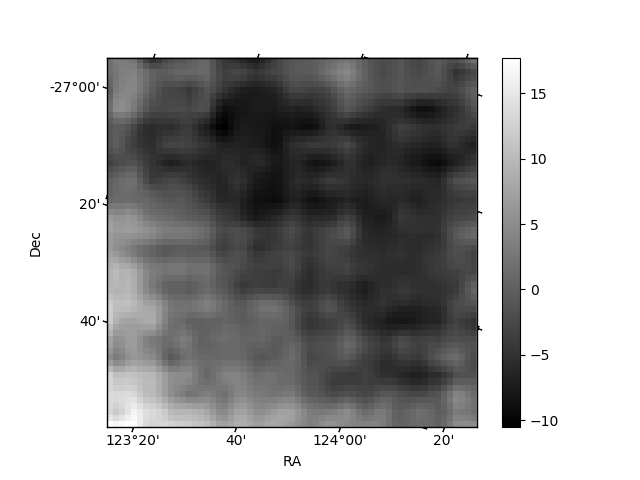
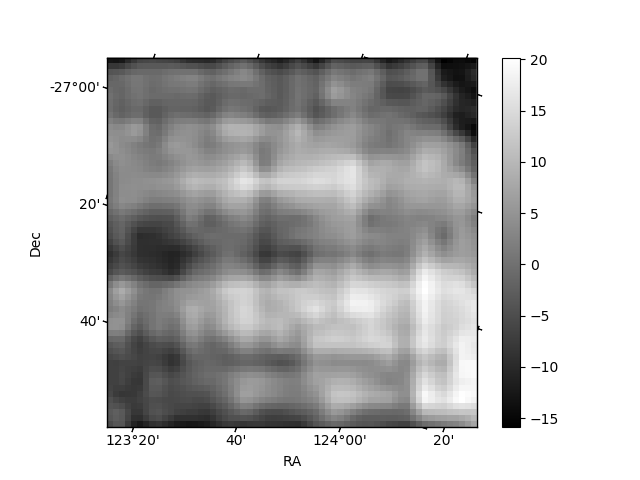
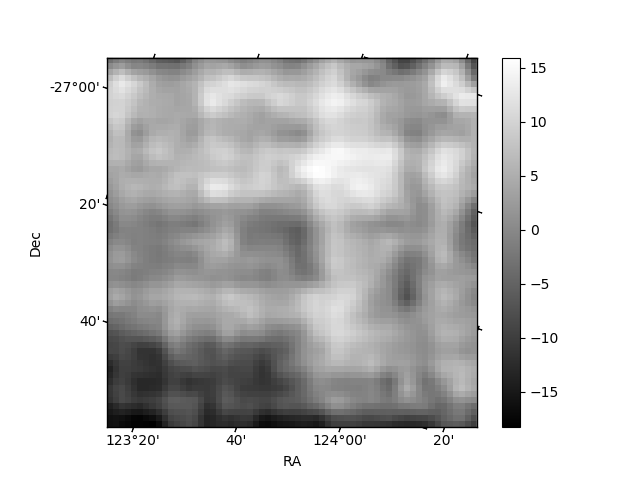
Histogram calculated using DETX and DETY for each event in the final _common_clean file
| Quadrant A | 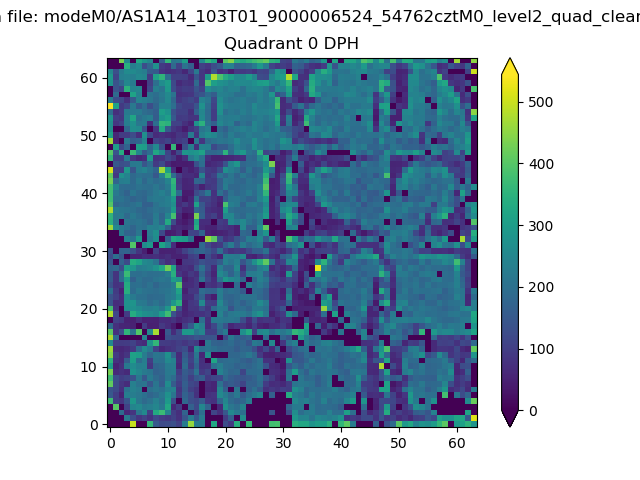 |
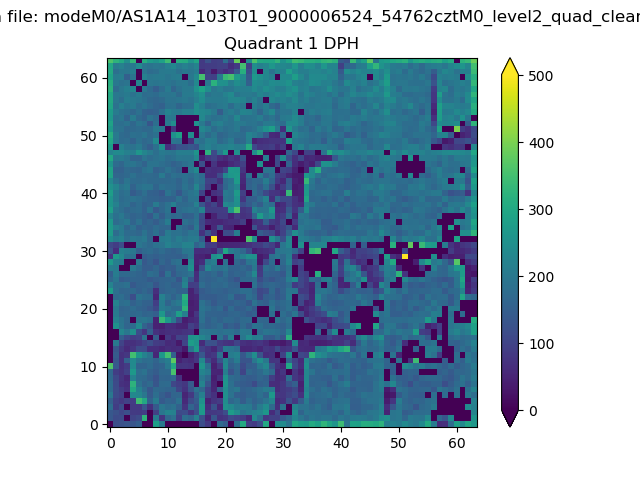 |
Quadrant B |
|---|---|---|---|
| Quadrant D | 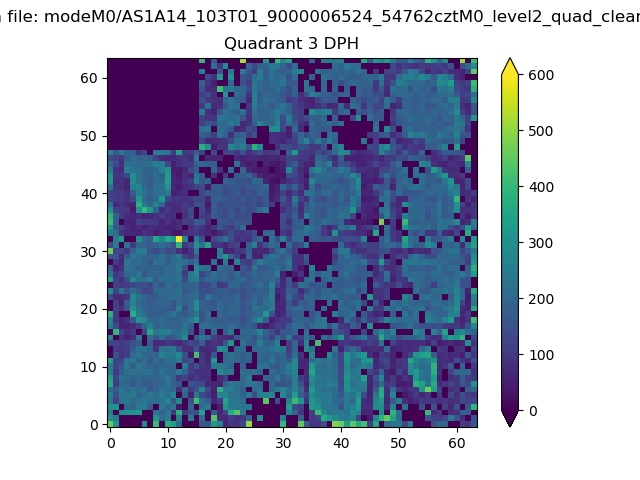 |
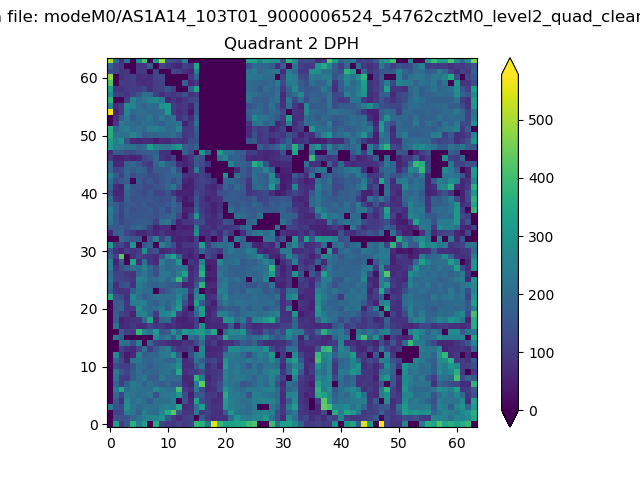 |
Quadrant C |
| Plot type | Count rate plots | Images |
|---|---|---|
| Comparison with Poisson distribution Blue bars denote a histogram of data divided into 1 sec bins. Red curve is a Poisson curve with rate = median count rate of data. |
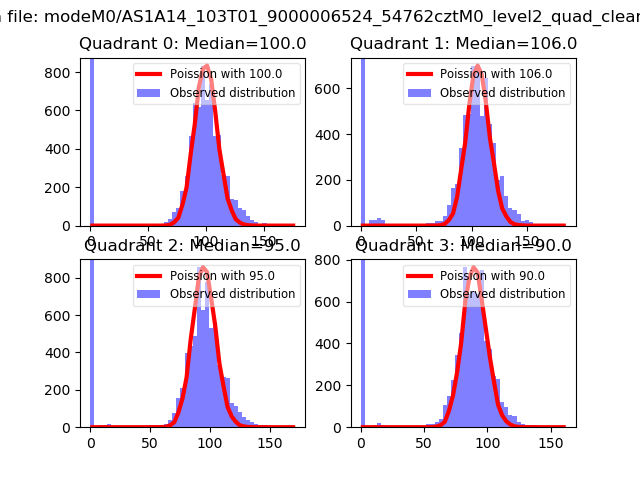 |
 |
| Quadrant-wise count rates Data is divided into 100 sec bins |
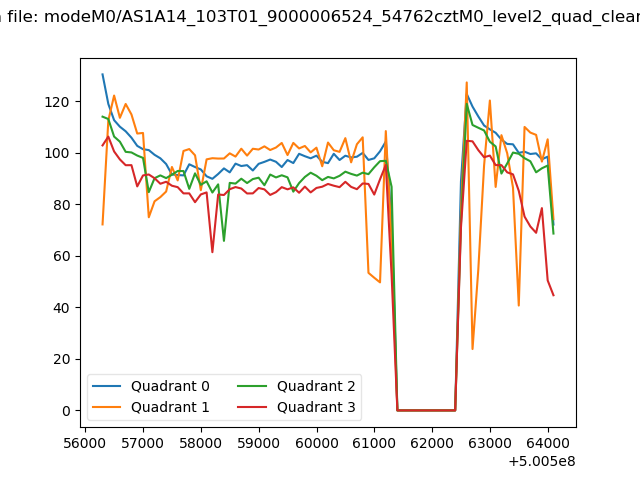 |
|
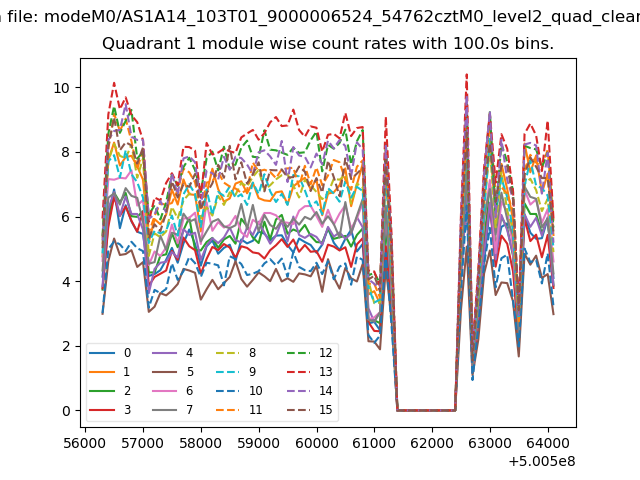
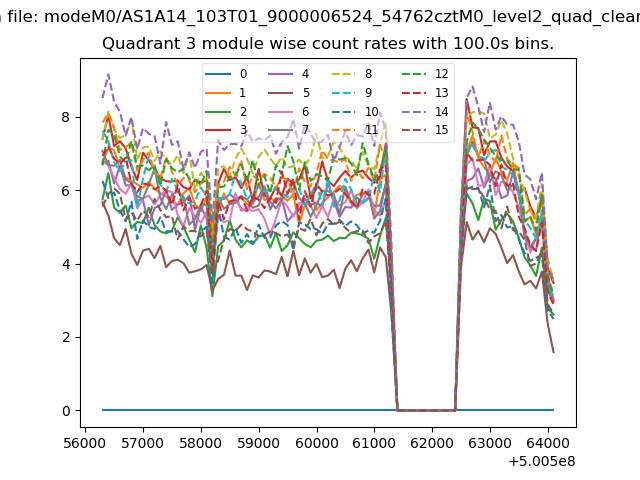
| Module-wise count rates for Quadrant A Data is divided into 100 sec bins |
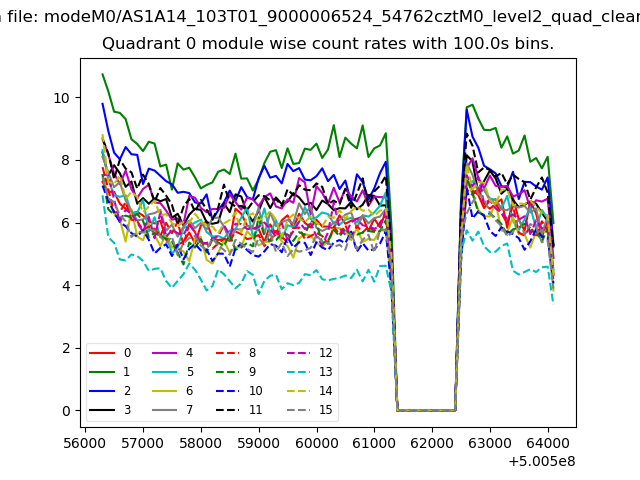 |
 |
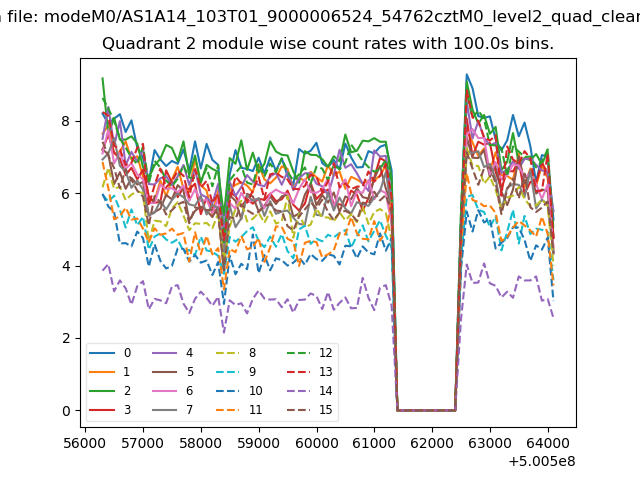
| Module-wise count rates for Quadrant B Data is divided into 100 sec bins |
 |
 |
| Module-wise count rates for Quadrant C Data is divided into 100 sec bins |
 |
 |
| Module-wise count rates for Quadrant D Data is divided into 100 sec bins |
 |
 |
| Parameter | Plot |
|---|---|
| CZT HV Monitor |  |
| D_VDD | 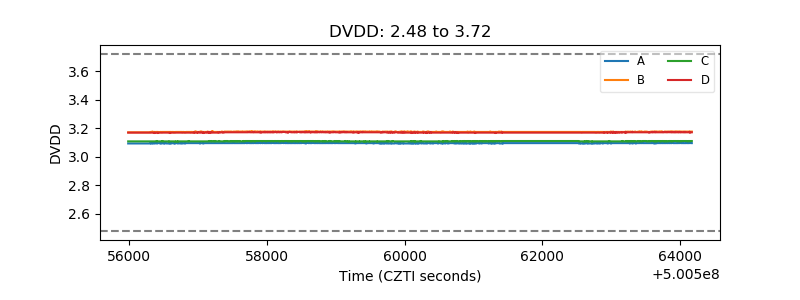 |
| Temperature 1 | 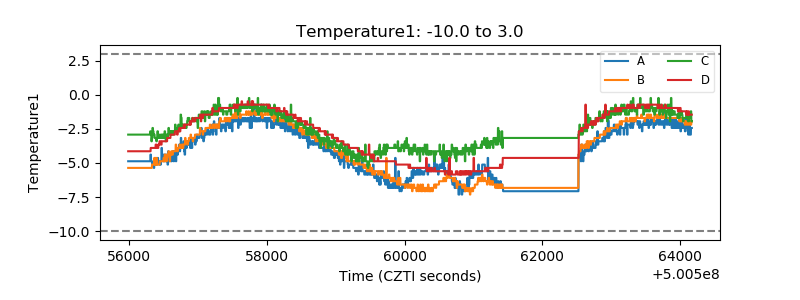 |
| Veto HV Monitor | 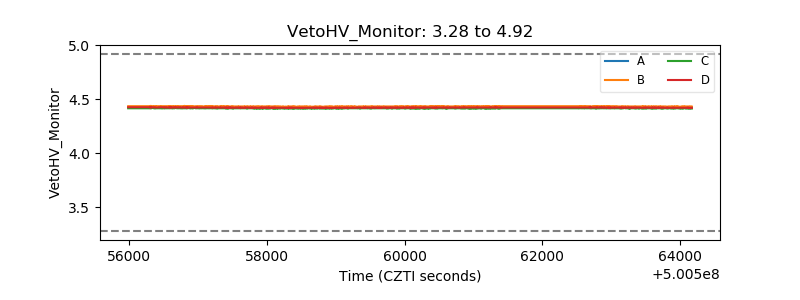 |
| Veto LLD | 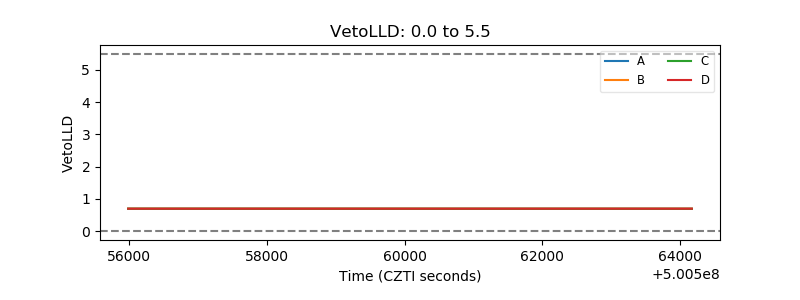 |
| Alpha Counter | 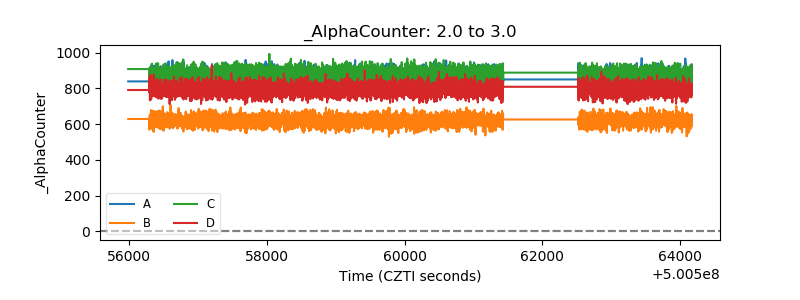 |
| _CPM_Rate | 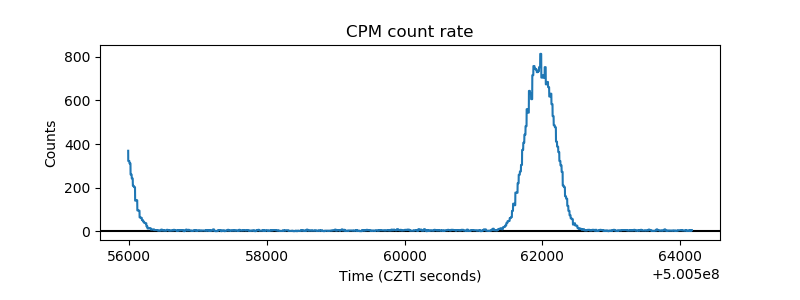 |
| CZT Counter | 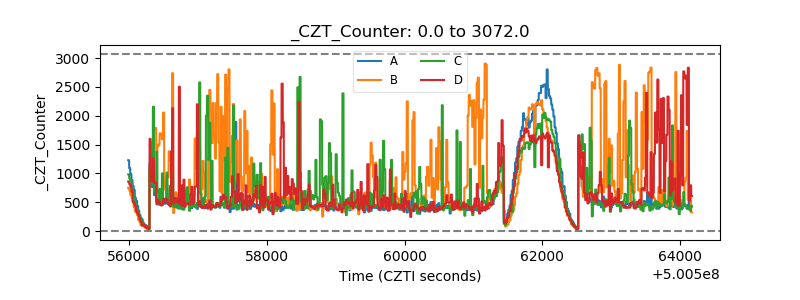 |
| +2.5 Volts monitor | 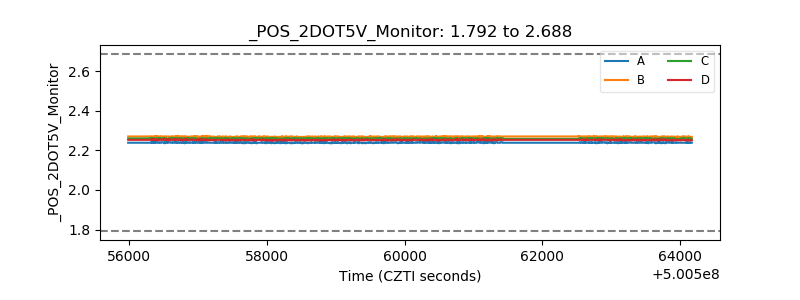 |
| +5 Volts monitor | 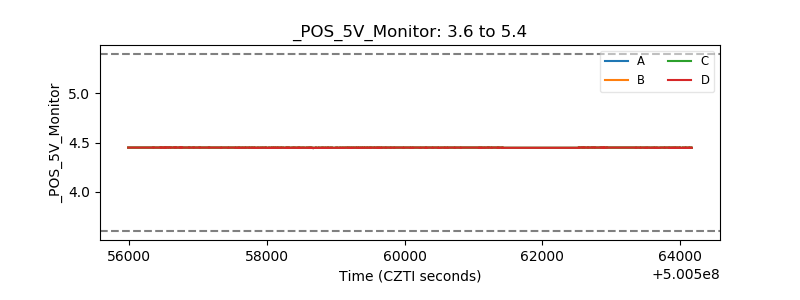 |
| _ROLL_ROT | 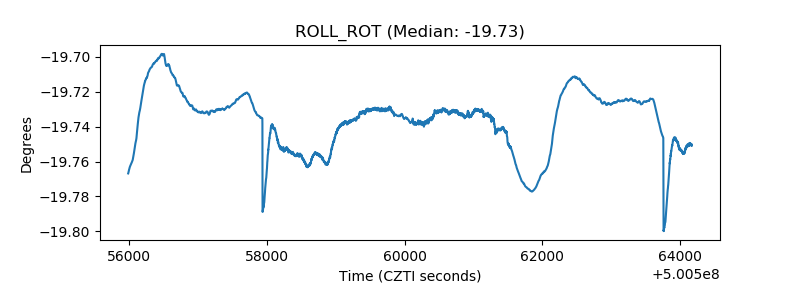 |
| _Roll_DEC | 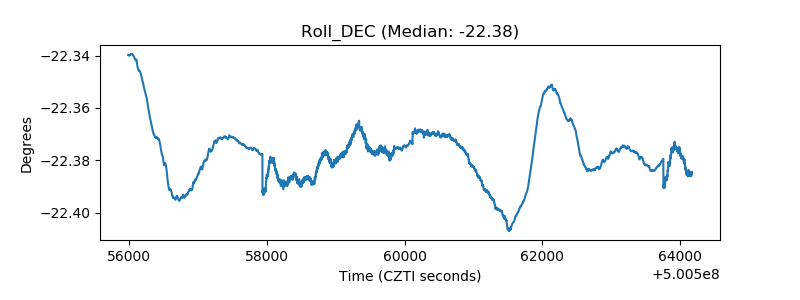 |
| _Roll_RA | 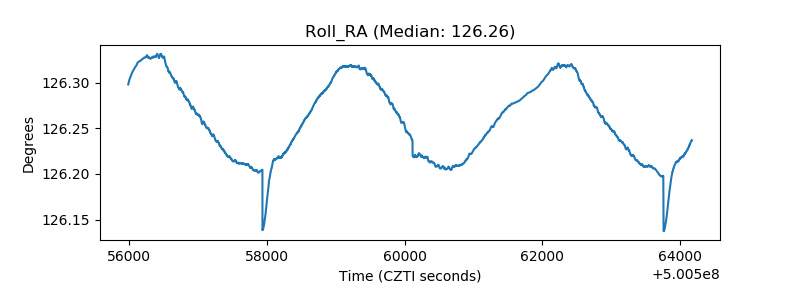 |
| Veto Counter | 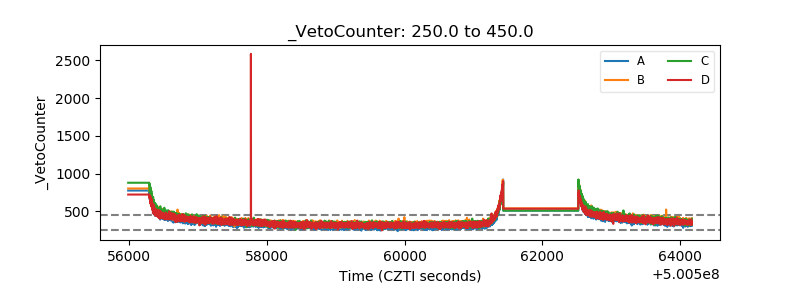 |