| Param | Original file | Final file |
|---|---|---|
| Filename | modeM0/AS1A14_103T01_9000006524_54763cztM0_level2.fits | modeM0/AS1A14_103T01_9000006524_54763cztM0_level2_quad_clean.evt |
| Size (bytes) | 621,463,680 | 93,611,520 |
| Size | 592.7 MB | 89.3 MB |
| Events in quadrant A | 3,106,993 | 673,045 |
| Events in quadrant B | 9,011,678 | 521,476 |
| Events in quadrant C | 3,886,532 | 632,761 |
| Events in quadrant D | 6,485,407 | 545,687 |
| Mode SS | |||
|---|---|---|---|
| Quadrant | BADHDUFLAG | Total packets | Discarded packets |
| A | 0 | 139990688307240 | 139990164045870 |
| B | 0 | -1 | -1 |
| C | 0 | -1 | -1 |
| D | 0 | -1 | -1 |
| Mode M0 | |||
|---|---|---|---|
| Quadrant | BADHDUFLAG | Total packets | Discarded packets |
| A | 0 | 13922 | 2 |
| B | 0 | 31318 | 2 |
| C | 0 | 16273 | 2 |
| D | 0 | 23849 | 2 |
| Mode M9 | |||
|---|---|---|---|
| Quadrant | BADHDUFLAG | Total packets | Discarded packets |
| A | 0 | 13 | 0 |
| B | 0 | 14 | 0 |
| C | 0 | 14 | 0 |
| D | 0 | 14 | 0 |
| Quadrant | Total seconds | Saturated seconds | Saturation percentage |
|---|---|---|---|
| A | 6623 | 133 | 2.008153% |
| B | 6622 | 2122 | 32.044699% |
| C | 6622 | 258 | 3.896104% |
| D | 6622 | 827 | 12.488674% |
Noise dominated data is calculated using 1-second bins in cleaned event files. If a bin has >2000 counts, and if more than 50% of those come from <1% of pixels, then it is considered to be noise-dominated and hence unusable.
| Quadrant | # 1 sec bins | Bins with >0 counts | Bins with >2000 counts | High rate bins dominated by noise | Noise dominated (total time) | Noise dominated (detector-on time) | Marked lightcurve |
|---|---|---|---|---|---|---|---|
| A | 7763 | 6624 | 8 | 8 | 0.10% | 0.12% | 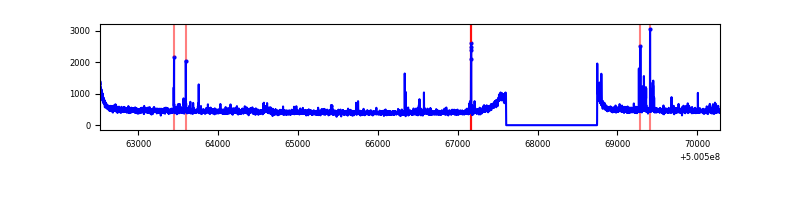 |
| B | 7762 | 6623 | 1751 | 1751 | 22.56% | 26.44% | 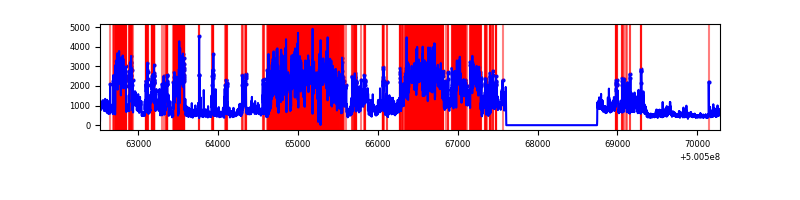 |
| C | 7762 | 6623 | 133 | 133 | 1.71% | 2.01% | 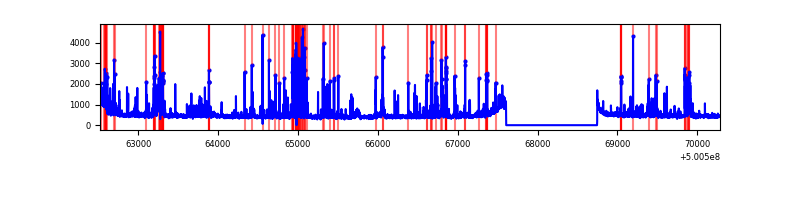 |
| D | 7762 | 6623 | 767 | 767 | 9.88% | 11.58% | 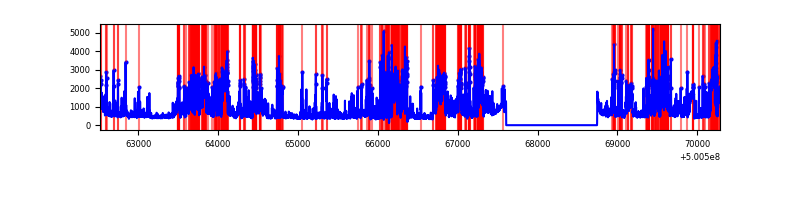 |
Top three noisy pixels from each quadrant. If the there are fewer than three noisy pixels in the level2.evt file, extra rows are filled as -1
| Pixel properties | Quadrant properties | ||||||
|---|---|---|---|---|---|---|---|
| Quadrant | DetID | PixID | Counts | Sigma | Mean | Median | Sigma |
| A | 5 | 240 | 44653 | 235.15 | 763 | 745 | 186.7 |
| A | 4 | 206 | 29611 | 154.59 | 763 | 745 | 186.7 |
| A | 4 | 3 | 24071 | 124.92 | 763 | 745 | 186.7 |
| B | 2 | 249 | 5169885 | 37972.26 | 632 | 611 | 136.1 |
| B | 0 | 213 | 343279 | 2517.16 | 632 | 611 | 136.1 |
| B | 1 | 207 | 238813 | 1749.78 | 632 | 611 | 136.1 |
| C | 13 | 3 | 543737 | 2735.43 | 727 | 723 | 198.5 |
| C | 4 | 5 | 221881 | 1114.08 | 727 | 723 | 198.5 |
| C | 6 | 223 | 154851 | 776.42 | 727 | 723 | 198.5 |
| D | 3 | 12 | 2183453 | 10988.04 | 701 | 671 | 198.7 |
| D | 11 | 129 | 569557 | 2863.75 | 701 | 671 | 198.7 |
| D | 2 | 252 | 486127 | 2443.77 | 701 | 671 | 198.7 |
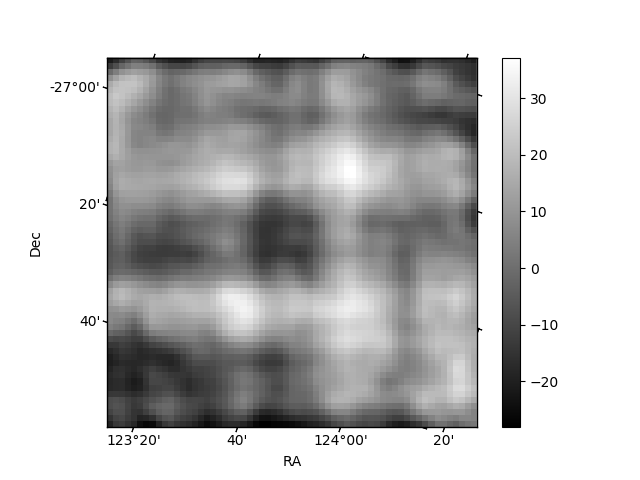
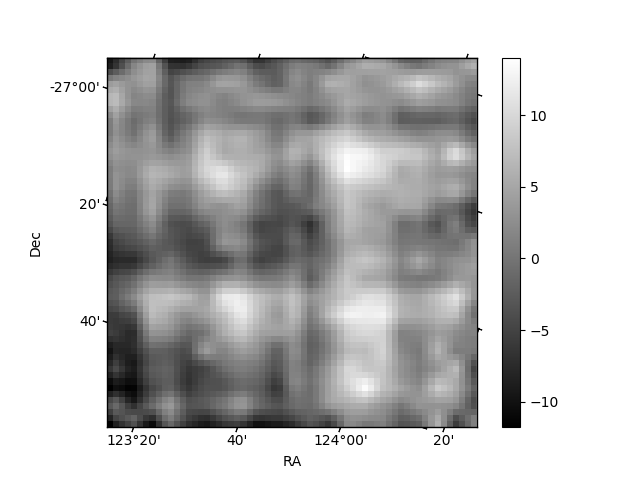
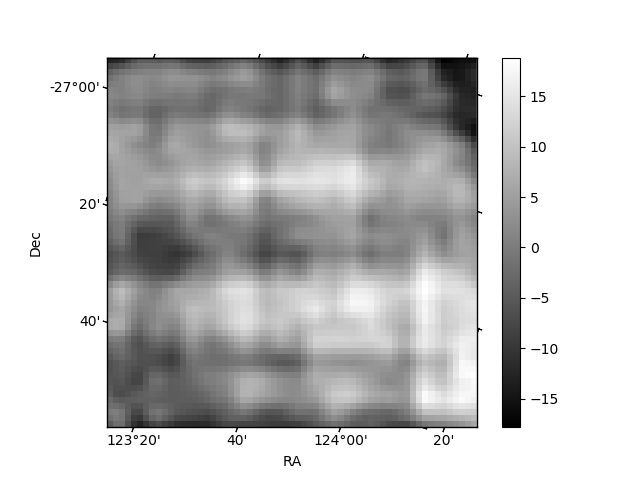
Histogram calculated using DETX and DETY for each event in the final _common_clean file
| Quadrant A | 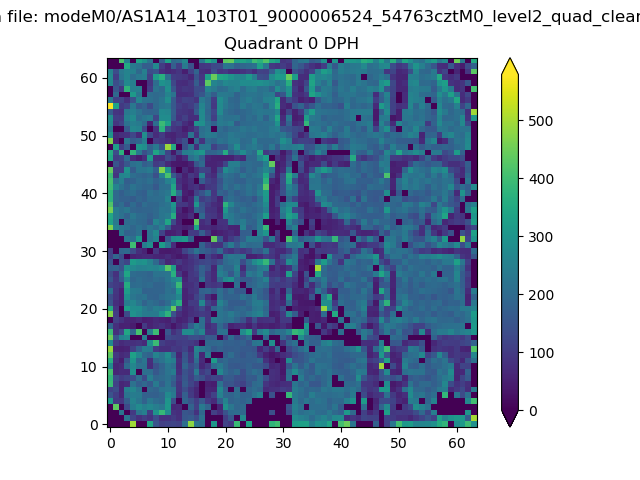 |
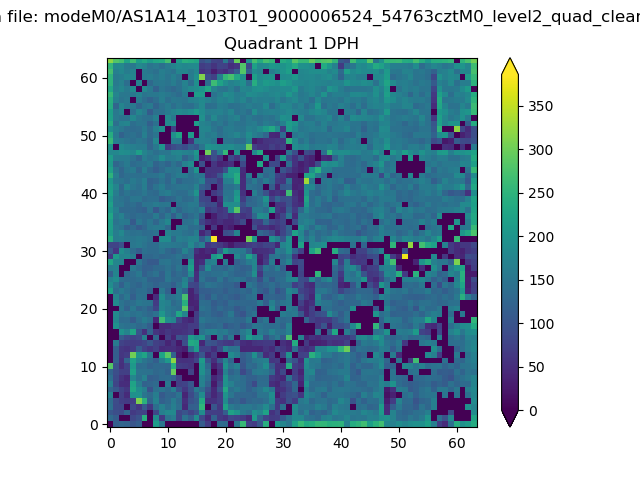 |
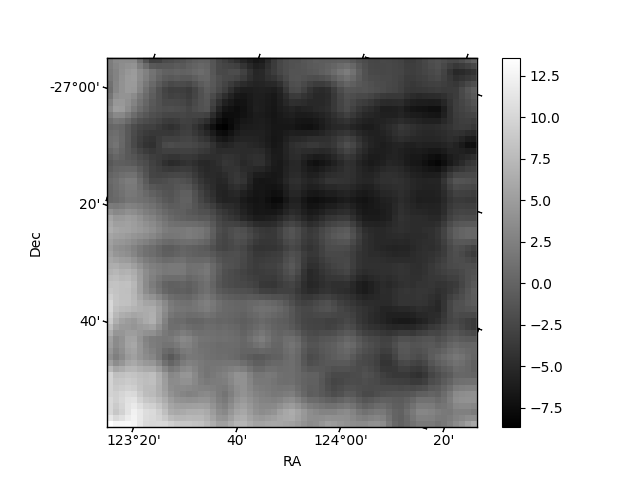
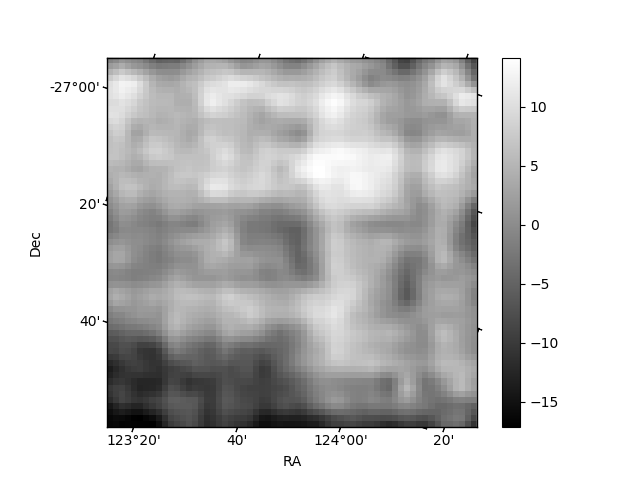
Quadrant B |
|---|---|---|---|
| Quadrant D | 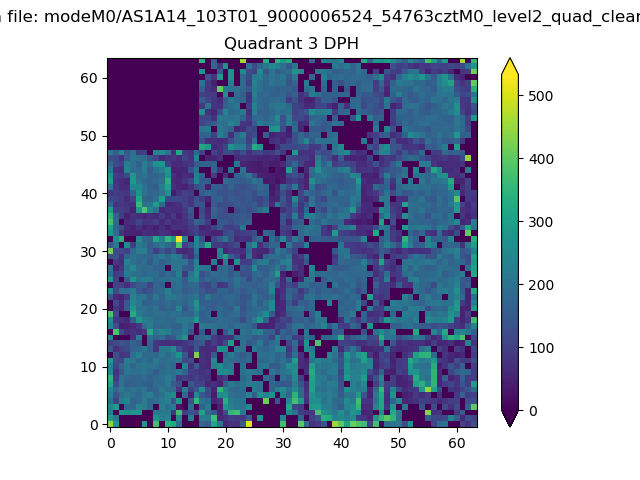 |
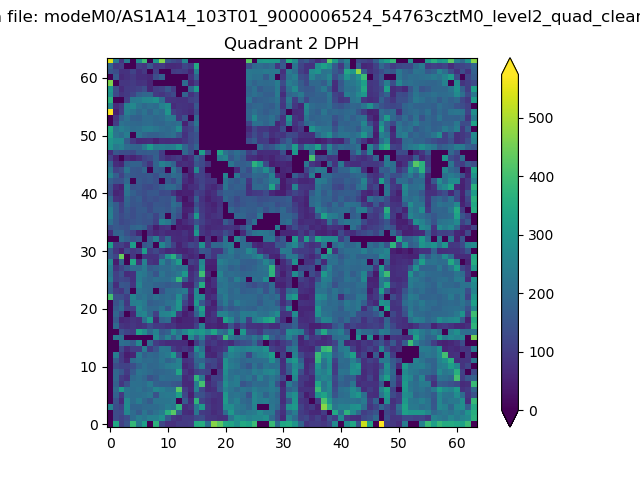 |
Quadrant C |
| Plot type | Count rate plots | Images |
|---|---|---|
| Comparison with Poisson distribution Blue bars denote a histogram of data divided into 1 sec bins. Red curve is a Poisson curve with rate = median count rate of data. |
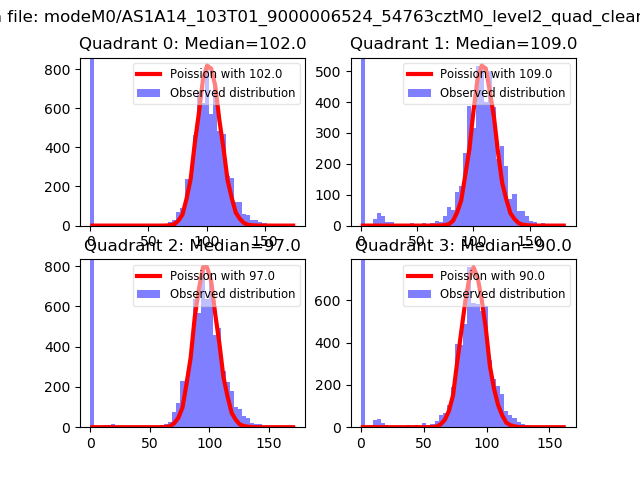 |
 |
| Quadrant-wise count rates Data is divided into 100 sec bins |
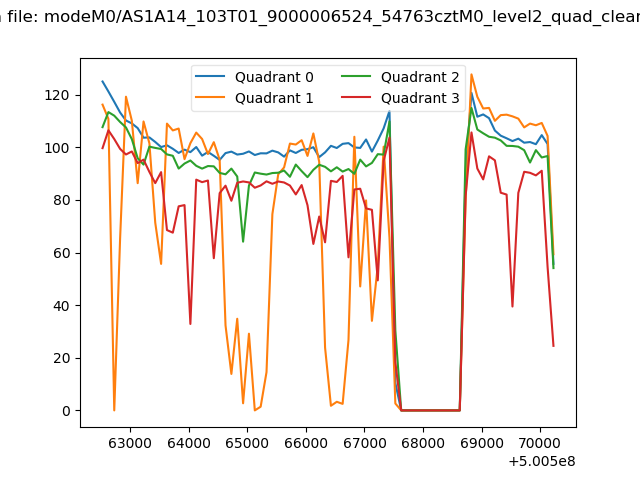 |
|
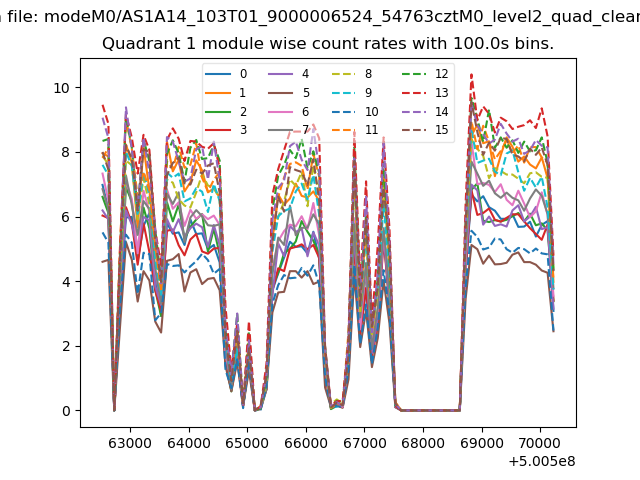
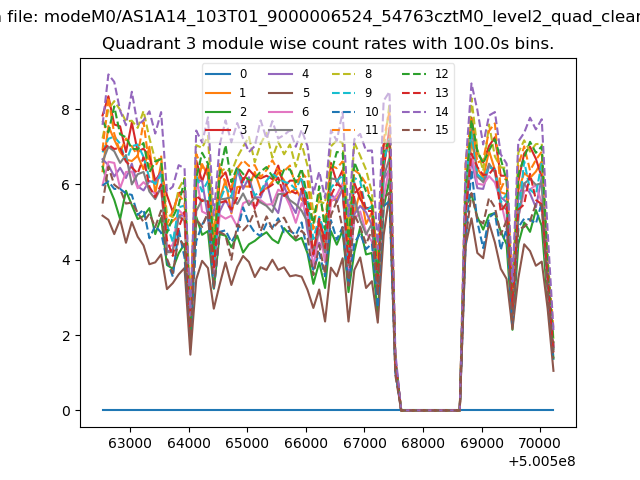
| Module-wise count rates for Quadrant A Data is divided into 100 sec bins |
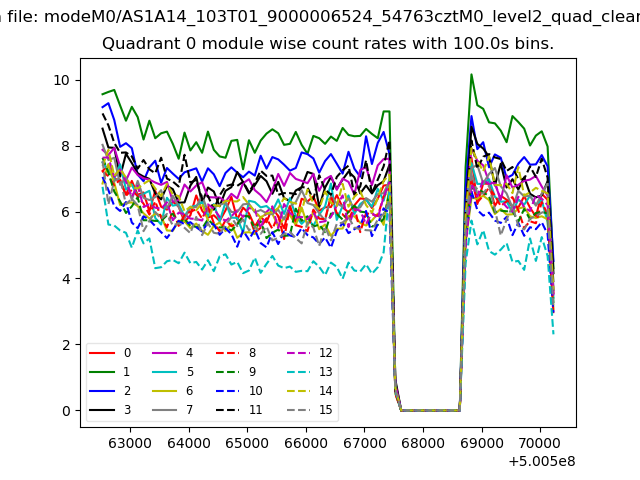 |
 |
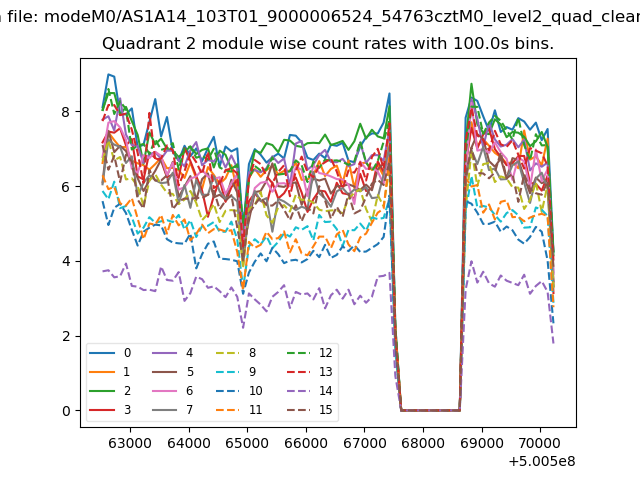
| Module-wise count rates for Quadrant B Data is divided into 100 sec bins |
 |
 |
| Module-wise count rates for Quadrant C Data is divided into 100 sec bins |
 |
 |
| Module-wise count rates for Quadrant D Data is divided into 100 sec bins |
 |
 |
| Parameter | Plot |
|---|---|
| CZT HV Monitor | 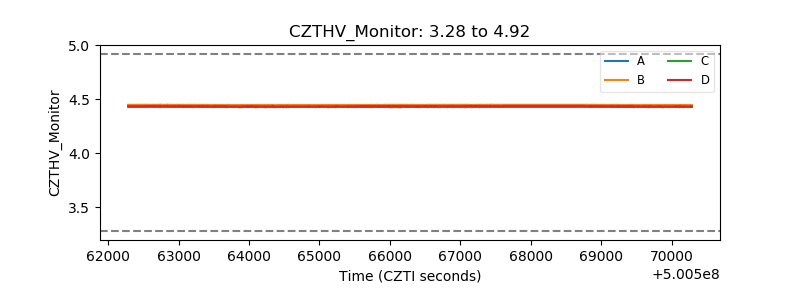 |
| D_VDD | 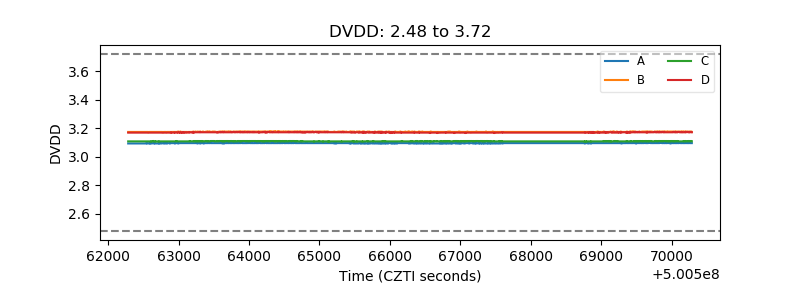 |
| Temperature 1 | 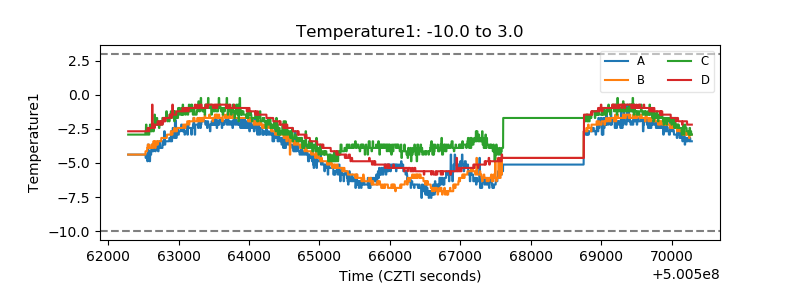 |
| Veto HV Monitor | 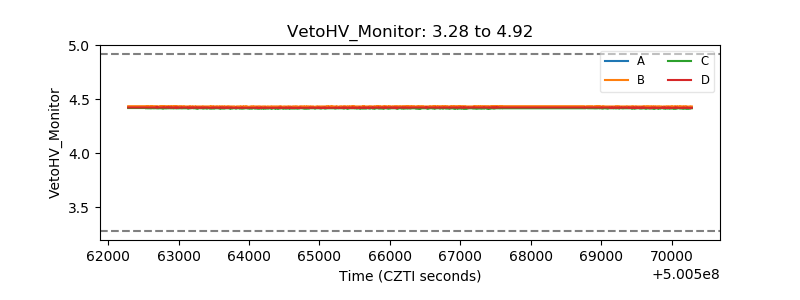 |
| Veto LLD | 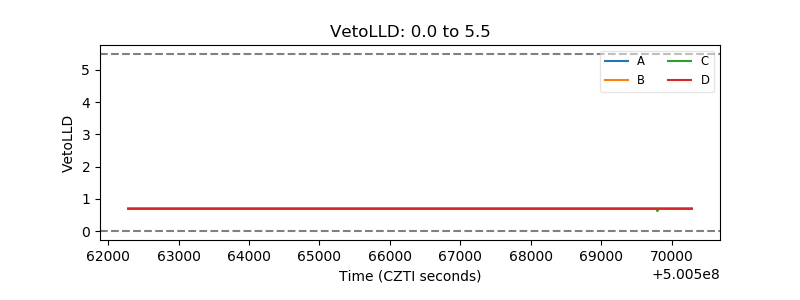 |
| Alpha Counter | 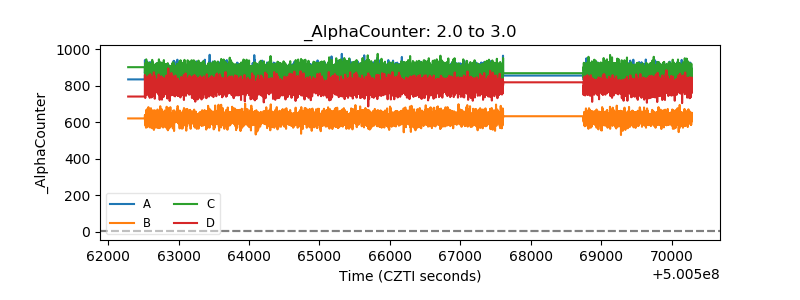 |
| _CPM_Rate | 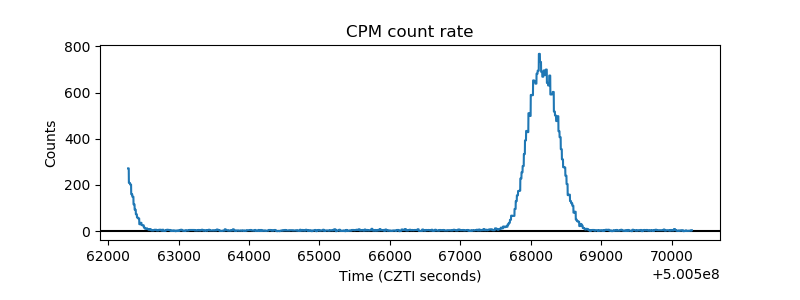 |
| CZT Counter | 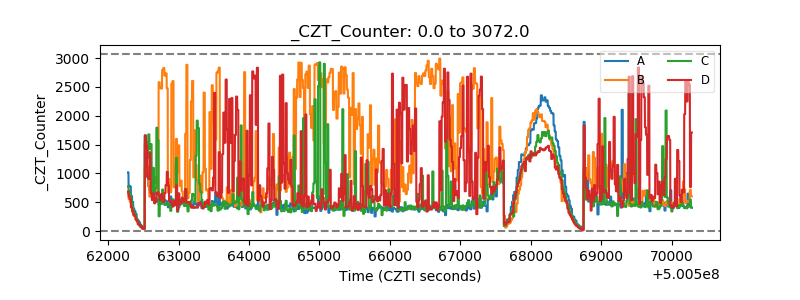 |
| +2.5 Volts monitor |  |
| +5 Volts monitor |  |
| _ROLL_ROT | 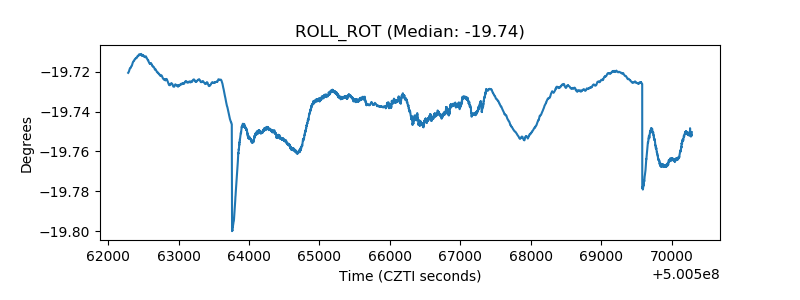 |
| _Roll_DEC | 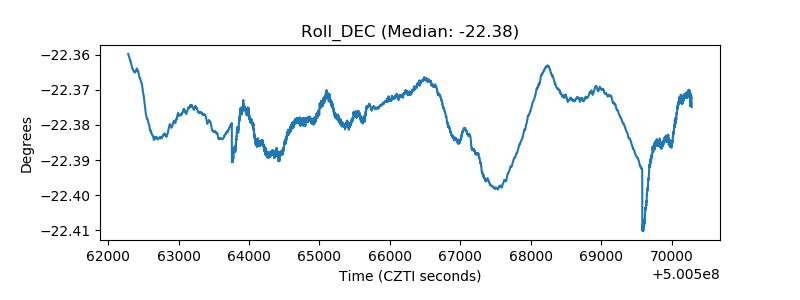 |
| _Roll_RA | 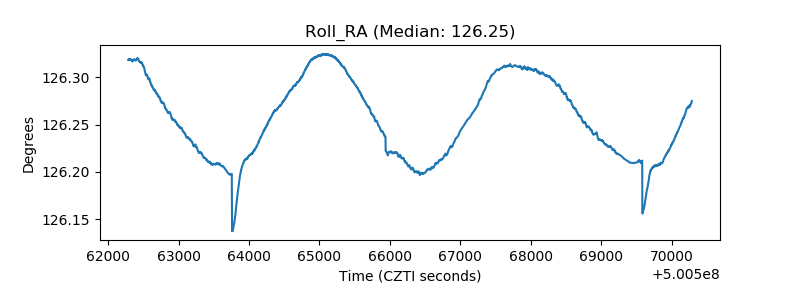 |
| Veto Counter | 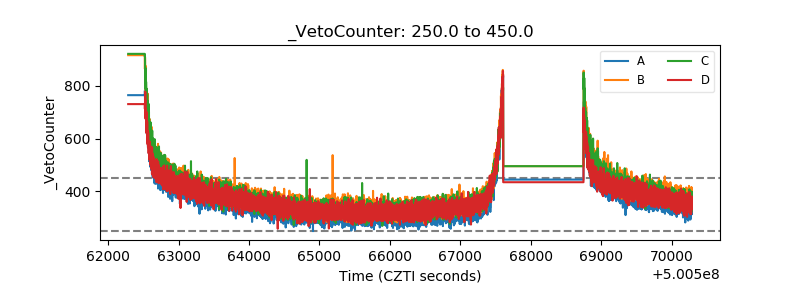 |