| Param | Original file | Final file |
|---|---|---|
| Filename | modeM0/AS1A14_103T01_9000006524_54764cztM0_level2.fits | modeM0/AS1A14_103T01_9000006524_54764cztM0_level2_quad_clean.evt |
| Size (bytes) | 595,183,680 | 92,980,800 |
| Size | 567.6 MB | 88.7 MB |
| Events in quadrant A | 3,240,067 | 659,916 |
| Events in quadrant B | 6,872,334 | 587,777 |
| Events in quadrant C | 4,417,628 | 607,680 |
| Events in quadrant D | 6,990,010 | 500,762 |
| Mode SS | |||
|---|---|---|---|
| Quadrant | BADHDUFLAG | Total packets | Discarded packets |
| A | 0 | 134 | 0 |
| B | 0 | 134 | 0 |
| C | 0 | 134 | 0 |
| D | 0 | 134 | 0 |
| Mode M0 | |||
|---|---|---|---|
| Quadrant | BADHDUFLAG | Total packets | Discarded packets |
| A | 0 | 14348 | 2 |
| B | 0 | 24873 | 2 |
| C | 0 | 17854 | 2 |
| D | 0 | 25415 | 2 |
| Mode M9 | |||
|---|---|---|---|
| Quadrant | BADHDUFLAG | Total packets | Discarded packets |
| A | 0 | 17 | 0 |
| B | 0 | 17 | 0 |
| C | 0 | 18 | 0 |
| D | 0 | 18 | 0 |
| Quadrant | Total seconds | Saturated seconds | Saturation percentage |
|---|---|---|---|
| A | 6588 | 162 | 2.459016% |
| B | 6588 | 1362 | 20.673953% |
| C | 6588 | 392 | 5.950213% |
| D | 6588 | 1245 | 18.897996% |
Noise dominated data is calculated using 1-second bins in cleaned event files. If a bin has >2000 counts, and if more than 50% of those come from <1% of pixels, then it is considered to be noise-dominated and hence unusable.
| Quadrant | # 1 sec bins | Bins with >0 counts | Bins with >2000 counts | High rate bins dominated by noise | Noise dominated (total time) | Noise dominated (detector-on time) | Marked lightcurve |
|---|---|---|---|---|---|---|---|
| A | 7718 | 6589 | 45 | 45 | 0.58% | 0.68% | 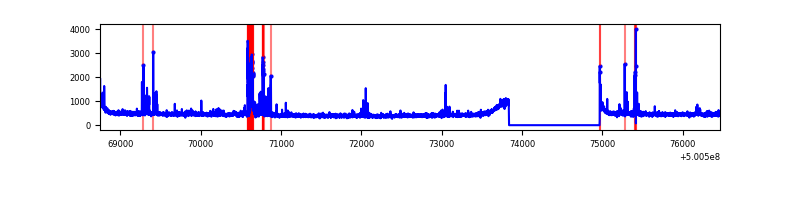 |
| B | 7718 | 6589 | 1006 | 1006 | 13.03% | 15.27% | 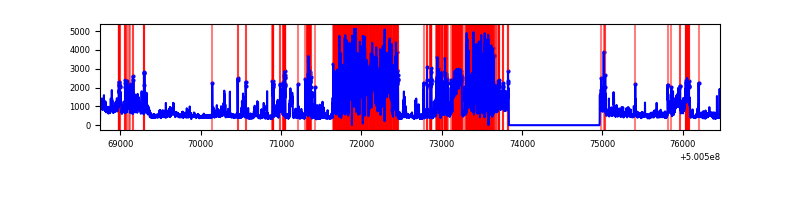 |
| C | 7718 | 6588 | 257 | 257 | 3.33% | 3.90% | 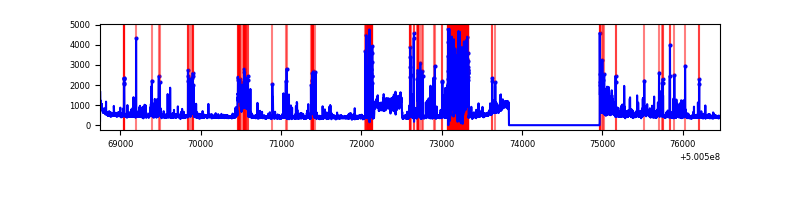 |
| D | 7718 | 6589 | 1127 | 1127 | 14.60% | 17.10% | 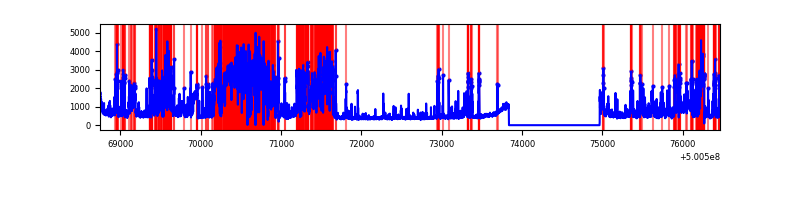 |
Top three noisy pixels from each quadrant. If the there are fewer than three noisy pixels in the level2.evt file, extra rows are filled as -1
| Pixel properties | Quadrant properties | ||||||
|---|---|---|---|---|---|---|---|
| Quadrant | DetID | PixID | Counts | Sigma | Mean | Median | Sigma |
| A | 0 | 8 | 164974 | 896.55 | 748 | 730 | 183.2 |
| A | 4 | 206 | 67947 | 366.91 | 748 | 730 | 183.2 |
| A | 5 | 240 | 56389 | 303.82 | 748 | 730 | 183.2 |
| B | 2 | 249 | 2835796 | 19742.0 | 667 | 642 | 143.6 |
| B | 10 | 28 | 689407 | 4796.07 | 667 | 642 | 143.6 |
| B | 0 | 213 | 293570 | 2039.74 | 667 | 642 | 143.6 |
| C | 4 | 5 | 1003605 | 5197.64 | 705 | 699 | 193.0 |
| C | 13 | 3 | 532005 | 2753.53 | 705 | 699 | 193.0 |
| C | 6 | 223 | 29103 | 147.21 | 705 | 699 | 193.0 |
| D | 3 | 12 | 3631471 | 19538.37 | 652 | 624 | 185.8 |
| D | 11 | 129 | 351450 | 1887.87 | 652 | 624 | 185.8 |
| D | 3 | 176 | 108236 | 579.08 | 652 | 624 | 185.8 |
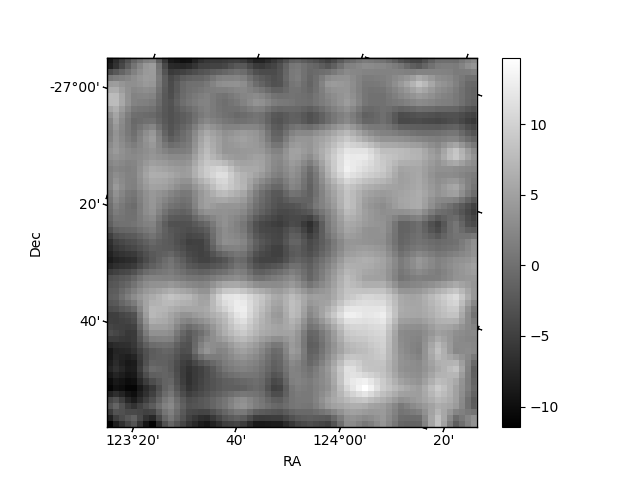
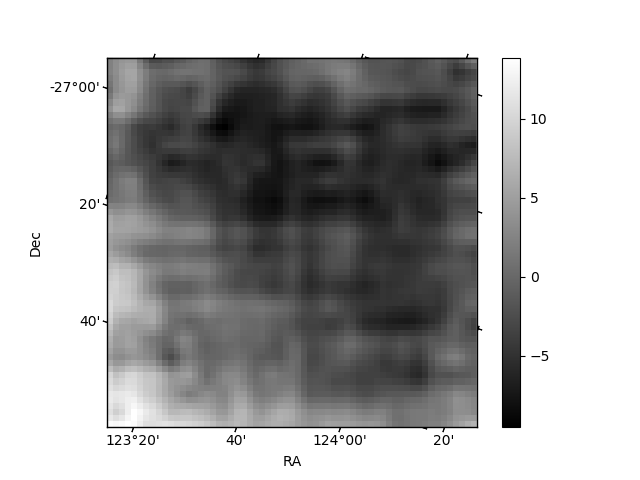
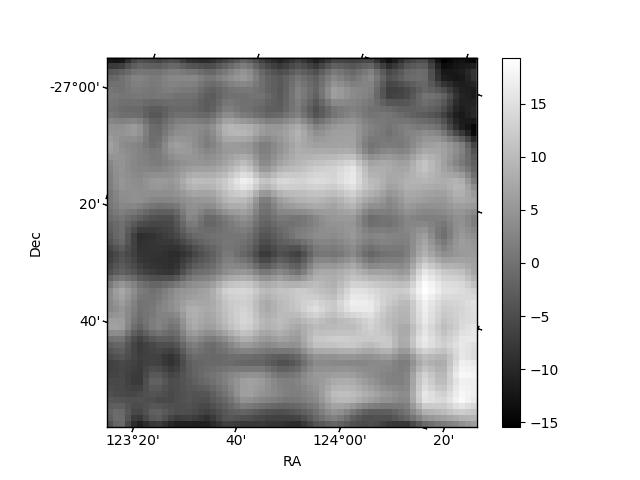
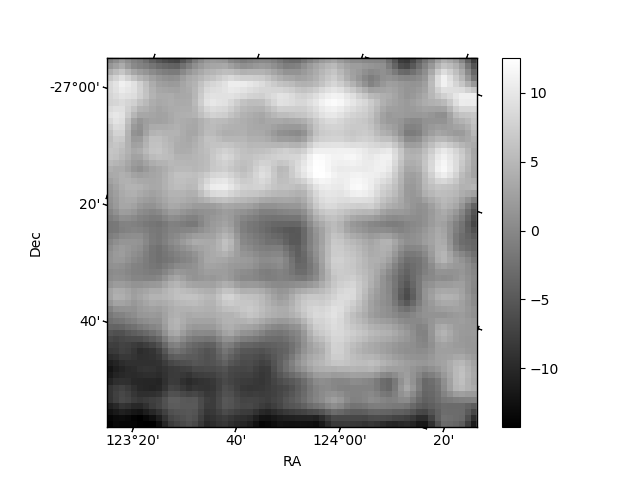
Histogram calculated using DETX and DETY for each event in the final _common_clean file
| Quadrant A | 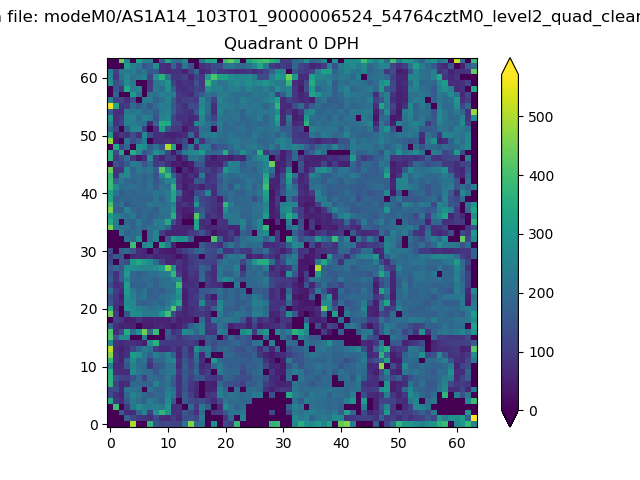 |
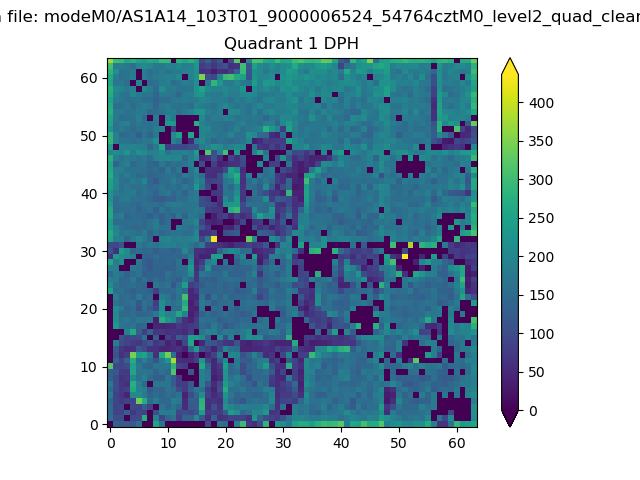 |
Quadrant B |
|---|---|---|---|
| Quadrant D | 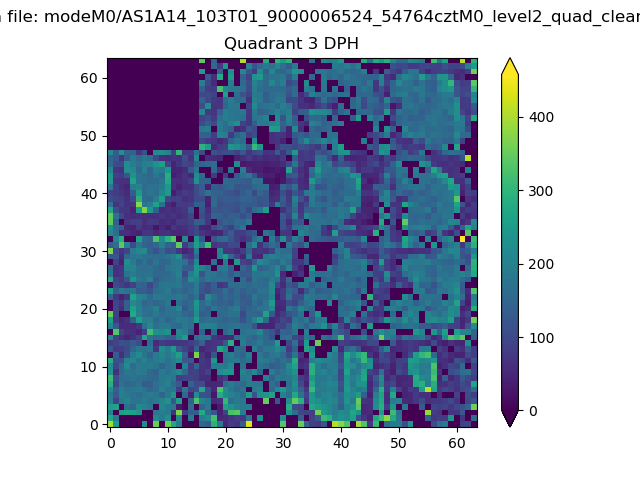 |
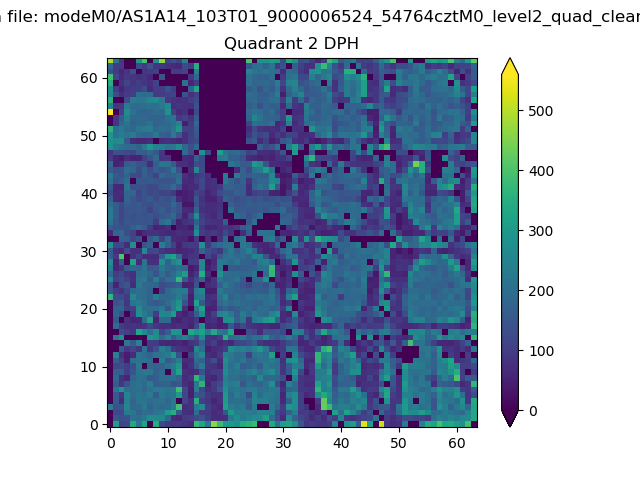 |
Quadrant C |
| Plot type | Count rate plots | Images |
|---|---|---|
| Comparison with Poisson distribution Blue bars denote a histogram of data divided into 1 sec bins. Red curve is a Poisson curve with rate = median count rate of data. |
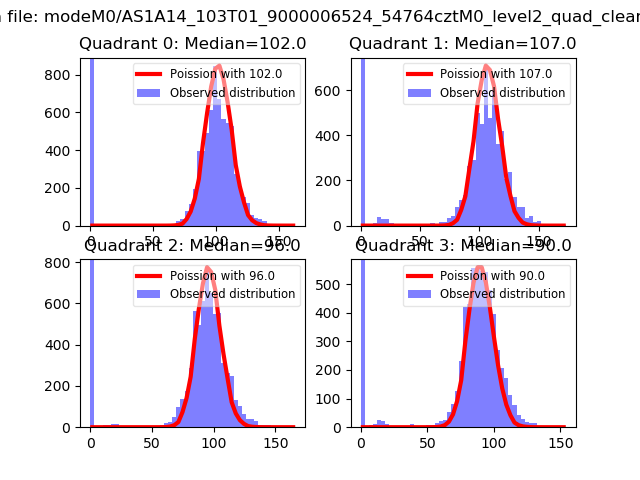 |
 |
| Quadrant-wise count rates Data is divided into 100 sec bins |
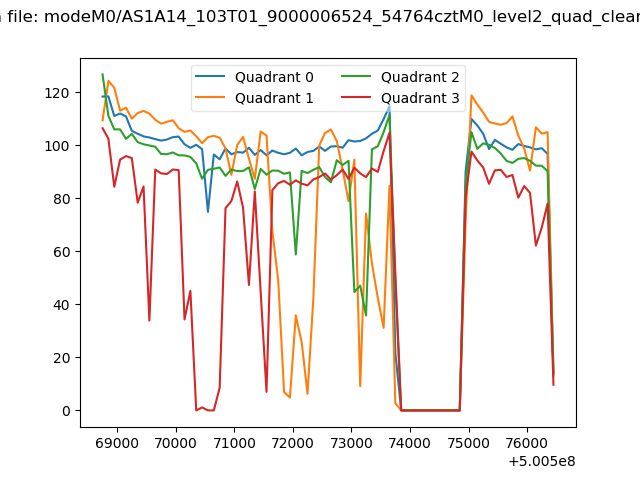 |
|
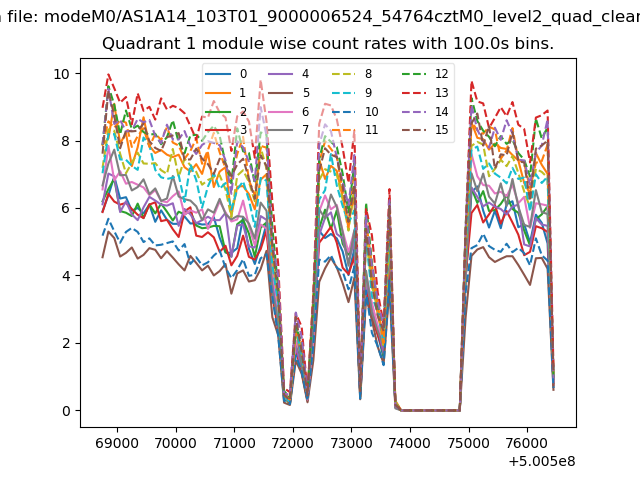
| Module-wise count rates for Quadrant A Data is divided into 100 sec bins |
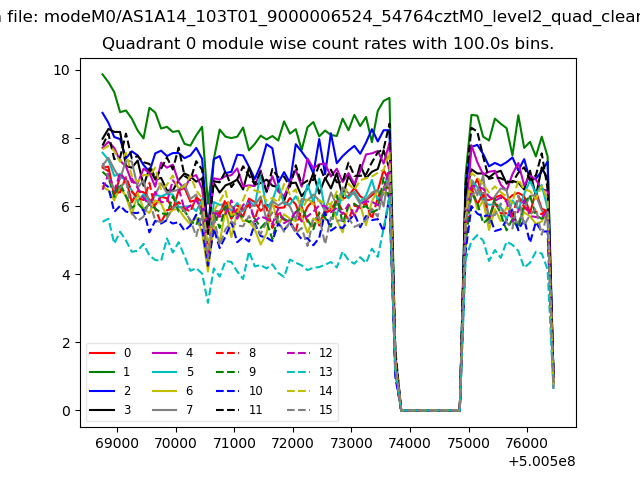 |
 |
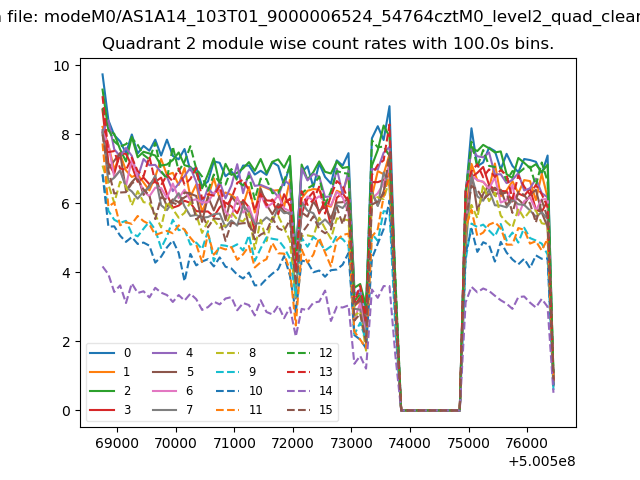
| Module-wise count rates for Quadrant B Data is divided into 100 sec bins |
 |
 |
| Module-wise count rates for Quadrant C Data is divided into 100 sec bins |
 |
 |
| Module-wise count rates for Quadrant D Data is divided into 100 sec bins |
 |
 |
| Parameter | Plot |
|---|---|
| CZT HV Monitor | 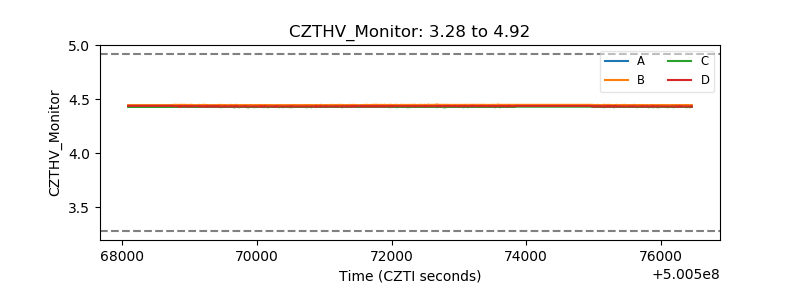 |
| D_VDD | 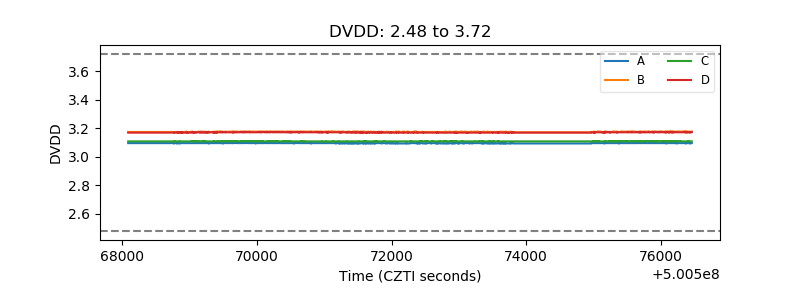 |
| Temperature 1 | 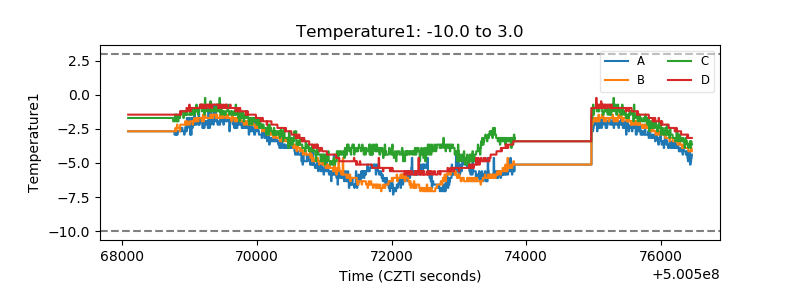 |
| Veto HV Monitor | 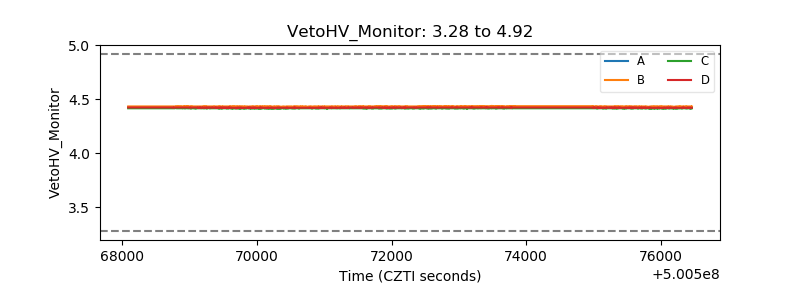 |
| Veto LLD | 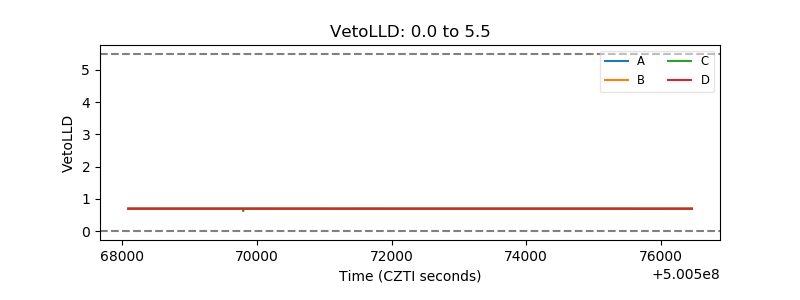 |
| Alpha Counter | 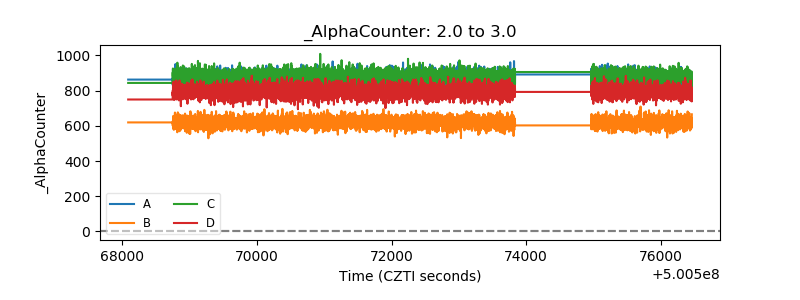 |
| _CPM_Rate | 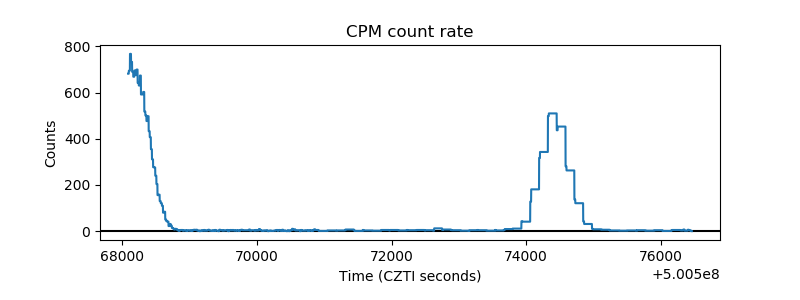 |
| CZT Counter | 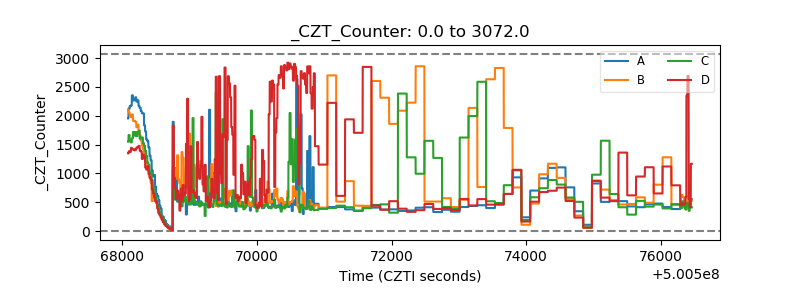 |
| +2.5 Volts monitor |  |
| +5 Volts monitor |  |
| _ROLL_ROT | 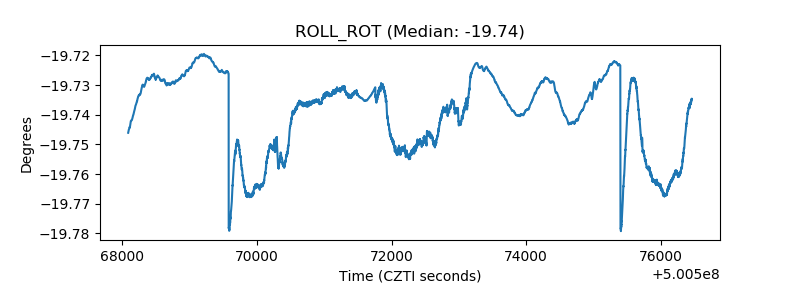 |
| _Roll_DEC | 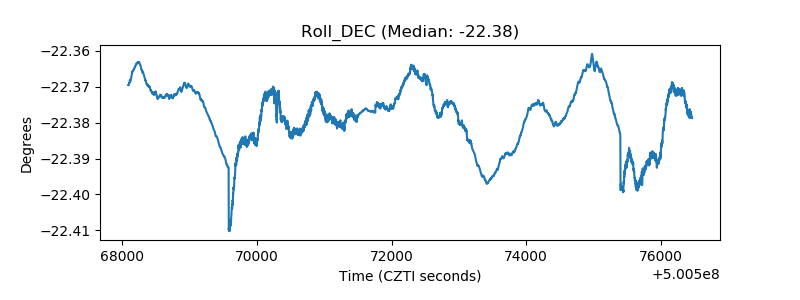 |
| _Roll_RA | 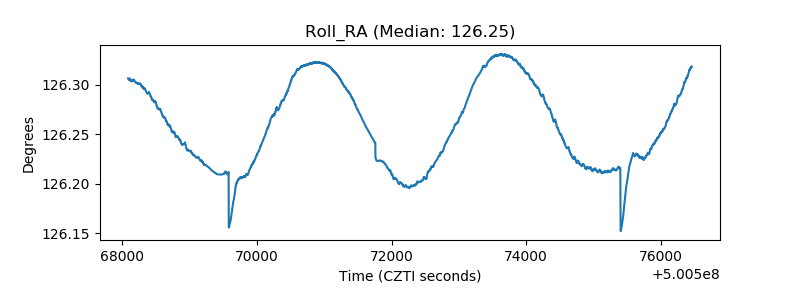 |
| Veto Counter | 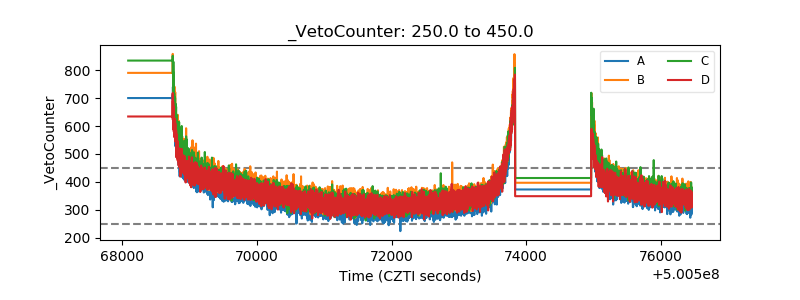 |