| Param | Original file | Final file |
|---|---|---|
| Filename | modeM0/AS1A14_103T01_9000006524_54765cztM0_level2.fits | modeM0/AS1A14_103T01_9000006524_54765cztM0_level2_quad_clean.evt |
| Size (bytes) | 664,421,760 | 88,142,400 |
| Size | 633.6 MB | 84.1 MB |
| Events in quadrant A | 3,121,936 | 649,429 |
| Events in quadrant B | 8,711,128 | 516,773 |
| Events in quadrant C | 7,274,209 | 473,380 |
| Events in quadrant D | 4,970,438 | 564,428 |
| Mode SS | |||
|---|---|---|---|
| Quadrant | BADHDUFLAG | Total packets | Discarded packets |
| A | 0 | 136 | 0 |
| B | 0 | 136 | 0 |
| C | 0 | 136 | 0 |
| D | 0 | 136 | 0 |
| Mode M0 | |||
|---|---|---|---|
| Quadrant | BADHDUFLAG | Total packets | Discarded packets |
| A | 0 | 14127 | 2 |
| B | 0 | 30472 | 2 |
| C | 0 | 26437 | 3 |
| D | 0 | 19612 | 2 |
| Mode M9 | |||
|---|---|---|---|
| Quadrant | BADHDUFLAG | Total packets | Discarded packets |
| A | 0 | 18 | 0 |
| B | 0 | 18 | 0 |
| C | 0 | 19 | 0 |
| D | 0 | 19 | 0 |
| Quadrant | Total seconds | Saturated seconds | Saturation percentage |
|---|---|---|---|
| A | 6664 | 104 | 1.560624% |
| B | 6664 | 2047 | 30.717287% |
| C | 6663 | 1814 | 27.224974% |
| D | 6663 | 367 | 5.508029% |
Noise dominated data is calculated using 1-second bins in cleaned event files. If a bin has >2000 counts, and if more than 50% of those come from <1% of pixels, then it is considered to be noise-dominated and hence unusable.
| Quadrant | # 1 sec bins | Bins with >0 counts | Bins with >2000 counts | High rate bins dominated by noise | Noise dominated (total time) | Noise dominated (detector-on time) | Marked lightcurve |
|---|---|---|---|---|---|---|---|
| A | 7654 | 6665 | 11 | 11 | 0.14% | 0.17% | 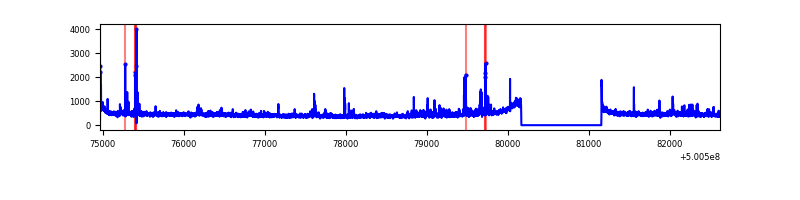 |
| B | 7654 | 6664 | 1649 | 1649 | 21.54% | 24.74% | 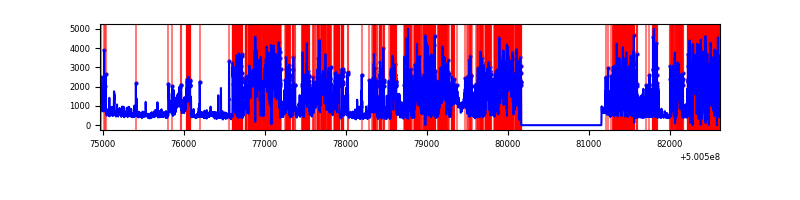 |
| C | 7653 | 6663 | 1158 | 1158 | 15.13% | 17.38% | 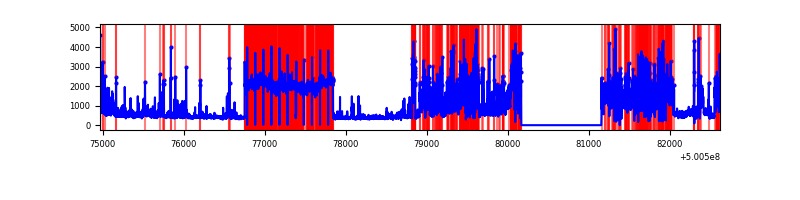 |
| D | 7653 | 6664 | 297 | 297 | 3.88% | 4.46% | 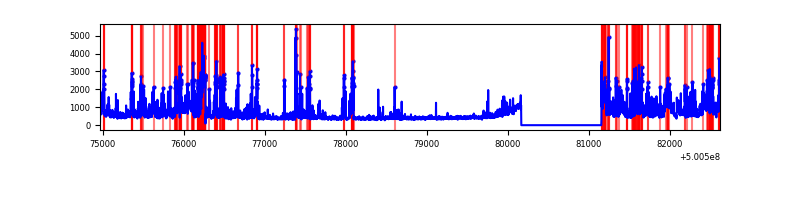 |
Top three noisy pixels from each quadrant. If the there are fewer than three noisy pixels in the level2.evt file, extra rows are filled as -1
| Pixel properties | Quadrant properties | ||||||
|---|---|---|---|---|---|---|---|
| Quadrant | DetID | PixID | Counts | Sigma | Mean | Median | Sigma |
| A | 4 | 206 | 125707 | 688.89 | 740 | 720 | 181.4 |
| A | 4 | 3 | 37456 | 202.48 | 740 | 720 | 181.4 |
| A | 4 | 249 | 33478 | 180.55 | 740 | 720 | 181.4 |
| B | 2 | 249 | 4944206 | 37876.52 | 606 | 584 | 130.5 |
| B | 1 | 207 | 700671 | 5363.85 | 606 | 584 | 130.5 |
| B | 10 | 28 | 377804 | 2890.14 | 606 | 584 | 130.5 |
| C | 4 | 5 | 4625239 | 29450.28 | 574 | 569 | 157.0 |
| C | 13 | 3 | 198967 | 1263.42 | 574 | 569 | 157.0 |
| C | 6 | 223 | 68906 | 435.18 | 574 | 569 | 157.0 |
| D | 3 | 12 | 1312786 | 6503.31 | 702 | 670 | 201.8 |
| D | 11 | 129 | 371973 | 1840.31 | 702 | 670 | 201.8 |
| D | 8 | 160 | 217708 | 1075.72 | 702 | 670 | 201.8 |
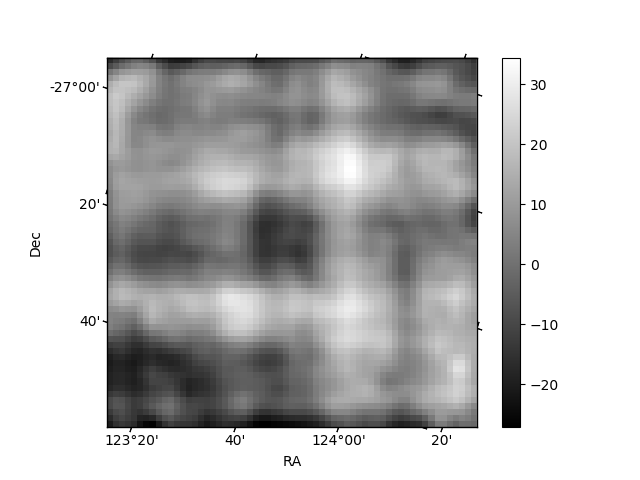
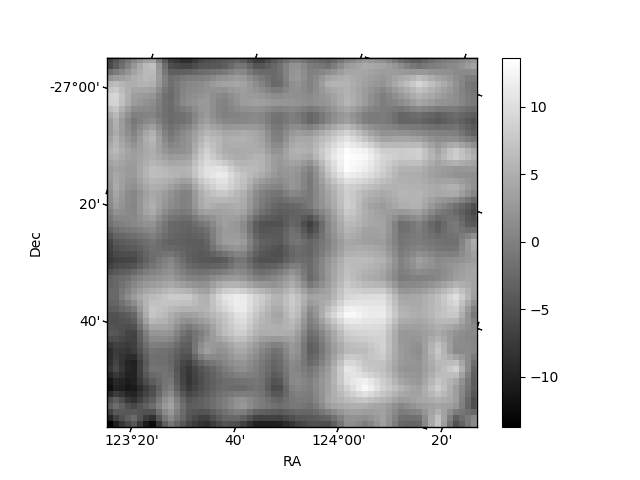
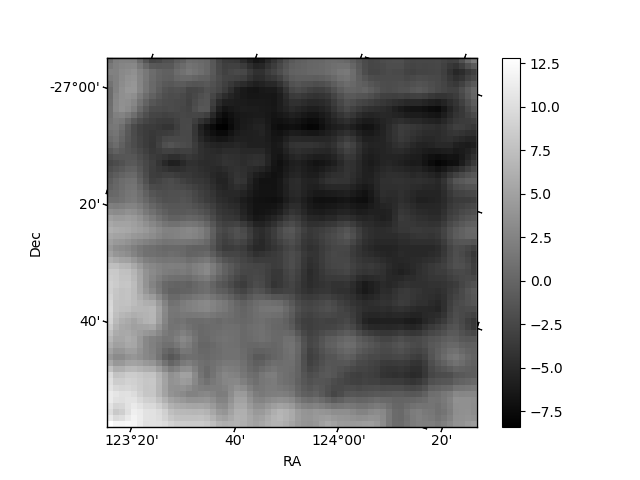
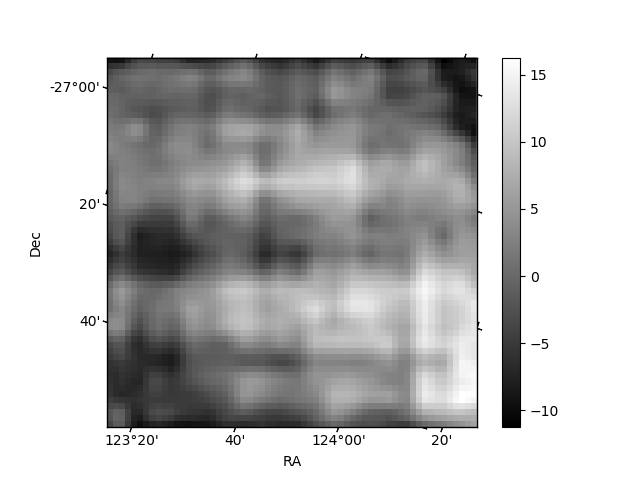
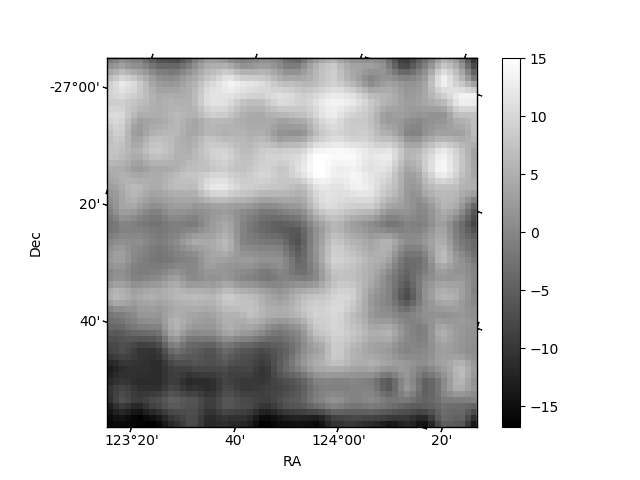
Histogram calculated using DETX and DETY for each event in the final _common_clean file
| Quadrant A | 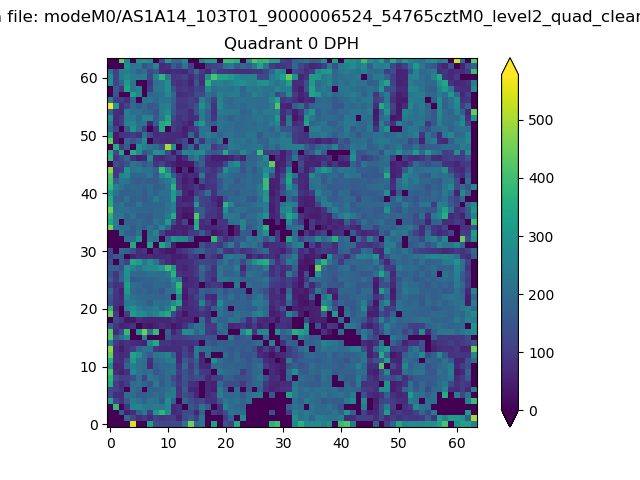 |
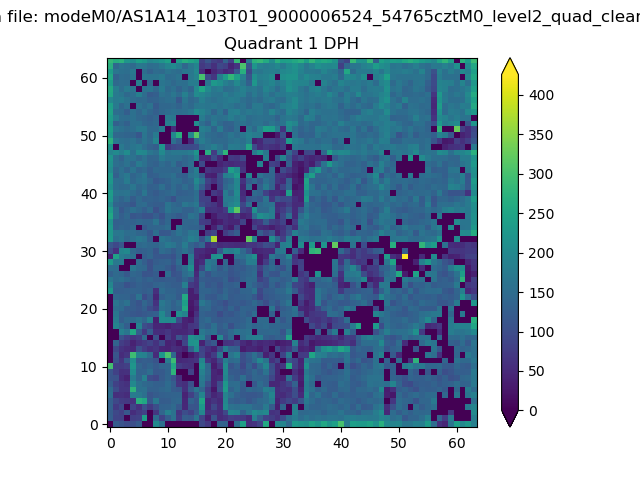 |
Quadrant B |
|---|---|---|---|
| Quadrant D | 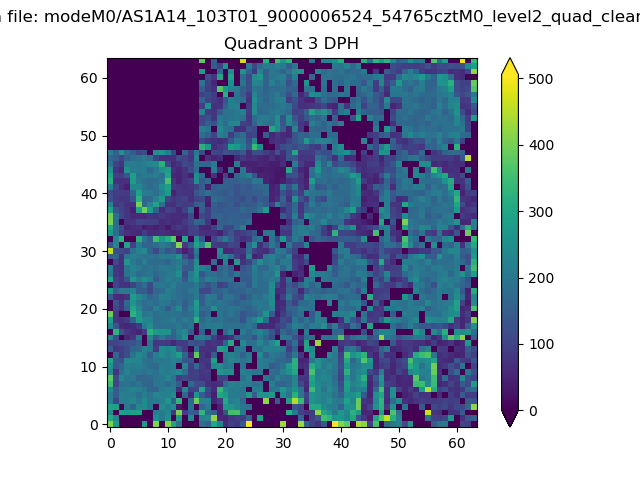 |
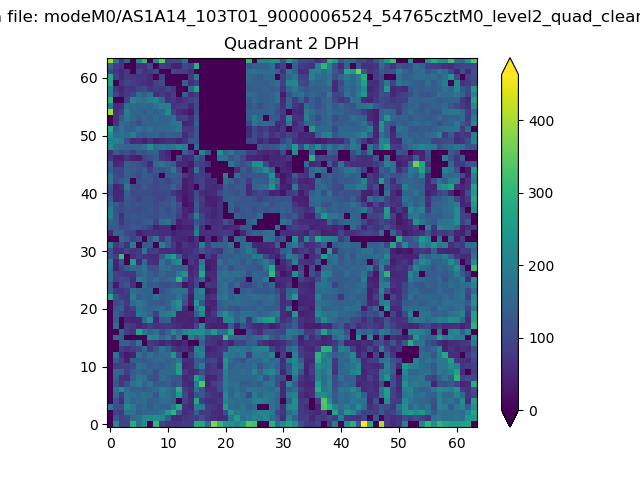 |
Quadrant C |
| Plot type | Count rate plots | Images |
|---|---|---|
| Comparison with Poisson distribution Blue bars denote a histogram of data divided into 1 sec bins. Red curve is a Poisson curve with rate = median count rate of data. |
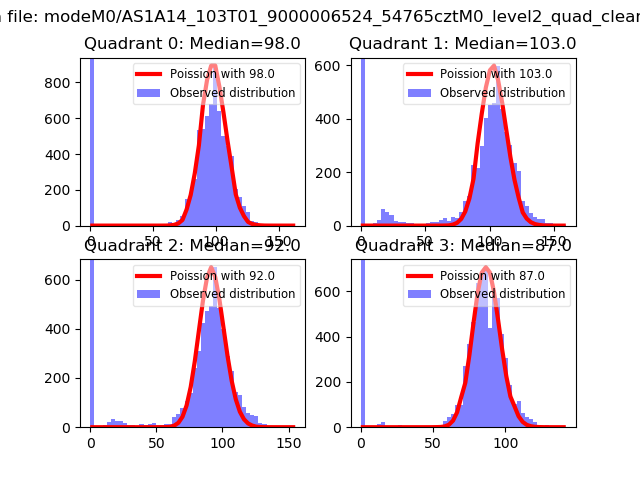 |
 |
| Quadrant-wise count rates Data is divided into 100 sec bins |
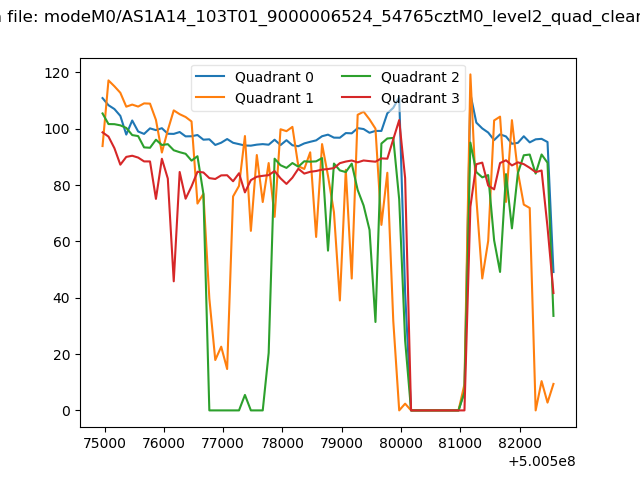 |
|
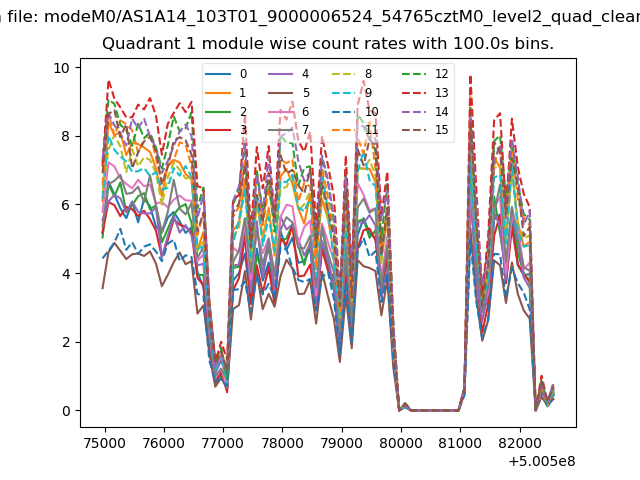
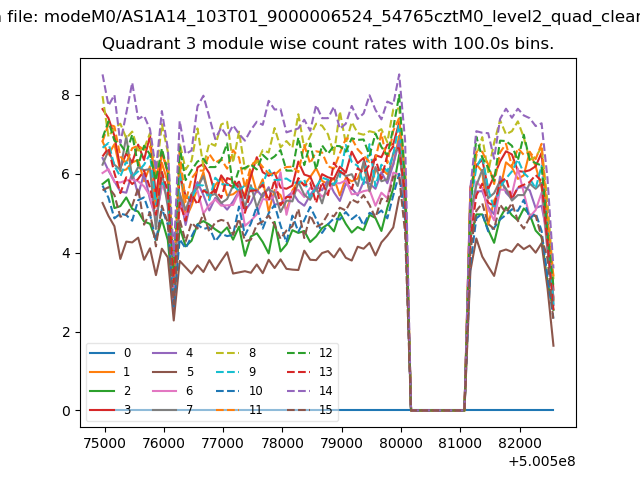
| Module-wise count rates for Quadrant A Data is divided into 100 sec bins |
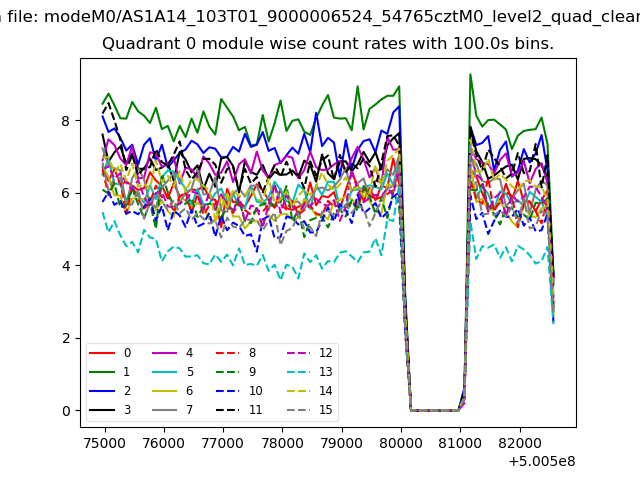 |
 |
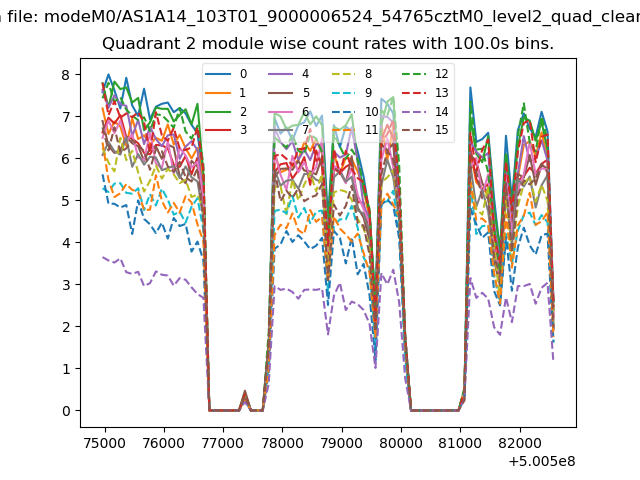
| Module-wise count rates for Quadrant B Data is divided into 100 sec bins |
 |
 |
| Module-wise count rates for Quadrant C Data is divided into 100 sec bins |
 |
 |
| Module-wise count rates for Quadrant D Data is divided into 100 sec bins |
 |
 |
| Parameter | Plot |
|---|---|
| CZT HV Monitor | 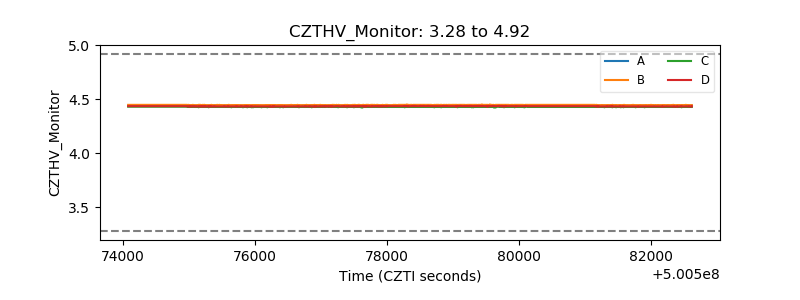 |
| D_VDD | 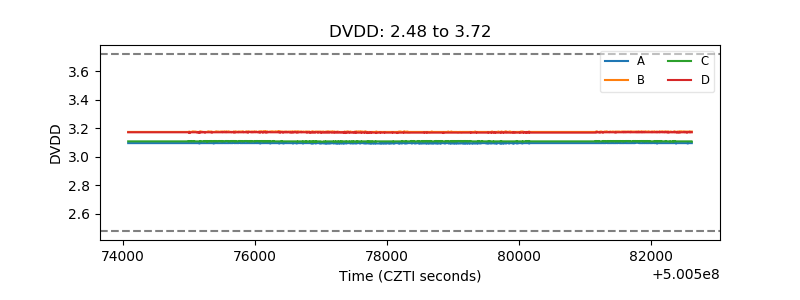 |
| Temperature 1 | 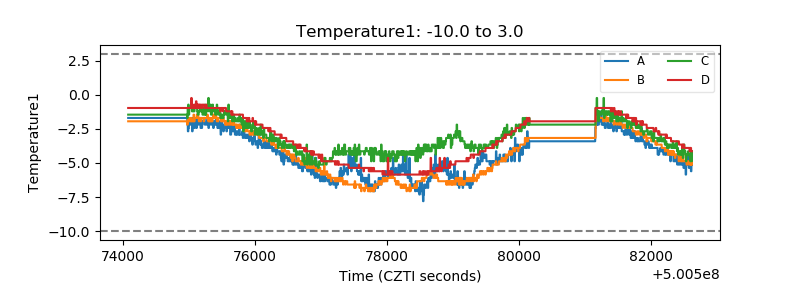 |
| Veto HV Monitor | 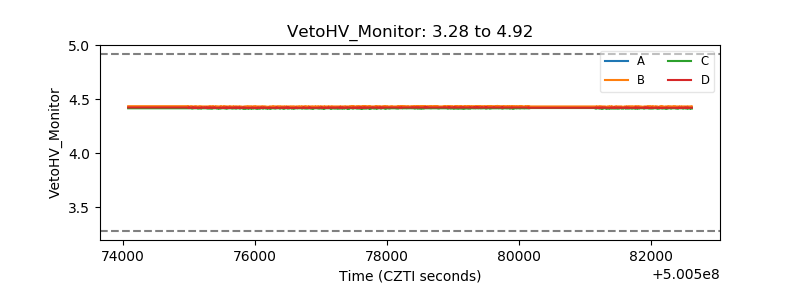 |
| Veto LLD | 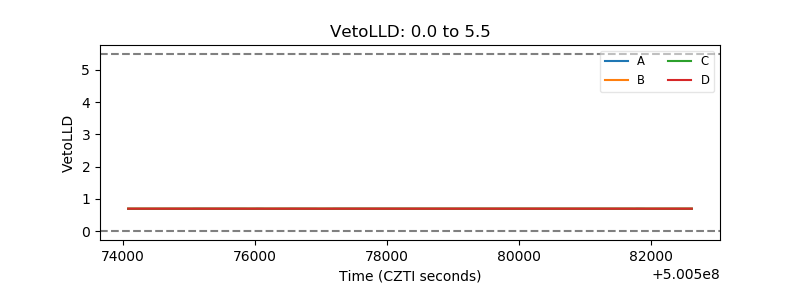 |
| Alpha Counter | 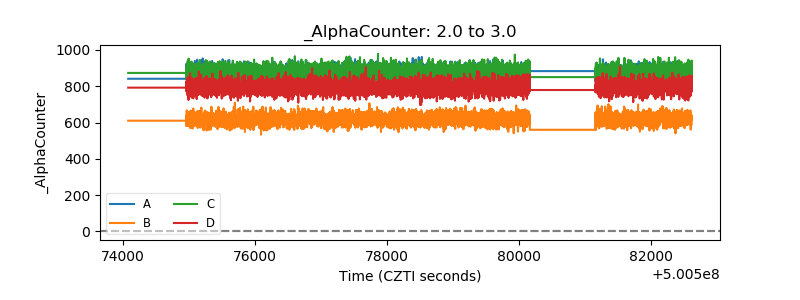 |
| _CPM_Rate | 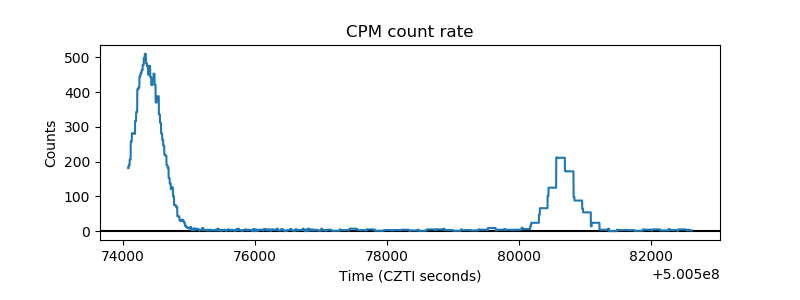 |
| CZT Counter | 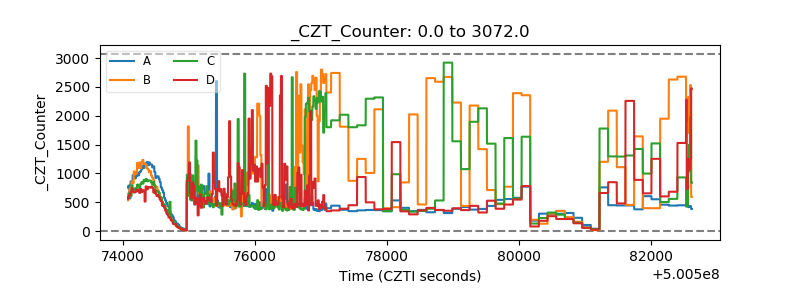 |
| +2.5 Volts monitor | 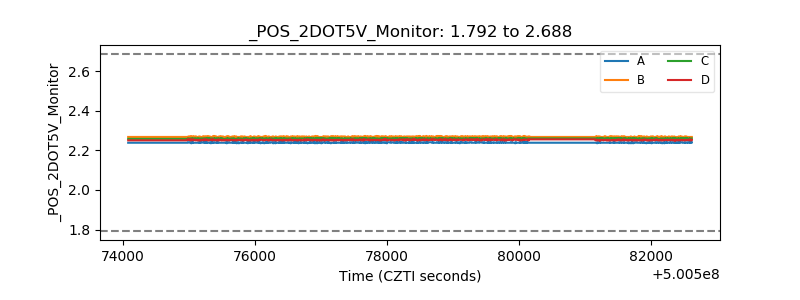 |
| +5 Volts monitor |  |
| _ROLL_ROT | 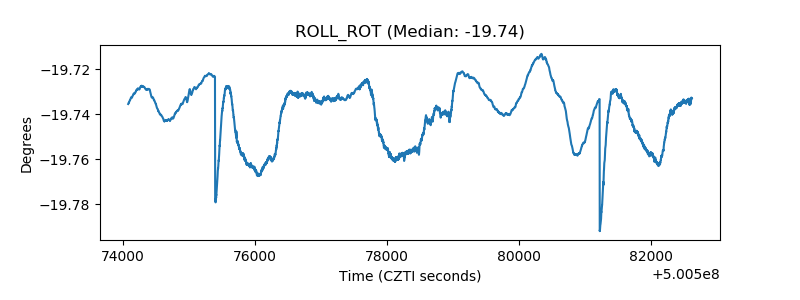 |
| _Roll_DEC | 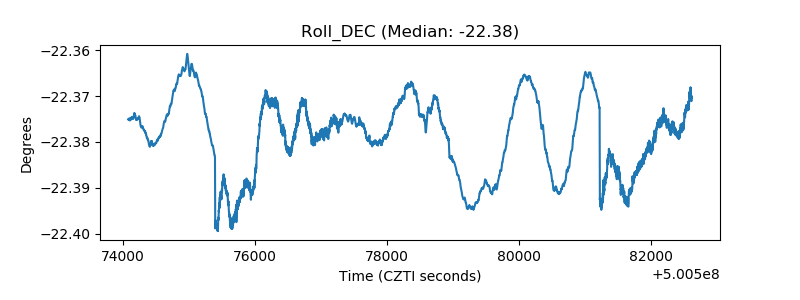 |
| _Roll_RA | 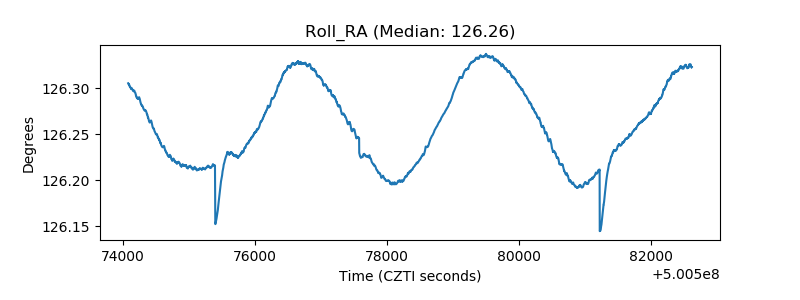 |
| Veto Counter | 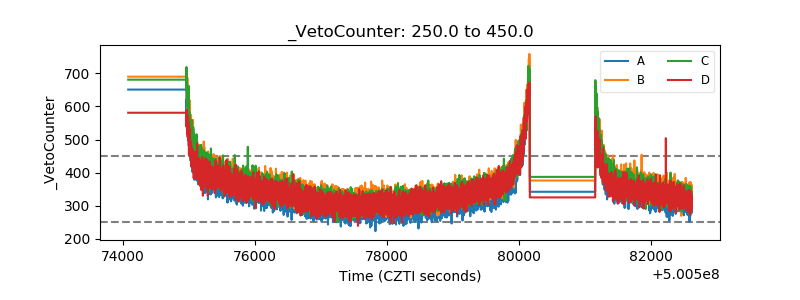 |