| Param | Original file | Final file |
|---|---|---|
| Filename | modeM0/AS1A14_103T01_9000006524_54766cztM0_level2.fits | modeM0/AS1A14_103T01_9000006524_54766cztM0_level2_quad_clean.evt |
| Size (bytes) | 725,814,720 | 90,492,480 |
| Size | 692.2 MB | 86.3 MB |
| Events in quadrant A | 3,190,364 | 672,701 |
| Events in quadrant B | 10,293,127 | 446,005 |
| Events in quadrant C | 5,914,254 | 599,018 |
| Events in quadrant D | 6,918,123 | 527,233 |
| Mode SS | |||
|---|---|---|---|
| Quadrant | BADHDUFLAG | Total packets | Discarded packets |
| A | 0 | 146 | 0 |
| B | 0 | 146 | 0 |
| C | 0 | 146 | 0 |
| D | 0 | 146 | 0 |
| Mode M0 | |||
|---|---|---|---|
| Quadrant | BADHDUFLAG | Total packets | Discarded packets |
| A | 0 | 14854 | 3 |
| B | 0 | 35469 | 2 |
| C | 0 | 22626 | 2 |
| D | 0 | 25753 | 2 |
| Mode M9 | |||
|---|---|---|---|
| Quadrant | BADHDUFLAG | Total packets | Discarded packets |
| A | 0 | 17 | 0 |
| B | 0 | 17 | 0 |
| C | 0 | 17 | 0 |
| D | 0 | 17 | 0 |
| Quadrant | Total seconds | Saturated seconds | Saturation percentage |
|---|---|---|---|
| A | 7103 | 114 | 1.604956% |
| B | 7104 | 3069 | 43.201014% |
| C | 7104 | 713 | 10.036599% |
| D | 7104 | 1100 | 15.484234% |
Noise dominated data is calculated using 1-second bins in cleaned event files. If a bin has >2000 counts, and if more than 50% of those come from <1% of pixels, then it is considered to be noise-dominated and hence unusable.
| Quadrant | # 1 sec bins | Bins with >0 counts | Bins with >2000 counts | High rate bins dominated by noise | Noise dominated (total time) | Noise dominated (detector-on time) | Marked lightcurve |
|---|---|---|---|---|---|---|---|
| A | 8763 | 7105 | 1 | 1 | 0.01% | 0.01% | 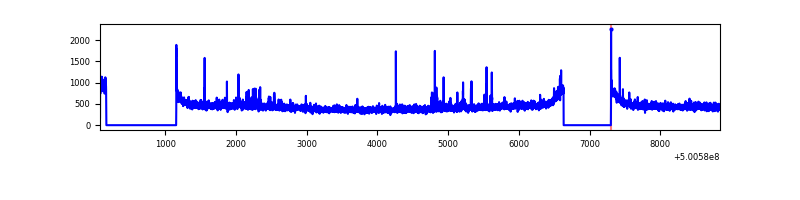 |
| B | 8764 | 7105 | 2236 | 2236 | 25.51% | 31.47% | 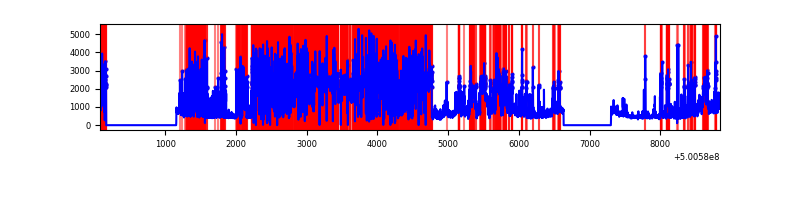 |
| C | 8764 | 7105 | 486 | 486 | 5.55% | 6.84% | 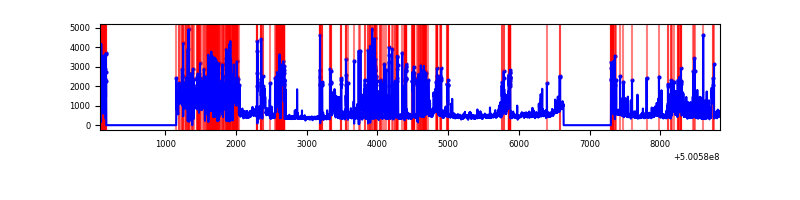 |
| D | 8764 | 7106 | 911 | 911 | 10.39% | 12.82% | 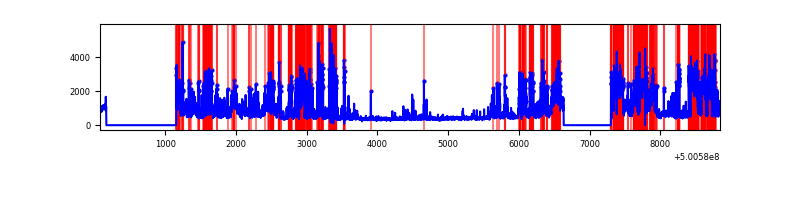 |
Top three noisy pixels from each quadrant. If the there are fewer than three noisy pixels in the level2.evt file, extra rows are filled as -1
| Pixel properties | Quadrant properties | ||||||
|---|---|---|---|---|---|---|---|
| Quadrant | DetID | PixID | Counts | Sigma | Mean | Median | Sigma |
| A | 4 | 206 | 59322 | 307.38 | 776 | 757 | 190.5 |
| A | 4 | 3 | 37032 | 190.39 | 776 | 757 | 190.5 |
| A | 3 | 14 | 35434 | 182.0 | 776 | 757 | 190.5 |
| B | 2 | 249 | 7123659 | 57775.21 | 565 | 543 | 123.3 |
| B | 1 | 207 | 558560 | 4526.05 | 565 | 543 | 123.3 |
| B | 10 | 247 | 85638 | 690.2 | 565 | 543 | 123.3 |
| C | 4 | 5 | 2253902 | 11524.73 | 714 | 707 | 195.5 |
| C | 9 | 38 | 282933 | 1443.54 | 714 | 707 | 195.5 |
| C | 13 | 3 | 282636 | 1442.02 | 714 | 707 | 195.5 |
| D | 3 | 12 | 3181458 | 16319.3 | 689 | 658 | 194.9 |
| D | 11 | 129 | 325440 | 1666.31 | 689 | 658 | 194.9 |
| D | 8 | 160 | 252596 | 1292.58 | 689 | 658 | 194.9 |
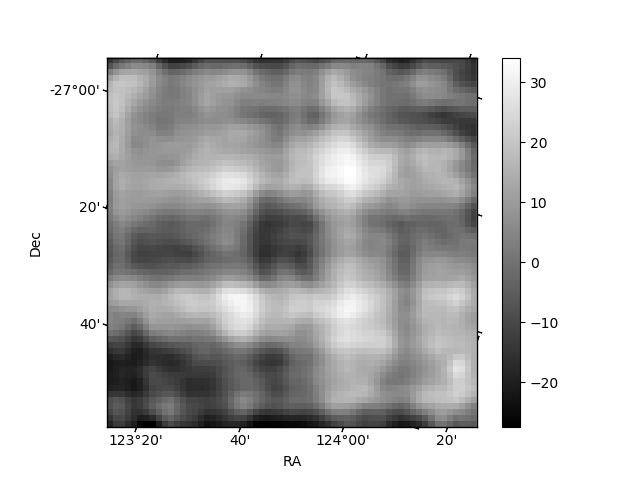
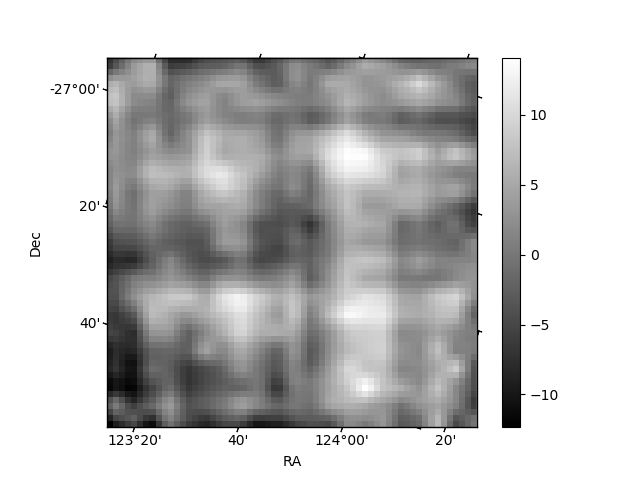
Histogram calculated using DETX and DETY for each event in the final _common_clean file
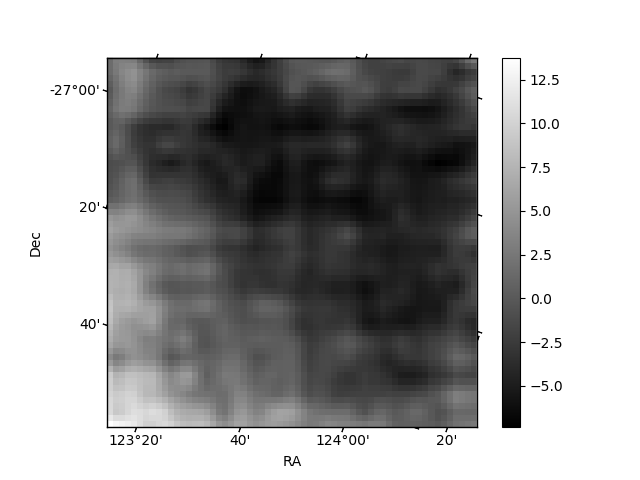
| Quadrant A | 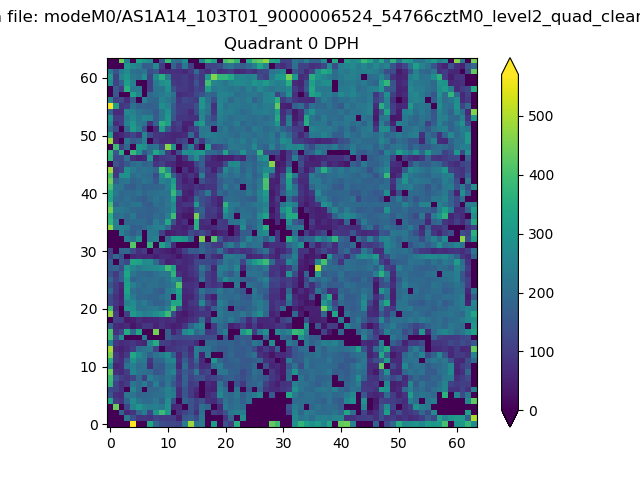 |
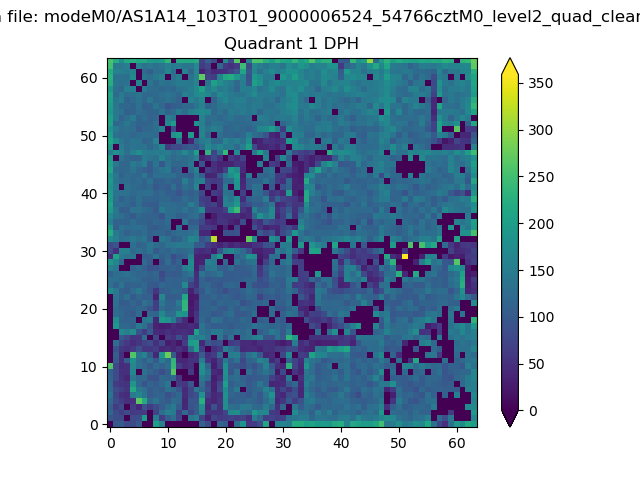 |
Quadrant B |
|---|---|---|---|
| Quadrant D | 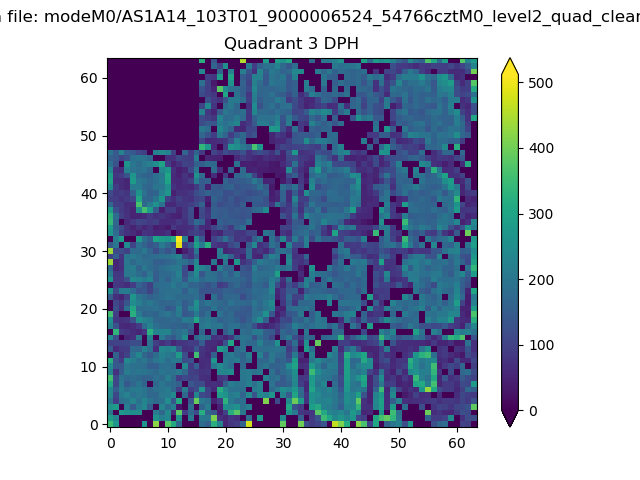 |
 |
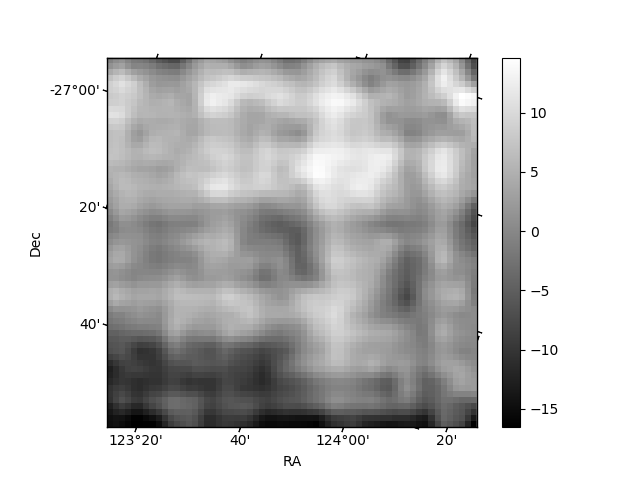
Quadrant C |
| Plot type | Count rate plots | Images |
|---|---|---|
| Comparison with Poisson distribution Blue bars denote a histogram of data divided into 1 sec bins. Red curve is a Poisson curve with rate = median count rate of data. |
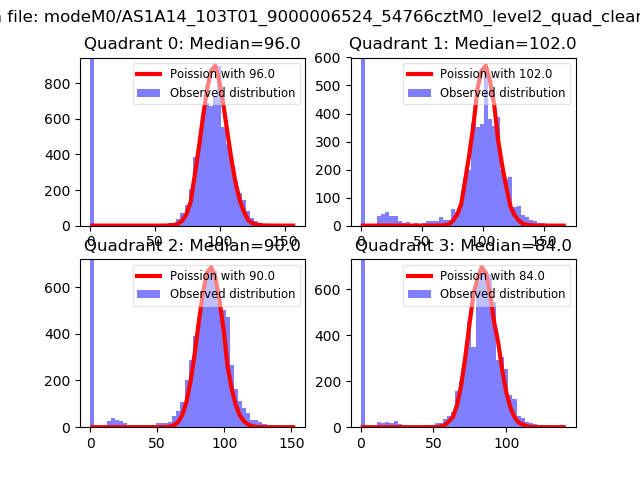 |
 |
| Quadrant-wise count rates Data is divided into 100 sec bins |
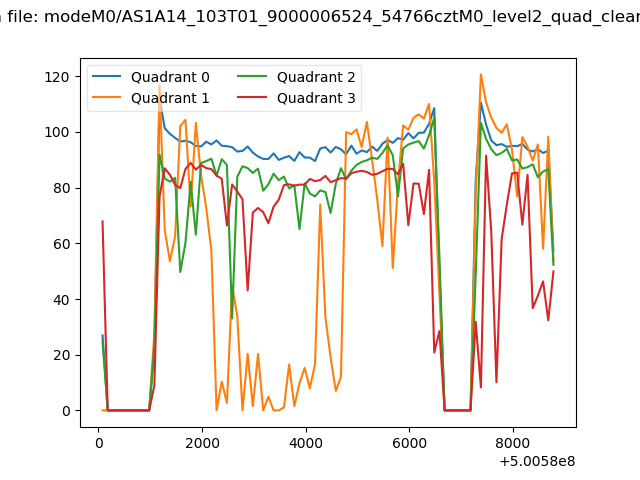 |
|
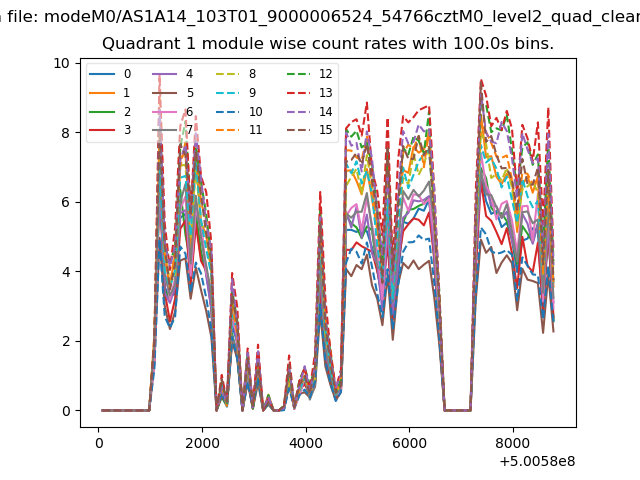
| Module-wise count rates for Quadrant A Data is divided into 100 sec bins |
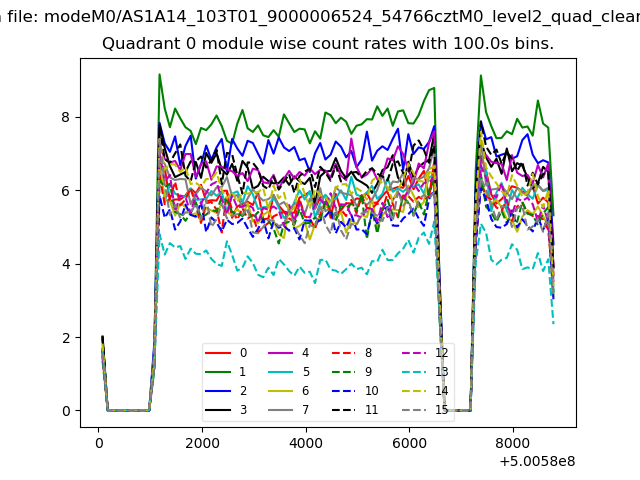 |
 |
| Module-wise count rates for Quadrant B Data is divided into 100 sec bins |
 |
 |
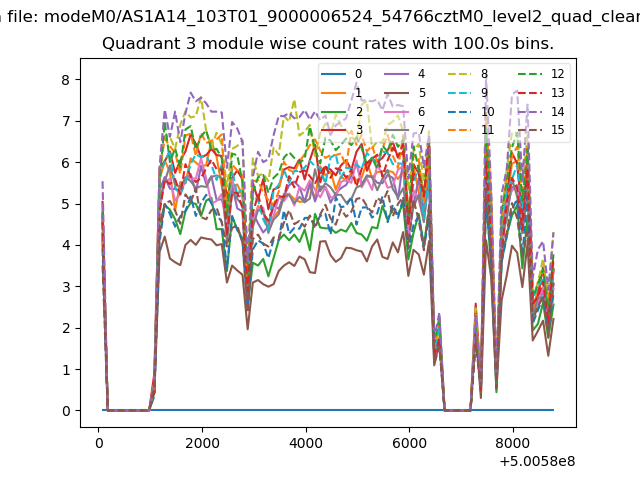
| Module-wise count rates for Quadrant C Data is divided into 100 sec bins |
 |
 |
| Module-wise count rates for Quadrant D Data is divided into 100 sec bins |
 |
 |
| Parameter | Plot |
|---|---|
| CZT HV Monitor | 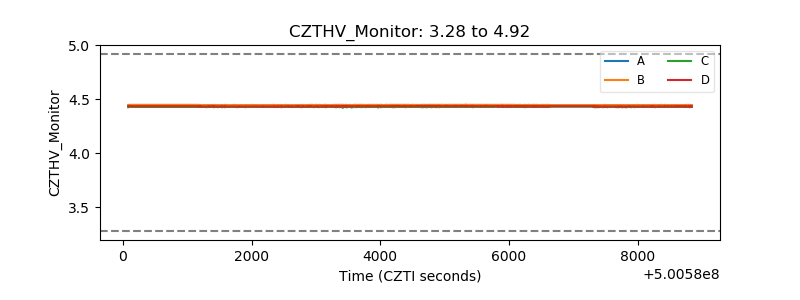 |
| D_VDD | 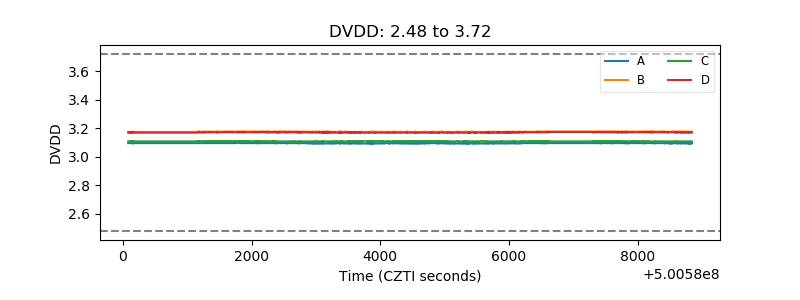 |
| Temperature 1 | 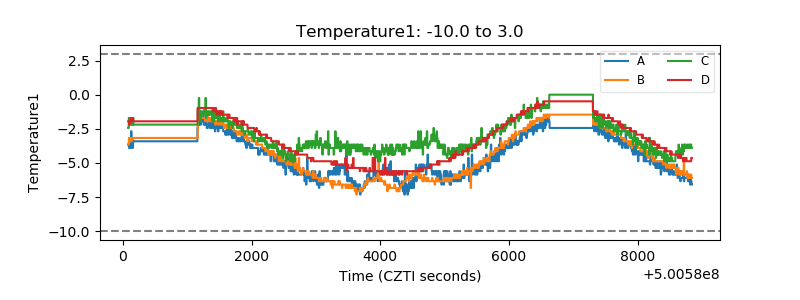 |
| Veto HV Monitor | 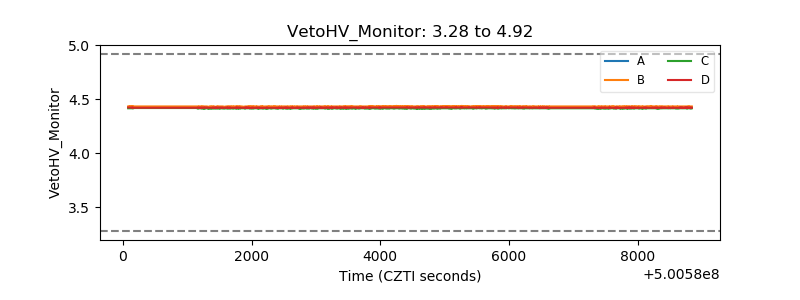 |
| Veto LLD | 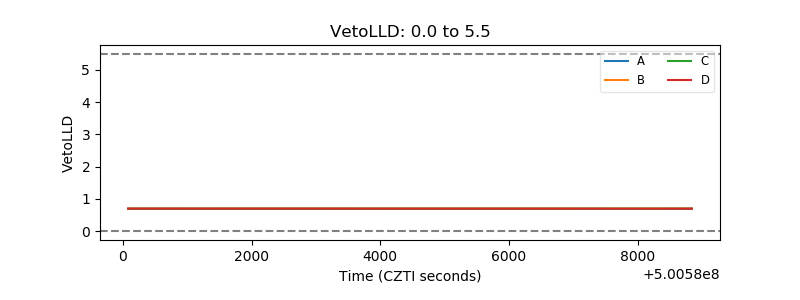 |
| Alpha Counter | 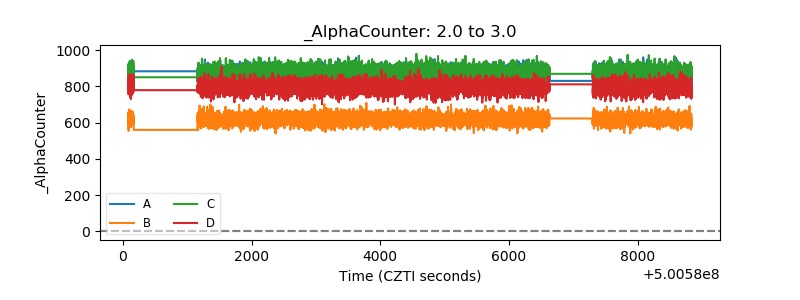 |
| _CPM_Rate | 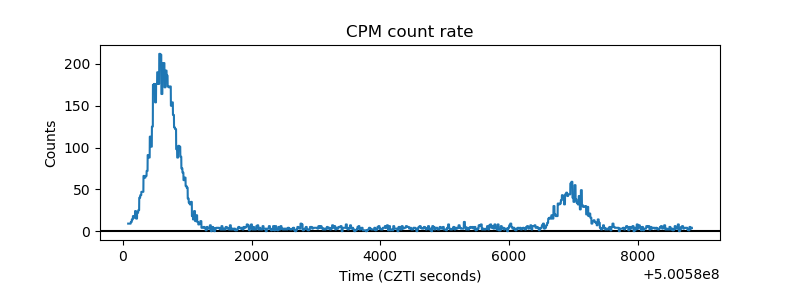 |
| CZT Counter | 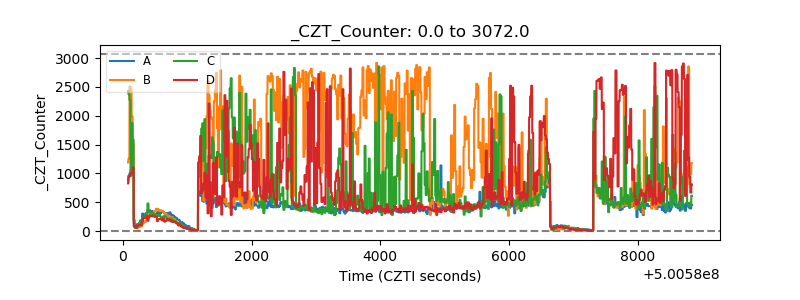 |
| +2.5 Volts monitor |  |
| +5 Volts monitor |  |
| _ROLL_ROT | 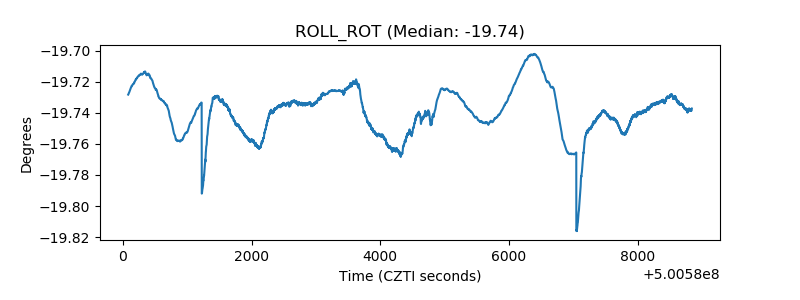 |
| _Roll_DEC | 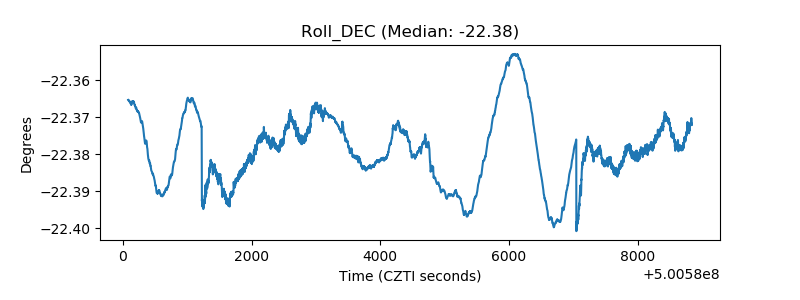 |
| _Roll_RA | 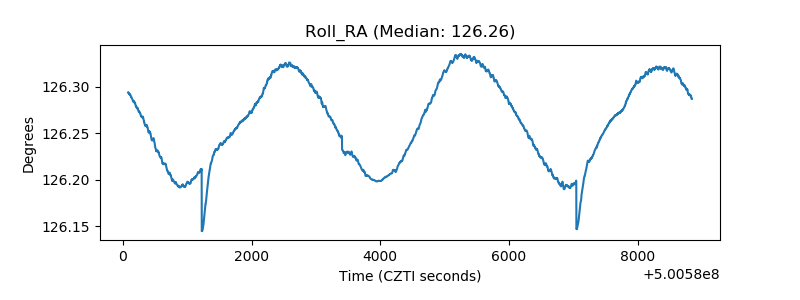 |
| Veto Counter | 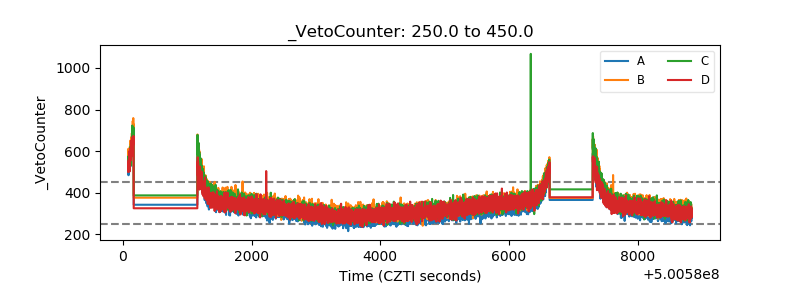 |