| Param | Original file | Final file |
|---|---|---|
| Filename | modeM0/AS1A14_103T01_9000006524_54767cztM0_level2.fits | modeM0/AS1A14_103T01_9000006524_54767cztM0_level2_quad_clean.evt |
| Size (bytes) | 797,806,080 | 100,016,640 |
| Size | 760.8 MB | 95.4 MB |
| Events in quadrant A | 3,496,141 | 732,512 |
| Events in quadrant B | 8,385,636 | 651,440 |
| Events in quadrant C | 8,240,450 | 565,437 |
| Events in quadrant D | 8,808,727 | 538,955 |
| Mode SS | |||
|---|---|---|---|
| Quadrant | BADHDUFLAG | Total packets | Discarded packets |
| A | 0 | 156 | 0 |
| B | 0 | 156 | 0 |
| C | 0 | 156 | 0 |
| D | 0 | 156 | 0 |
| Mode M0 | |||
|---|---|---|---|
| Quadrant | BADHDUFLAG | Total packets | Discarded packets |
| A | 0 | 16346 | 0 |
| B | 0 | 30246 | 0 |
| C | 0 | 29989 | 0 |
| D | 0 | 31664 | 0 |
| Quadrant | Total seconds | Saturated seconds | Saturation percentage |
|---|---|---|---|
| A | 7760 | 35 | 0.451031% |
| B | 7761 | 1568 | 20.203582% |
| C | 7761 | 1651 | 21.273032% |
| D | 7760 | 1591 | 20.502577% |
Noise dominated data is calculated using 1-second bins in cleaned event files. If a bin has >2000 counts, and if more than 50% of those come from <1% of pixels, then it is considered to be noise-dominated and hence unusable.
| Quadrant | # 1 sec bins | Bins with >0 counts | Bins with >2000 counts | High rate bins dominated by noise | Noise dominated (total time) | Noise dominated (detector-on time) | Marked lightcurve |
|---|---|---|---|---|---|---|---|
| A | 7760 | 7760 | 15 | 15 | 0.19% | 0.19% | 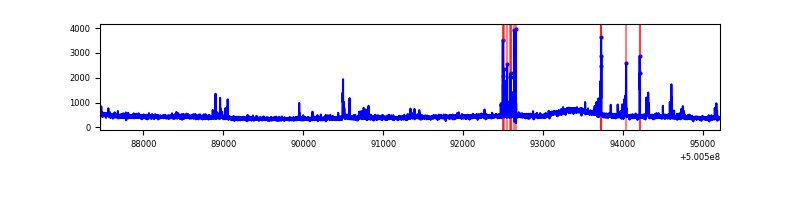 |
| B | 7761 | 7761 | 1356 | 1356 | 17.47% | 17.47% | 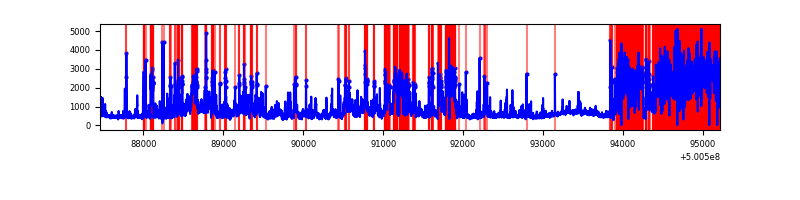 |
| C | 7761 | 7761 | 1285 | 1285 | 16.56% | 16.56% | 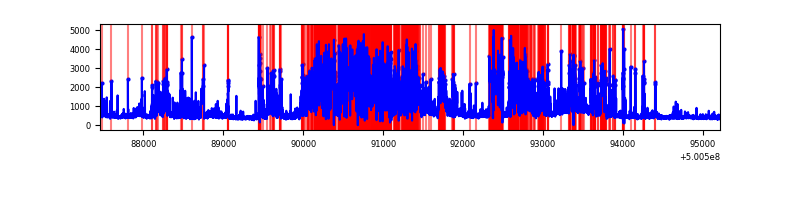 |
| D | 7760 | 7760 | 1374 | 1374 | 17.71% | 17.71% | 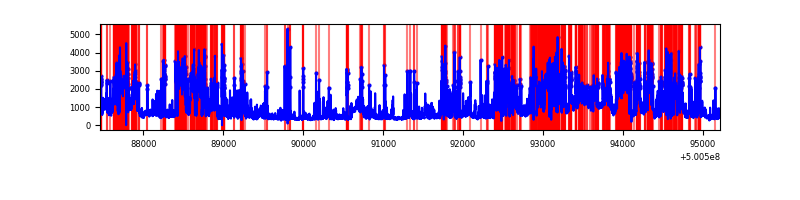 |
Top three noisy pixels from each quadrant. If the there are fewer than three noisy pixels in the level2.evt file, extra rows are filled as -1
| Pixel properties | Quadrant properties | ||||||
|---|---|---|---|---|---|---|---|
| Quadrant | DetID | PixID | Counts | Sigma | Mean | Median | Sigma |
| A | 4 | 206 | 61441 | 296.87 | 828 | 806 | 204.3 |
| A | 5 | 240 | 53142 | 256.23 | 828 | 806 | 204.3 |
| A | 5 | 243 | 46554 | 223.98 | 828 | 806 | 204.3 |
| B | 2 | 249 | 4950710 | 30888.65 | 749 | 723 | 160.3 |
| B | 1 | 207 | 154783 | 961.36 | 749 | 723 | 160.3 |
| B | 0 | 213 | 100775 | 624.34 | 749 | 723 | 160.3 |
| C | 4 | 5 | 3109044 | 15961.24 | 710 | 702 | 194.7 |
| C | 12 | 249 | 761163 | 3904.94 | 710 | 702 | 194.7 |
| C | 15 | 209 | 584704 | 2998.83 | 710 | 702 | 194.7 |
| D | 3 | 12 | 4852272 | 23958.4 | 709 | 676 | 202.5 |
| D | 11 | 129 | 545921 | 2692.56 | 709 | 676 | 202.5 |
| D | 2 | 252 | 170220 | 837.25 | 709 | 676 | 202.5 |
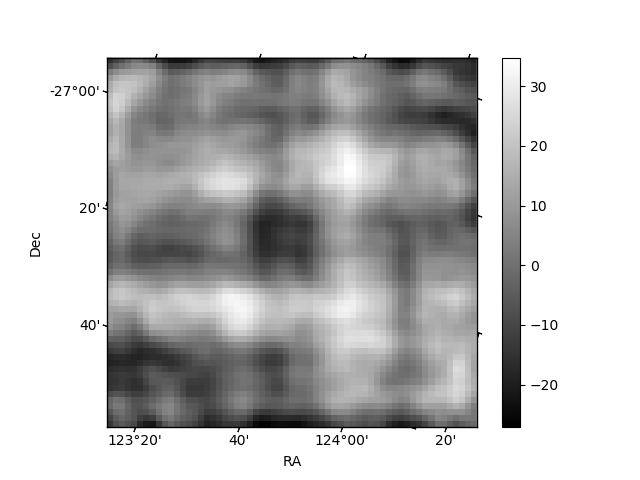
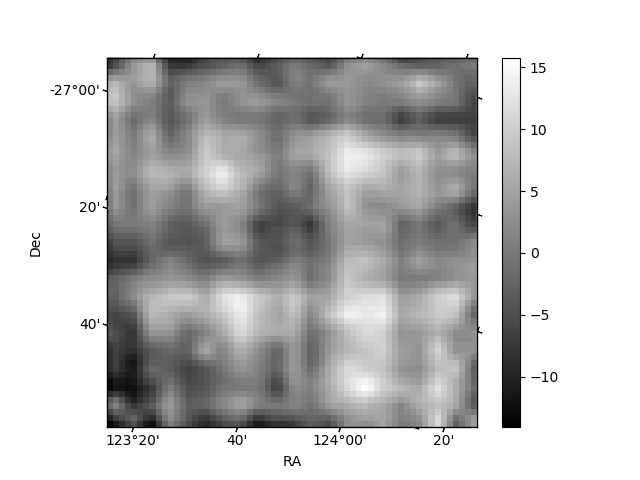
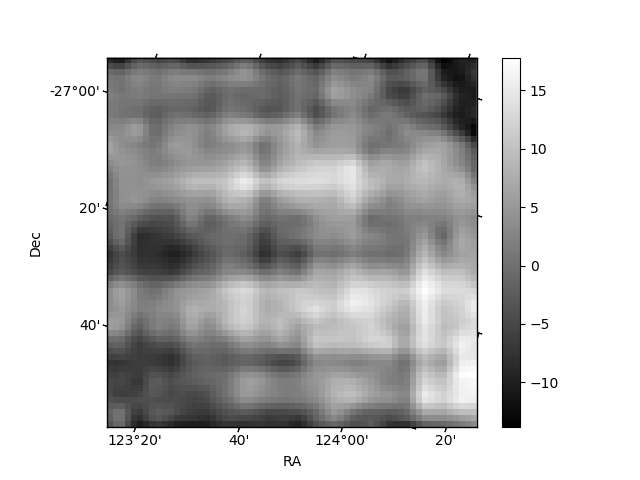
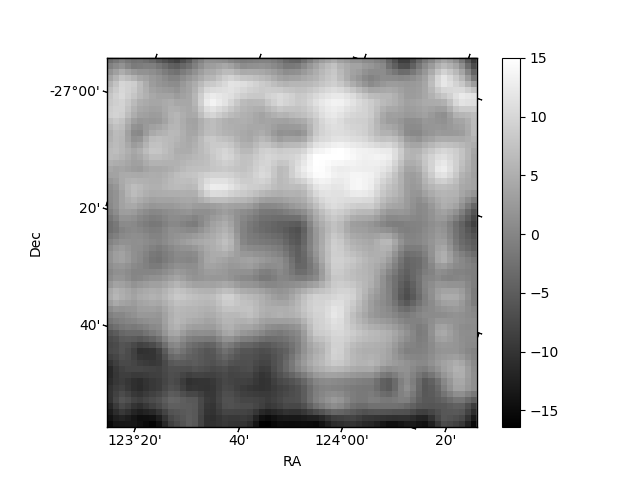
Histogram calculated using DETX and DETY for each event in the final _common_clean file
| Quadrant A | 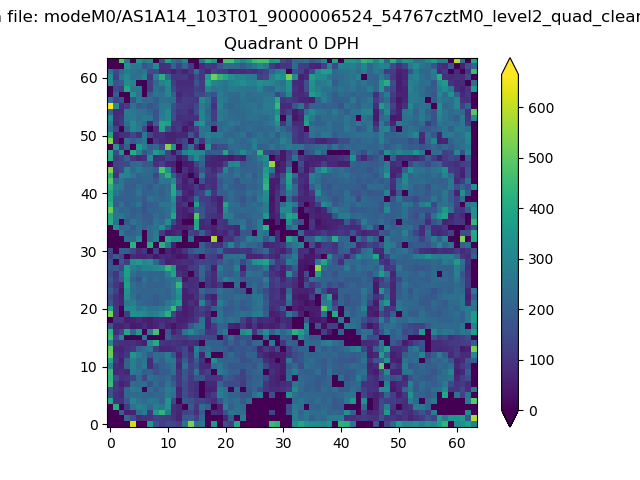 |
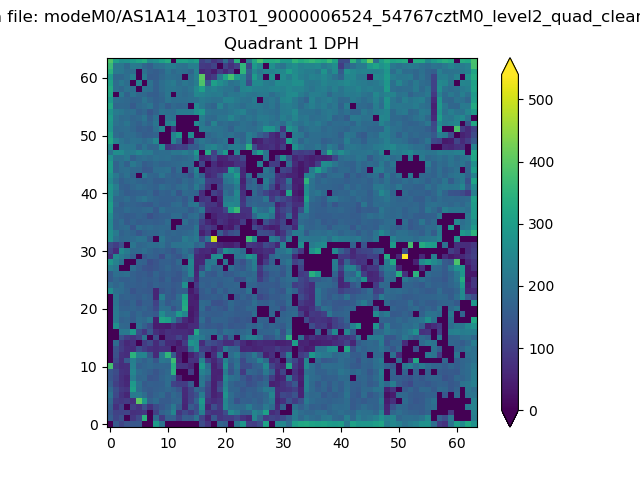 |
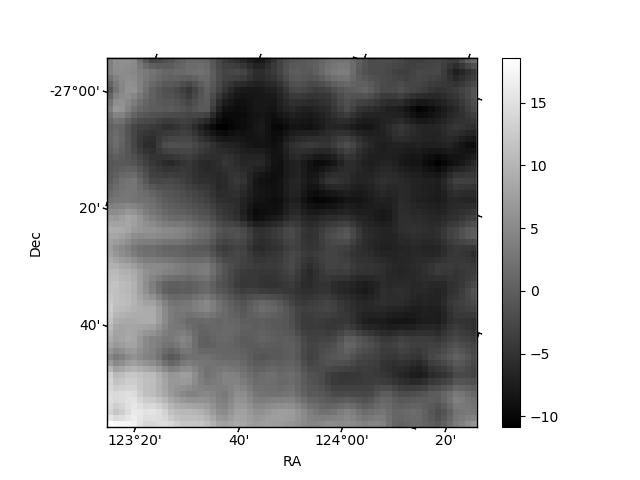
Quadrant B |
|---|---|---|---|
| Quadrant D | 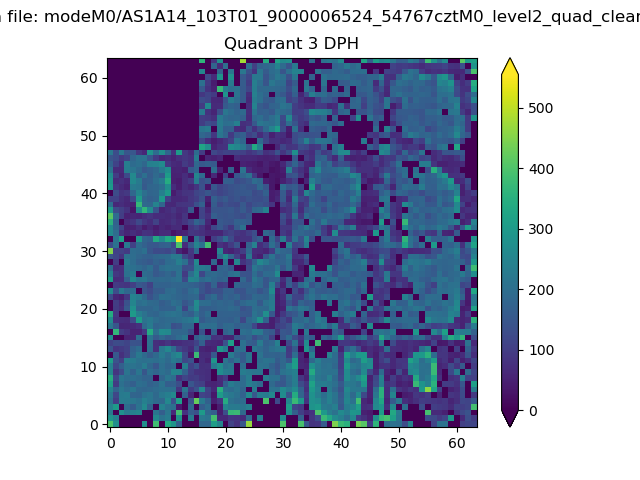 |
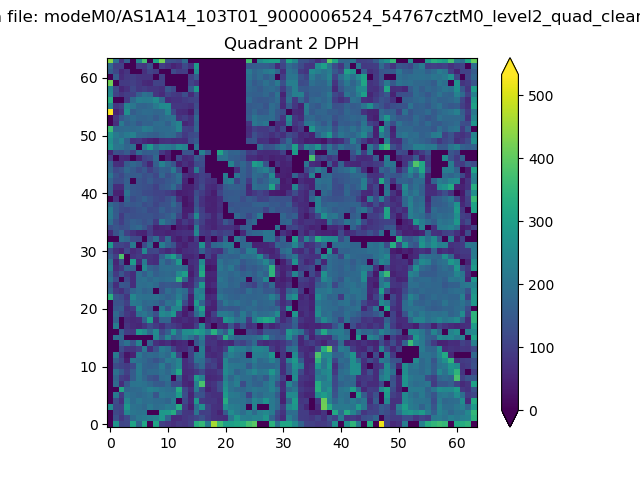 |
Quadrant C |
| Plot type | Count rate plots | Images |
|---|---|---|
| Comparison with Poisson distribution Blue bars denote a histogram of data divided into 1 sec bins. Red curve is a Poisson curve with rate = median count rate of data. |
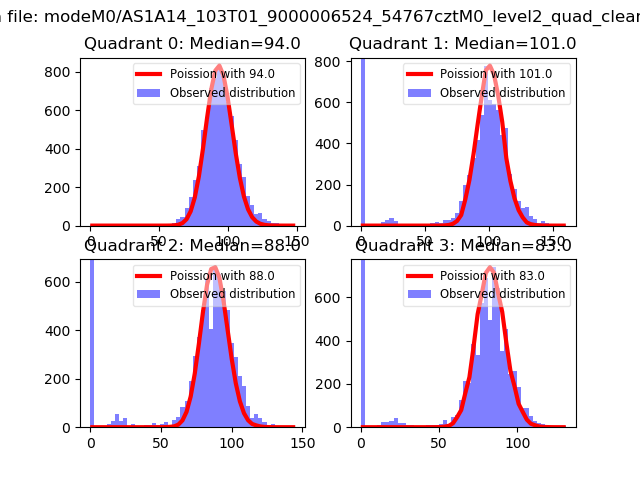 |
 |
| Quadrant-wise count rates Data is divided into 100 sec bins |
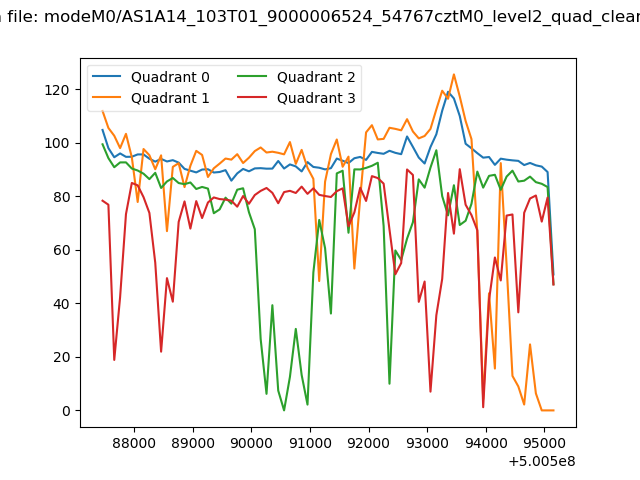 |
|
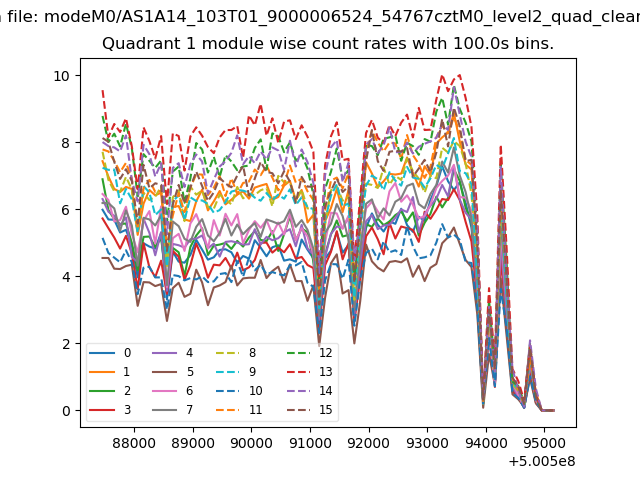
| Module-wise count rates for Quadrant A Data is divided into 100 sec bins |
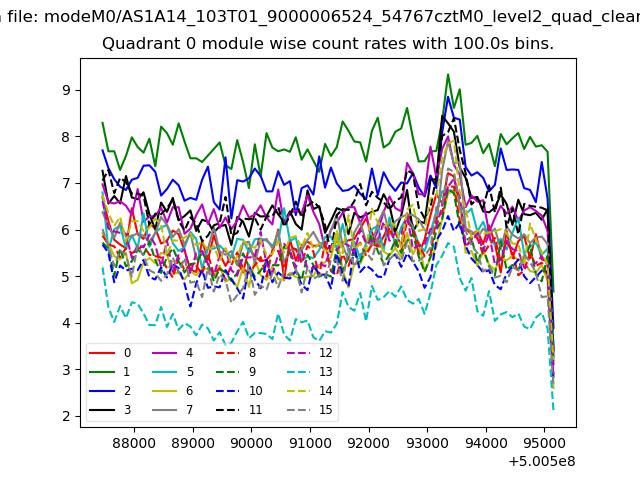 |
 |
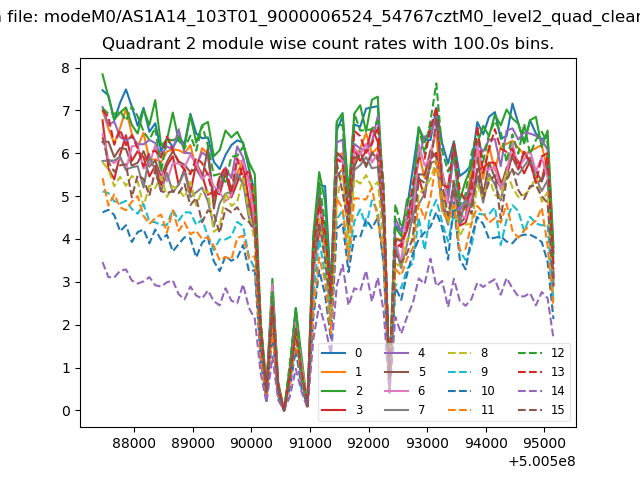
| Module-wise count rates for Quadrant B Data is divided into 100 sec bins |
 |
 |
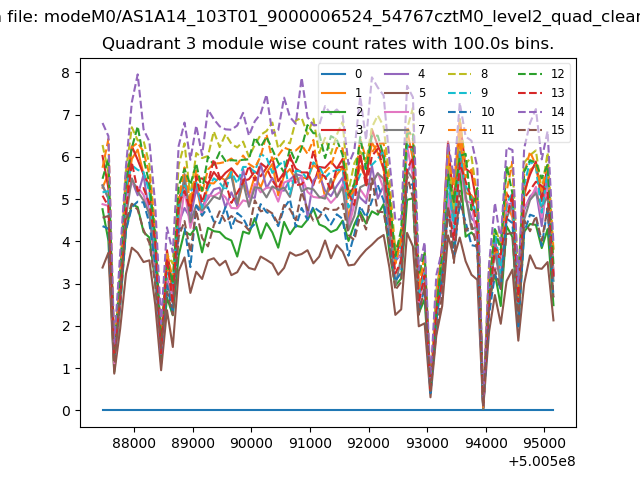
| Module-wise count rates for Quadrant C Data is divided into 100 sec bins |
 |
 |
| Module-wise count rates for Quadrant D Data is divided into 100 sec bins |
 |
 |
| Parameter | Plot |
|---|---|
| CZT HV Monitor | 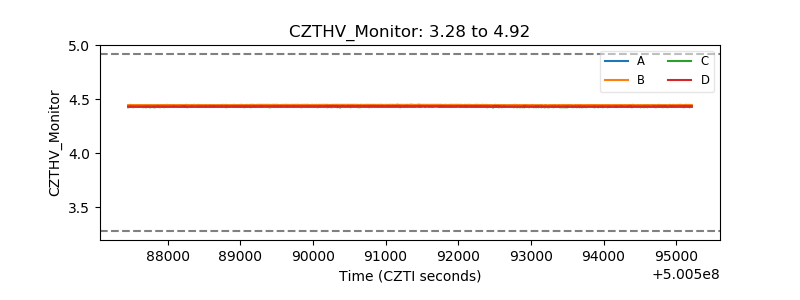 |
| D_VDD | 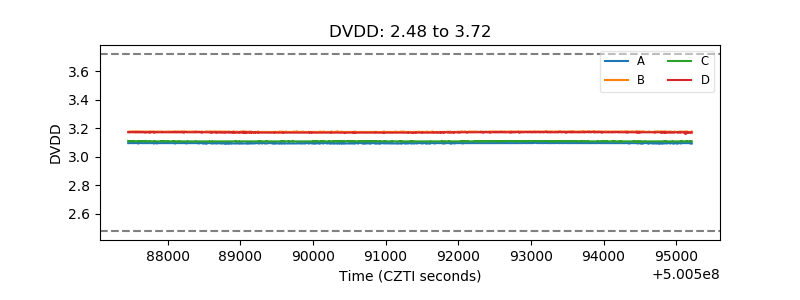 |
| Temperature 1 | 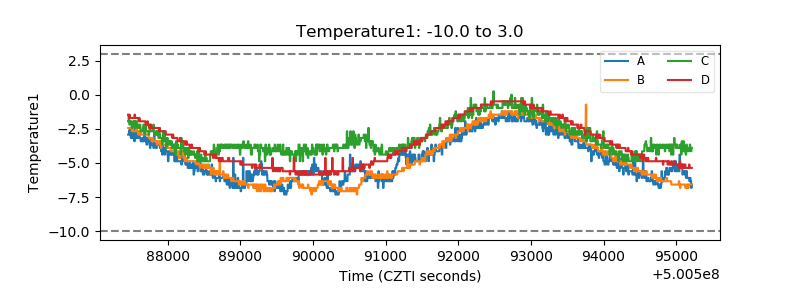 |
| Veto HV Monitor | 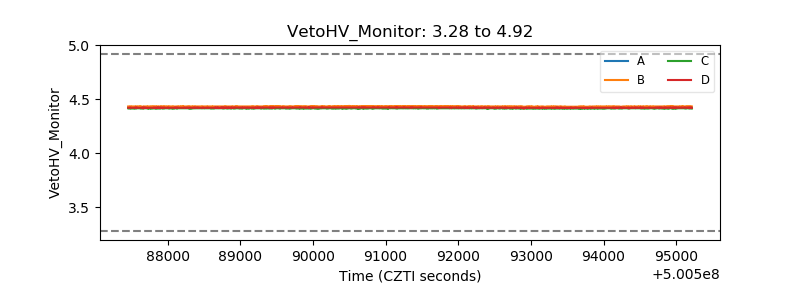 |
| Veto LLD | 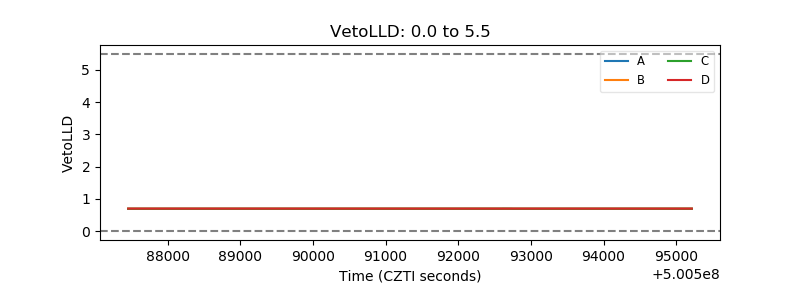 |
| Alpha Counter | 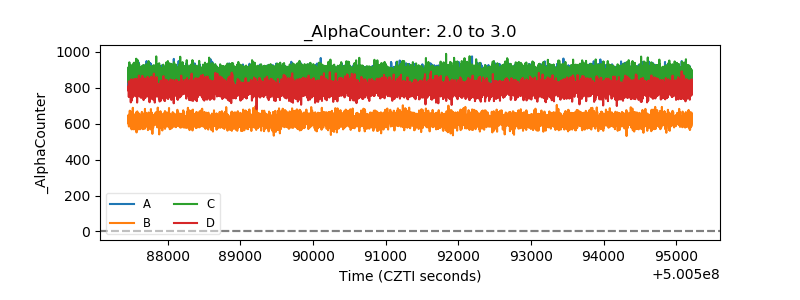 |
| _CPM_Rate | 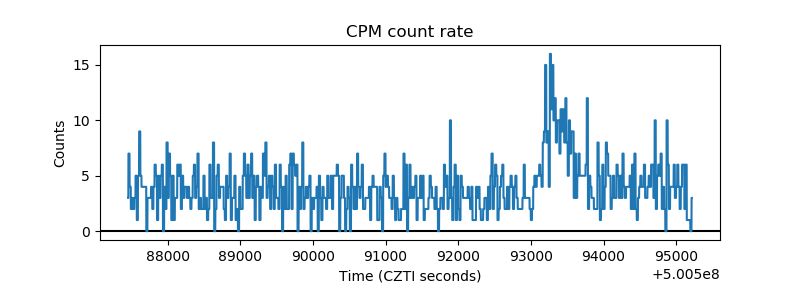 |
| CZT Counter | 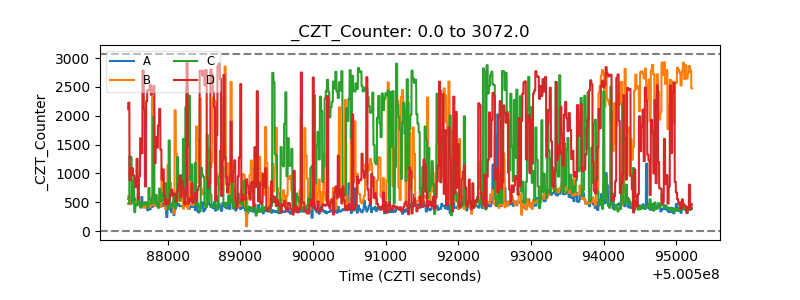 |
| +2.5 Volts monitor |  |
| +5 Volts monitor | 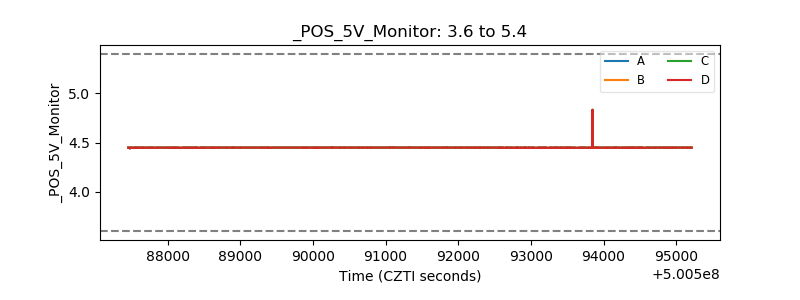 |
| _ROLL_ROT | 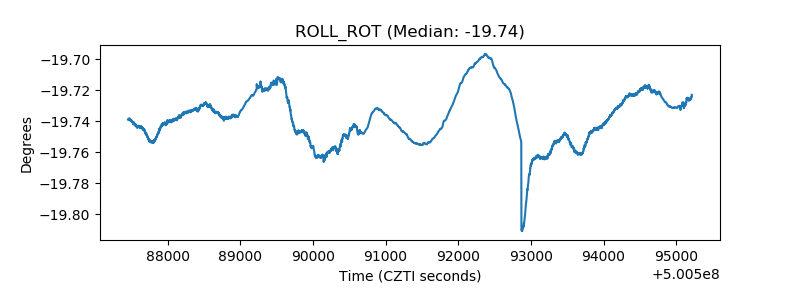 |
| _Roll_DEC | 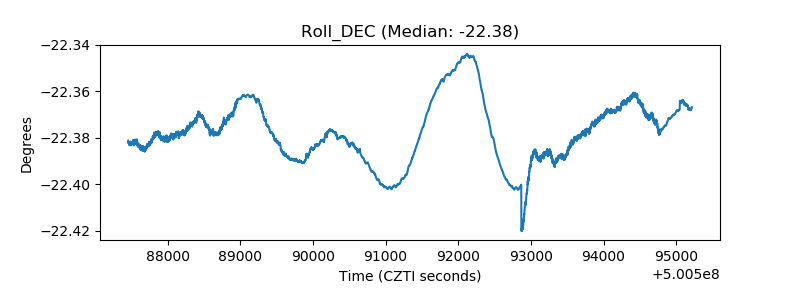 |
| _Roll_RA | 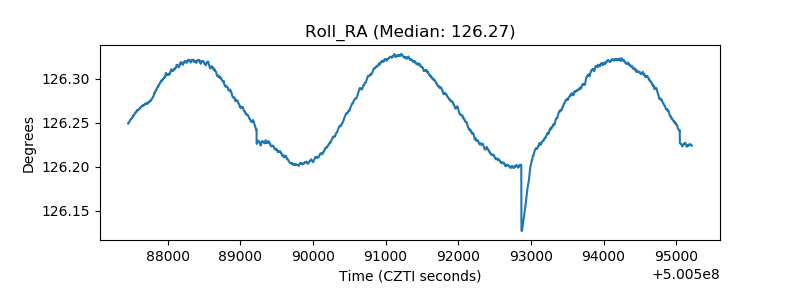 |
| Veto Counter | 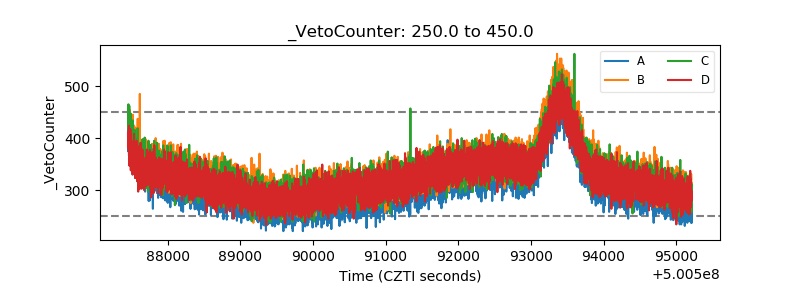 |