| Param | Original file | Final file |
|---|---|---|
| Filename | modeM0/AS1A14_103T01_9000006524_54768cztM0_level2.fits | modeM0/AS1A14_103T01_9000006524_54768cztM0_level2_quad_clean.evt |
| Size (bytes) | 863,556,480 | 101,632,320 |
| Size | 823.6 MB | 96.9 MB |
| Events in quadrant A | 3,690,120 | 772,510 |
| Events in quadrant B | 13,836,826 | 458,908 |
| Events in quadrant C | 5,316,324 | 707,133 |
| Events in quadrant D | 8,485,354 | 567,278 |
| Mode SS | |||
|---|---|---|---|
| Quadrant | BADHDUFLAG | Total packets | Discarded packets |
| A | 0 | 164 | 0 |
| B | 0 | 164 | 0 |
| C | 0 | 164 | 0 |
| D | 0 | 164 | 0 |
| Mode M0 | |||
|---|---|---|---|
| Quadrant | BADHDUFLAG | Total packets | Discarded packets |
| A | 0 | 17328 | 0 |
| B | 0 | 46682 | 0 |
| C | 0 | 21730 | 1 |
| D | 0 | 31315 | 0 |
| Quadrant | Total seconds | Saturated seconds | Saturation percentage |
|---|---|---|---|
| A | 8220 | 29 | 0.352798% |
| B | 8221 | 4095 | 49.811458% |
| C | 8220 | 413 | 5.024331% |
| D | 8220 | 1614 | 19.635036% |
Noise dominated data is calculated using 1-second bins in cleaned event files. If a bin has >2000 counts, and if more than 50% of those come from <1% of pixels, then it is considered to be noise-dominated and hence unusable.
| Quadrant | # 1 sec bins | Bins with >0 counts | Bins with >2000 counts | High rate bins dominated by noise | Noise dominated (total time) | Noise dominated (detector-on time) | Marked lightcurve |
|---|---|---|---|---|---|---|---|
| A | 8220 | 8220 | 11 | 11 | 0.13% | 0.13% | 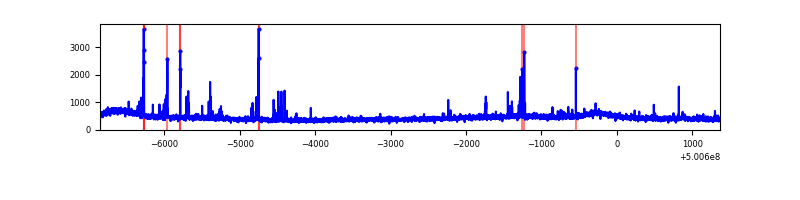 |
| B | 8221 | 8221 | 3664 | 3664 | 44.57% | 44.57% | 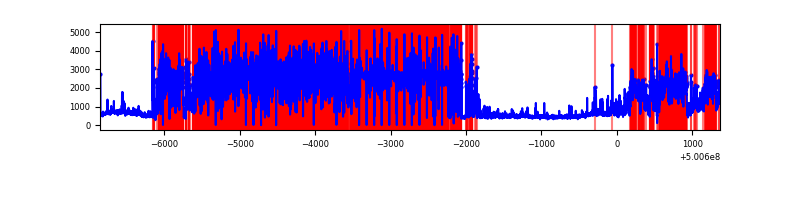 |
| C | 8220 | 8220 | 279 | 279 | 3.39% | 3.39% | 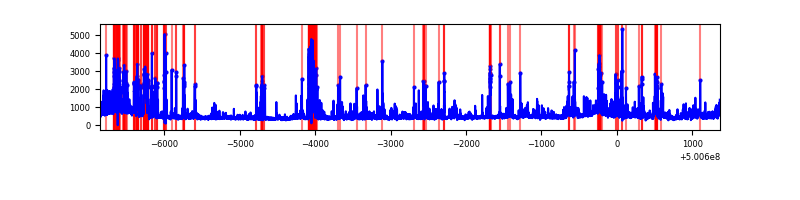 |
| D | 8220 | 8220 | 1333 | 1333 | 16.22% | 16.22% | 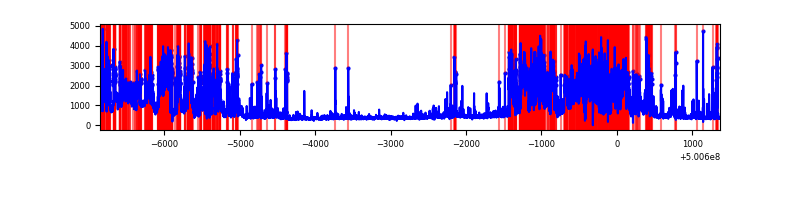 |
Top three noisy pixels from each quadrant. If the there are fewer than three noisy pixels in the level2.evt file, extra rows are filled as -1
| Pixel properties | Quadrant properties | ||||||
|---|---|---|---|---|---|---|---|
| Quadrant | DetID | PixID | Counts | Sigma | Mean | Median | Sigma |
| A | 4 | 3 | 50855 | 228.01 | 884 | 860 | 219.3 |
| A | 5 | 243 | 49469 | 221.69 | 884 | 860 | 219.3 |
| A | 3 | 14 | 44386 | 198.51 | 884 | 860 | 219.3 |
| B | 2 | 249 | 11058627 | 81359.19 | 632 | 609 | 135.9 |
| B | 1 | 207 | 58943 | 429.19 | 632 | 609 | 135.9 |
| B | 5 | 185 | 50784 | 369.16 | 632 | 609 | 135.9 |
| C | 9 | 38 | 437795 | 1896.42 | 842 | 833 | 230.4 |
| C | 12 | 249 | 343375 | 1486.63 | 842 | 833 | 230.4 |
| C | 14 | 254 | 331624 | 1435.63 | 842 | 833 | 230.4 |
| D | 3 | 12 | 4693033 | 21168.8 | 774 | 738 | 221.7 |
| D | 11 | 129 | 462508 | 2083.23 | 774 | 738 | 221.7 |
| D | 5 | 173 | 78131 | 349.15 | 774 | 738 | 221.7 |
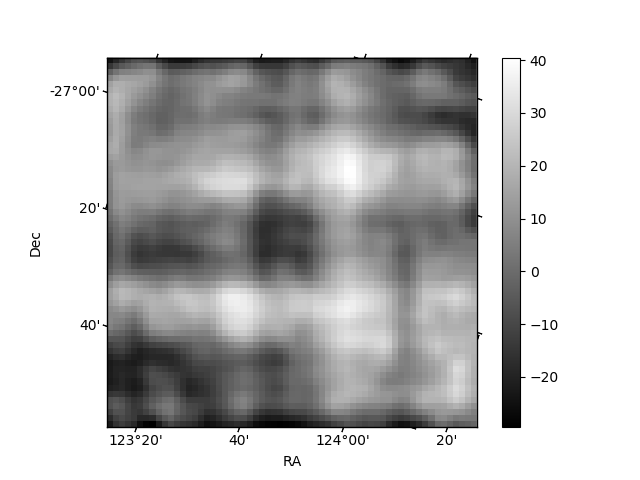
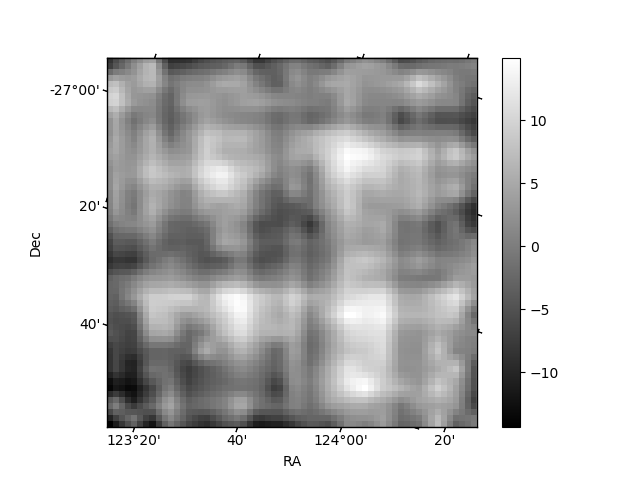
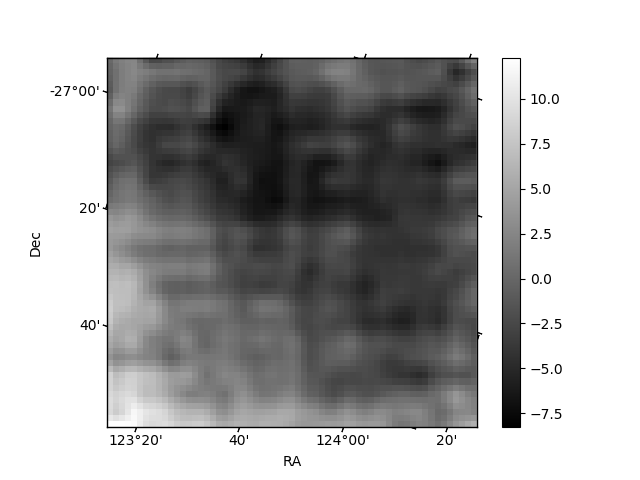
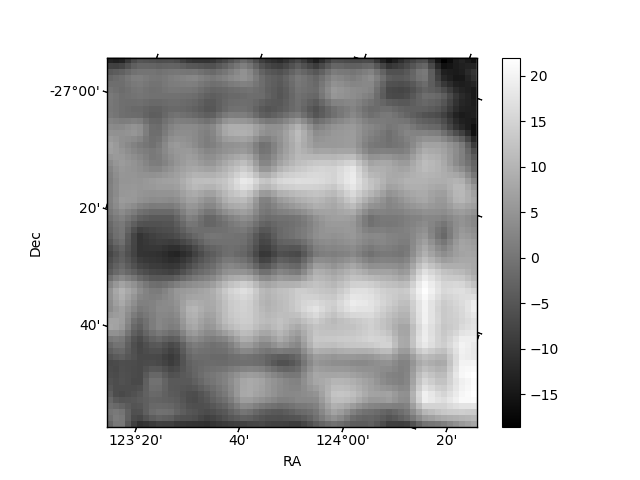
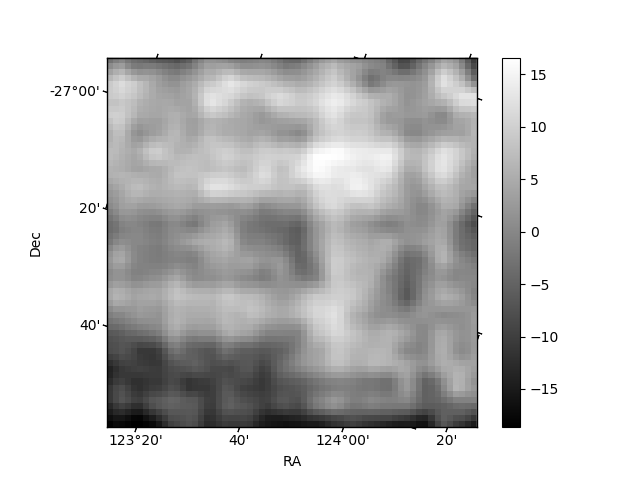
Histogram calculated using DETX and DETY for each event in the final _common_clean file
| Quadrant A | 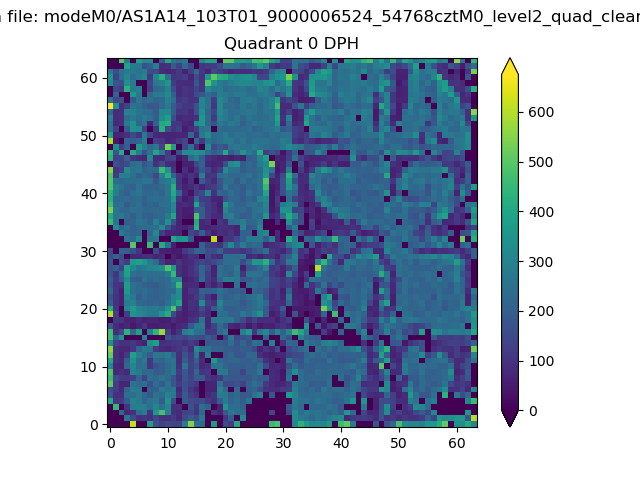 |
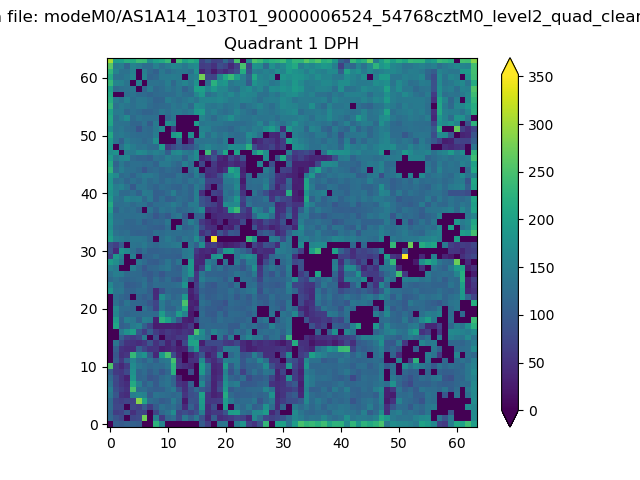 |
Quadrant B |
|---|---|---|---|
| Quadrant D | 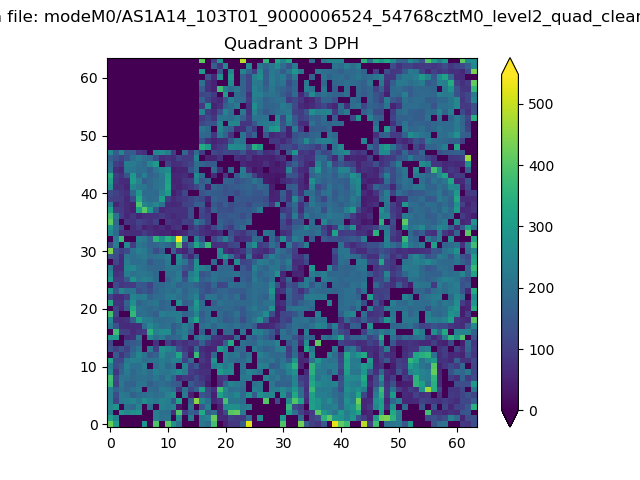 |
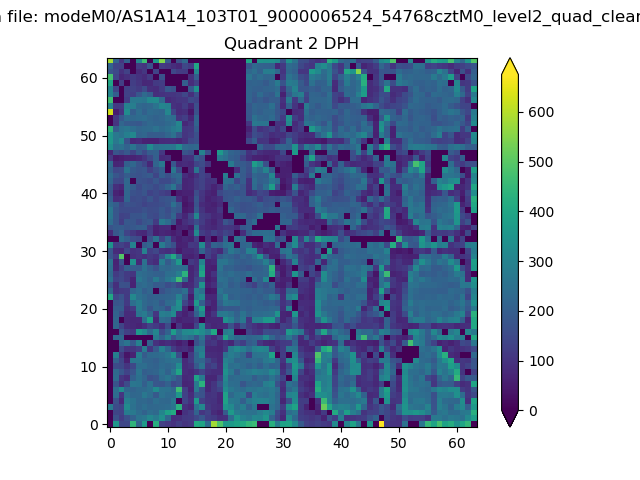 |
Quadrant C |
| Plot type | Count rate plots | Images |
|---|---|---|
| Comparison with Poisson distribution Blue bars denote a histogram of data divided into 1 sec bins. Red curve is a Poisson curve with rate = median count rate of data. |
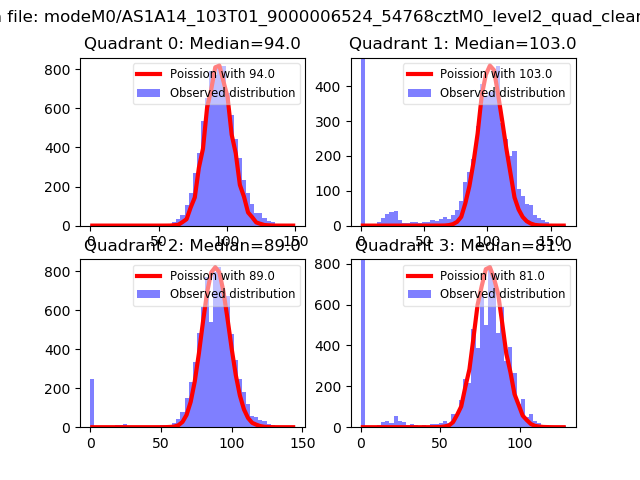 |
 |
| Quadrant-wise count rates Data is divided into 100 sec bins |
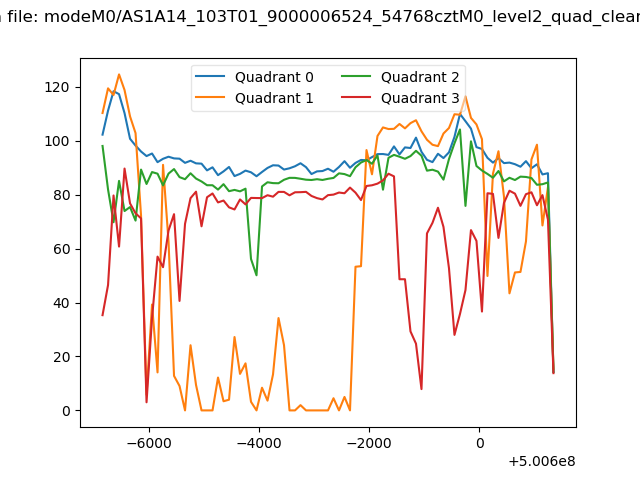 |
|
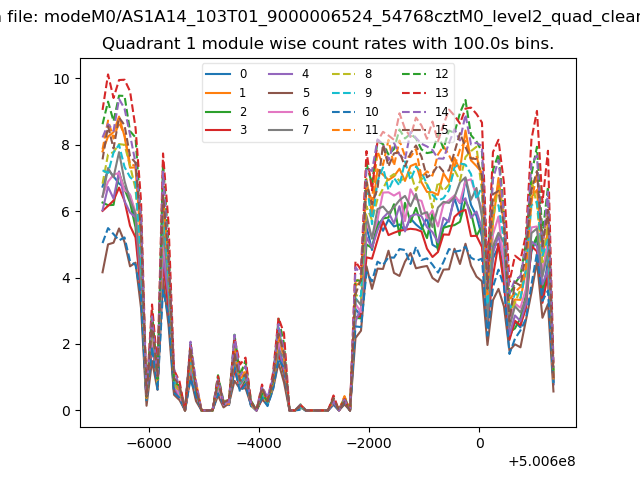
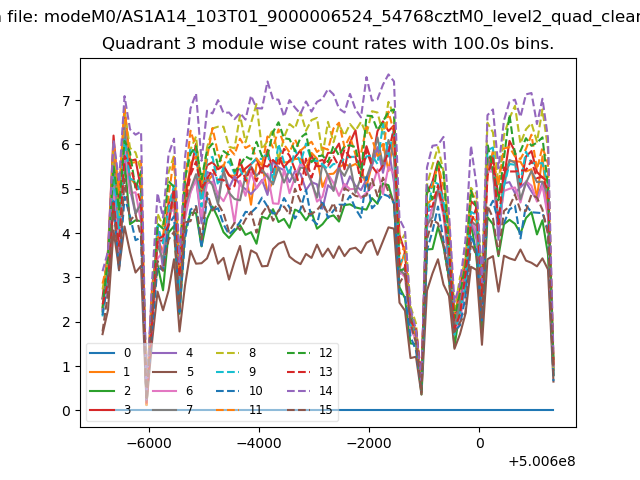
| Module-wise count rates for Quadrant A Data is divided into 100 sec bins |
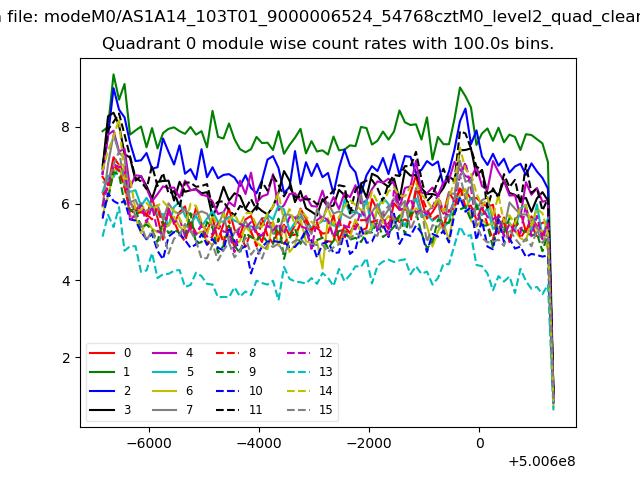 |
 |
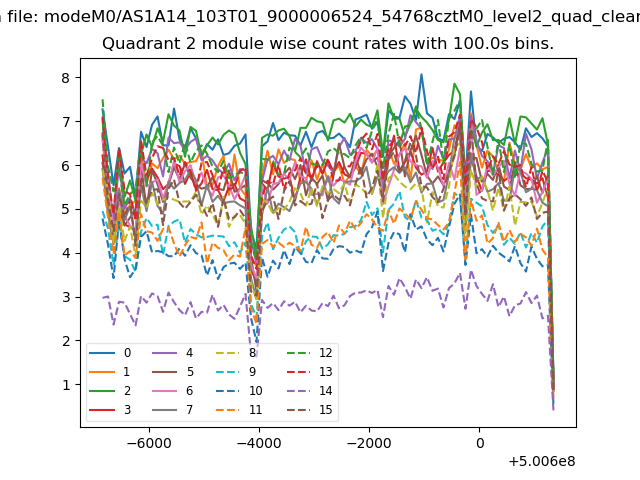
| Module-wise count rates for Quadrant B Data is divided into 100 sec bins |
 |
 |
| Module-wise count rates for Quadrant C Data is divided into 100 sec bins |
 |
 |
| Module-wise count rates for Quadrant D Data is divided into 100 sec bins |
 |
 |
| Parameter | Plot |
|---|---|
| CZT HV Monitor | 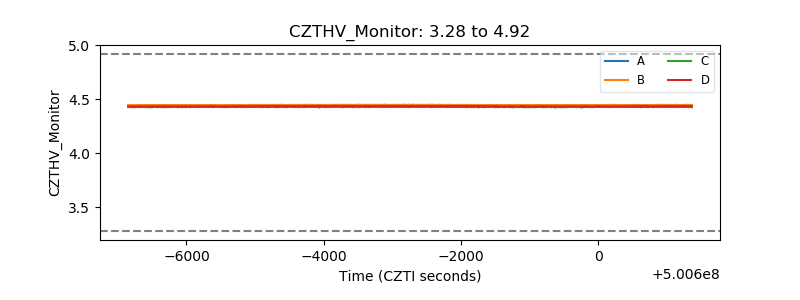 |
| D_VDD | 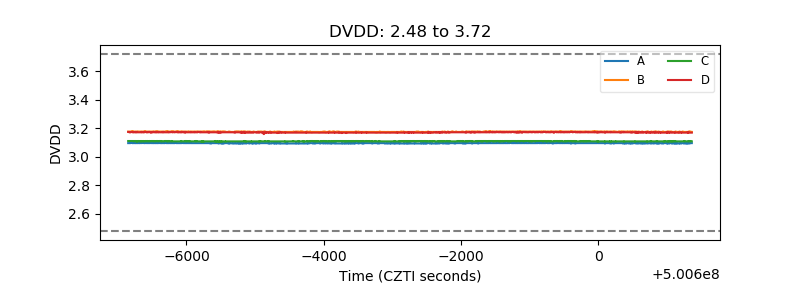 |
| Temperature 1 | 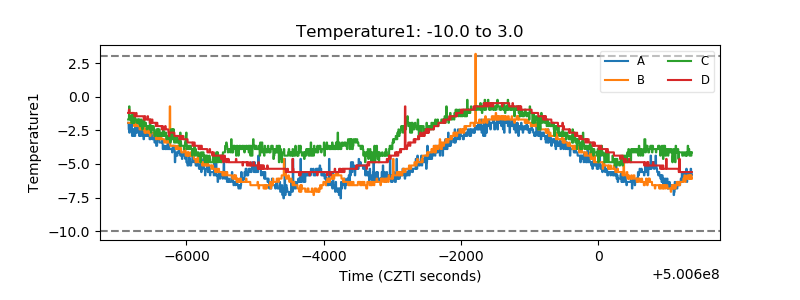 |
| Veto HV Monitor |  |
| Veto LLD | 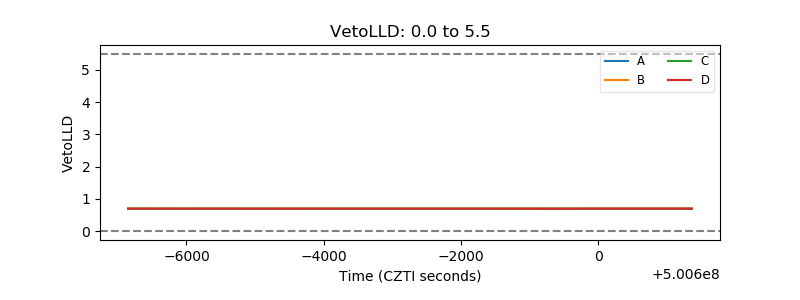 |
| Alpha Counter | 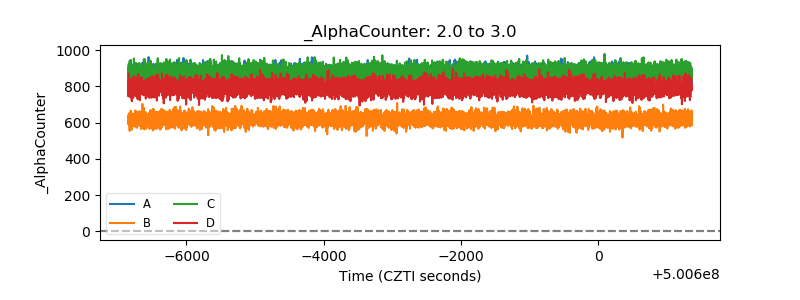 |
| _CPM_Rate | 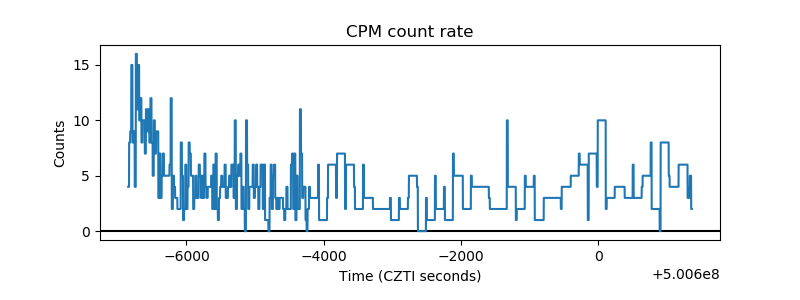 |
| CZT Counter | 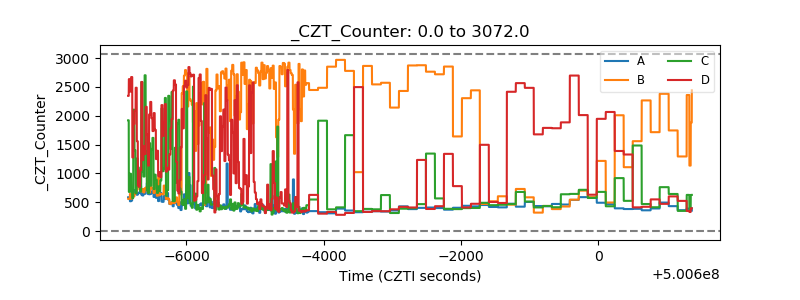 |
| +2.5 Volts monitor | 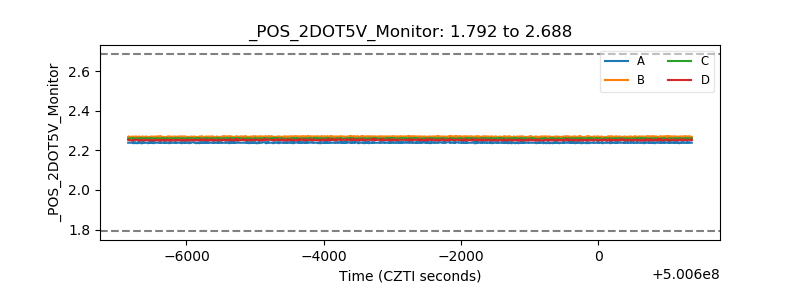 |
| +5 Volts monitor |  |
| _ROLL_ROT | 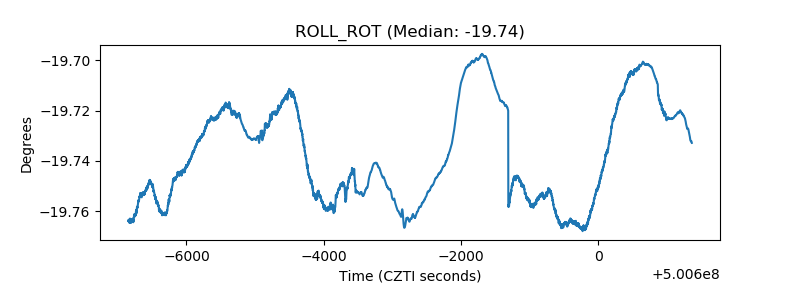 |
| _Roll_DEC | 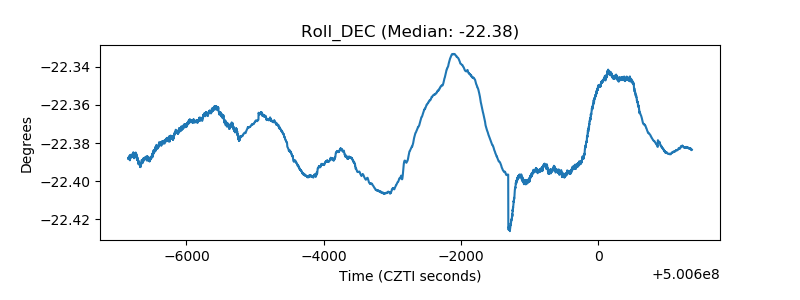 |
| _Roll_RA | 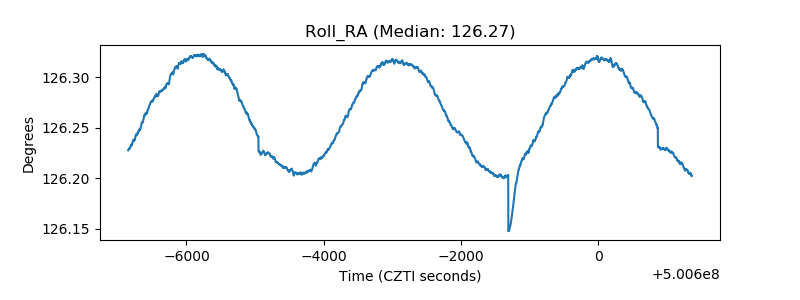 |
| Veto Counter | 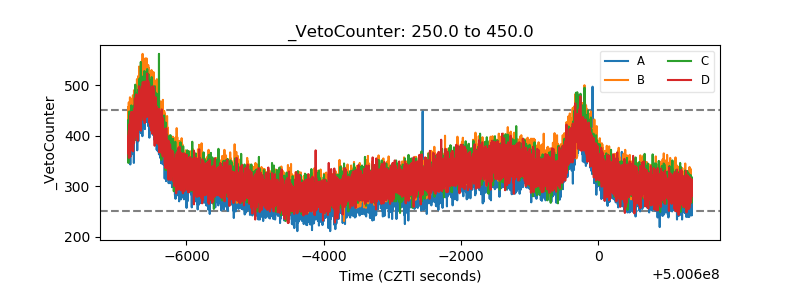 |