| Param | Original file | Final file |
|---|---|---|
| Filename | modeM0/AS1A14_103T01_9000006524_54776cztM0_level2.fits | modeM0/AS1A14_103T01_9000006524_54776cztM0_level2_quad_clean.evt |
| Size (bytes) | 1,948,916,160 | 291,732,480 |
| Size | 1.8 GB | 278.2 MB |
| Events in quadrant A | 10,699,930 | 2,265,481 |
| Events in quadrant B | 30,148,569 | 1,296,235 |
| Events in quadrant C | 16,178,740 | 2,012,384 |
| Events in quadrant D | 13,663,969 | 1,963,453 |
| Mode SS | |||
|---|---|---|---|
| Quadrant | BADHDUFLAG | Total packets | Discarded packets |
| A | 0 | 446 | 60 |
| B | 0 | 445 | 53 |
| C | 0 | 446 | 50 |
| D | 0 | 443 | 43 |
| Mode M0 | |||
|---|---|---|---|
| Quadrant | BADHDUFLAG | Total packets | Discarded packets |
| A | 0 | 52743 | 6020 |
| B | 0 | 131697 | 29910 |
| C | 0 | 68945 | 7006 |
| D | 0 | 63004 | 8651 |
| Mode M9 | |||
|---|---|---|---|
| Quadrant | BADHDUFLAG | Total packets | Discarded packets |
| A | 0 | 25 | 1 |
| B | 0 | 25 | 3 |
| C | 0 | 25 | 1 |
| D | 0 | 25 | 4 |
| Quadrant | Total seconds | Saturated seconds | Saturation percentage |
|---|---|---|---|
| A | 19196 | 980 | 5.105230% |
| B | 17851 | 8866 | 49.666685% |
| C | 19119 | 2184 | 11.423192% |
| D | 18936 | 1419 | 7.493663% |
Noise dominated data is calculated using 1-second bins in cleaned event files. If a bin has >2000 counts, and if more than 50% of those come from <1% of pixels, then it is considered to be noise-dominated and hence unusable.
| Quadrant | # 1 sec bins | Bins with >0 counts | Bins with >2000 counts | High rate bins dominated by noise | Noise dominated (total time) | Noise dominated (detector-on time) | Marked lightcurve |
|---|---|---|---|---|---|---|---|
| A | 30079 | 20006 | 727 | 727 | 2.42% | 3.63% | 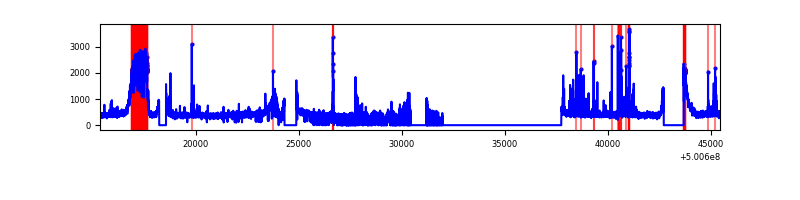 |
| B | 30079 | 18339 | 7414 | 7414 | 24.65% | 40.43% | 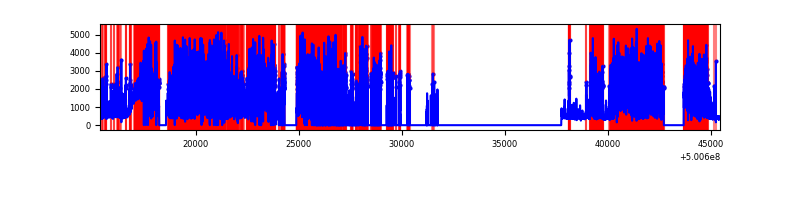 |
| C | 30079 | 19952 | 1837 | 1837 | 6.11% | 9.21% | 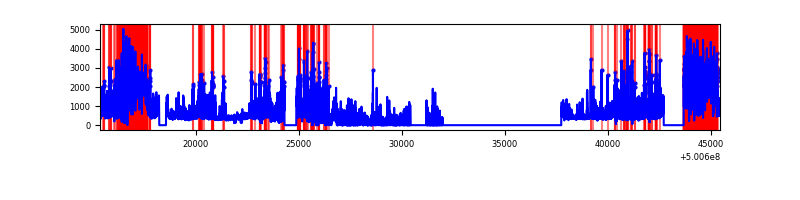 |
| D | 30079 | 19785 | 1210 | 1210 | 4.02% | 6.12% | 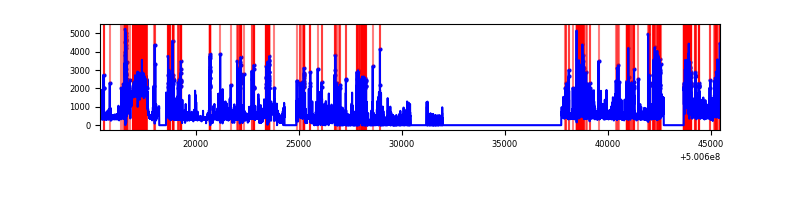 |
Top three noisy pixels from each quadrant. If the there are fewer than three noisy pixels in the level2.evt file, extra rows are filled as -1
| Pixel properties | Quadrant properties | ||||||
|---|---|---|---|---|---|---|---|
| Quadrant | DetID | PixID | Counts | Sigma | Mean | Median | Sigma |
| A | 13 | 248 | 238464 | 287.84 | 2608 | 2540 | 819.6 |
| A | 0 | 8 | 128244 | 153.37 | 2608 | 2540 | 819.6 |
| A | 4 | 3 | 41337 | 47.33 | 2608 | 2540 | 819.6 |
| B | 2 | 249 | 22384839 | 53235.42 | 1715 | 1679 | 420.5 |
| B | 5 | 185 | 609381 | 1445.34 | 1715 | 1679 | 420.5 |
| B | 1 | 207 | 168990 | 397.93 | 1715 | 1679 | 420.5 |
| C | 9 | 38 | 3942118 | 5995.37 | 2157 | 2138 | 657.2 |
| C | 1 | 3 | 1082676 | 1644.23 | 2157 | 2138 | 657.2 |
| C | 14 | 254 | 937055 | 1422.64 | 2157 | 2138 | 657.2 |
| D | 14 | 52 | 834506 | 1014.52 | 2445 | 2314 | 820.3 |
| D | 3 | 12 | 599902 | 728.51 | 2445 | 2314 | 820.3 |
| D | 11 | 129 | 591094 | 717.78 | 2445 | 2314 | 820.3 |
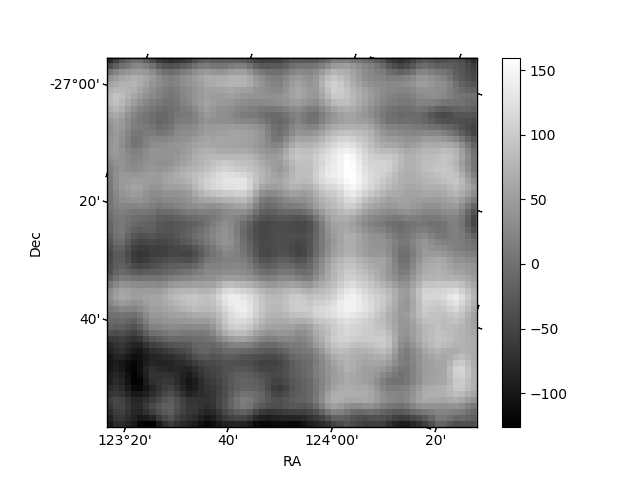
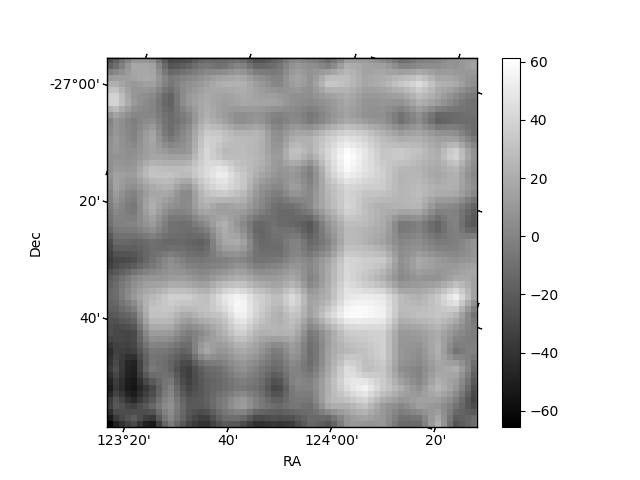
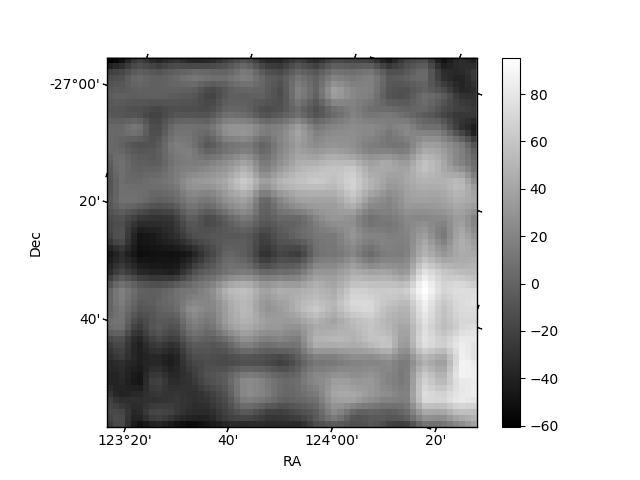
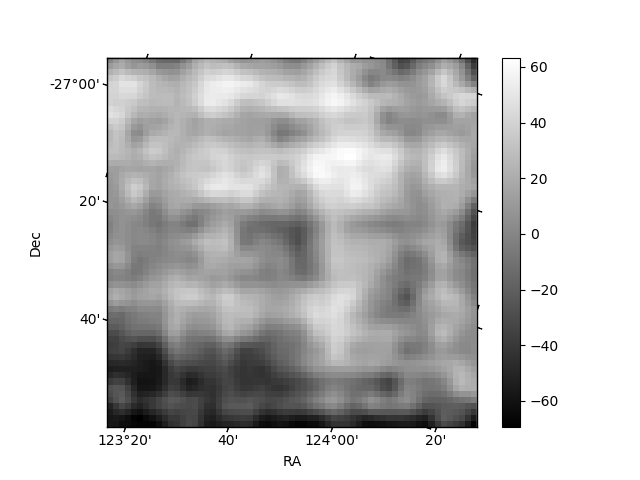
Histogram calculated using DETX and DETY for each event in the final _common_clean file
| Quadrant A | 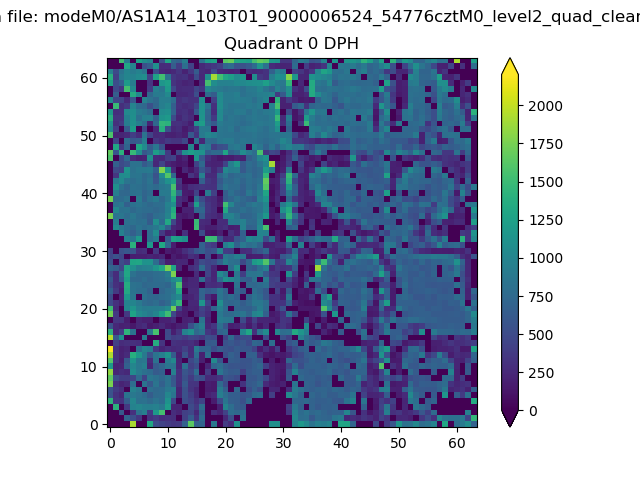 |
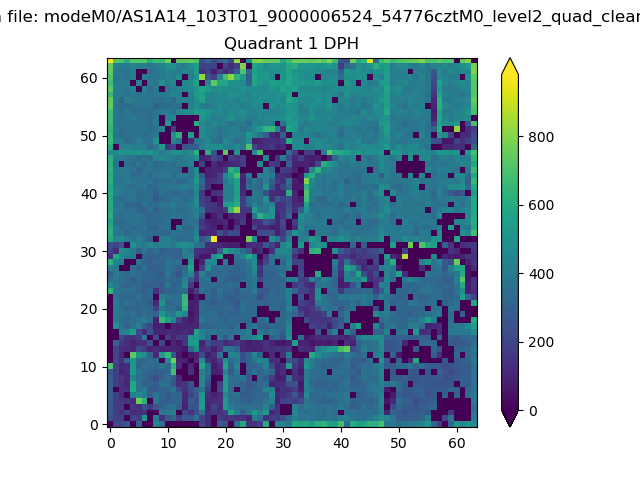 |
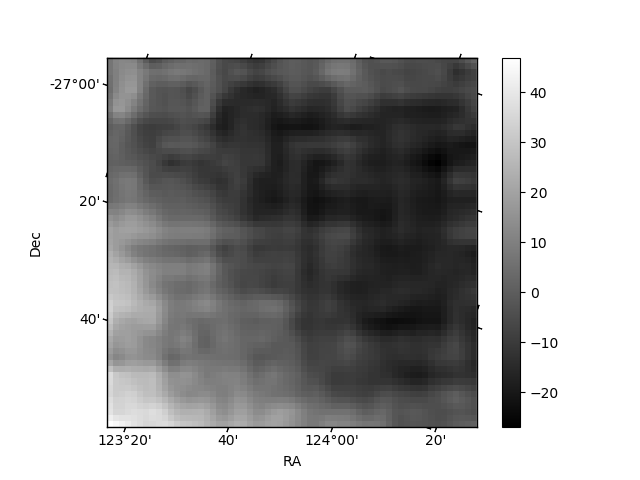
Quadrant B |
|---|---|---|---|
| Quadrant D | 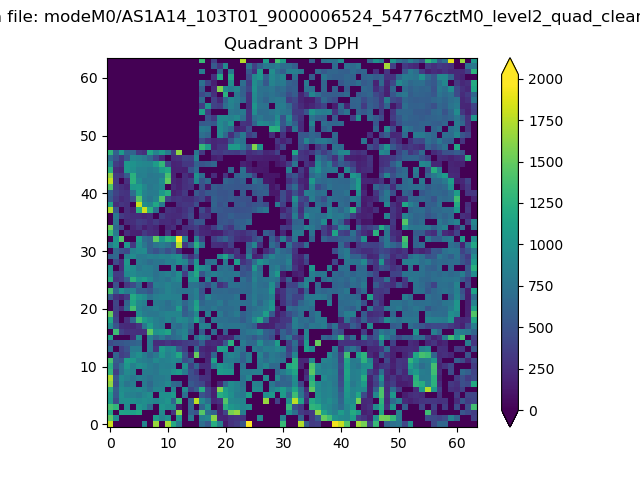 |
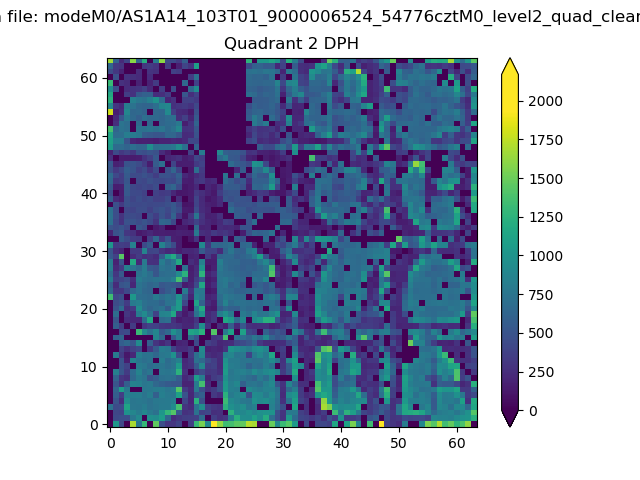 |
Quadrant C |
| Plot type | Count rate plots | Images |
|---|---|---|
| Comparison with Poisson distribution Blue bars denote a histogram of data divided into 1 sec bins. Red curve is a Poisson curve with rate = median count rate of data. |
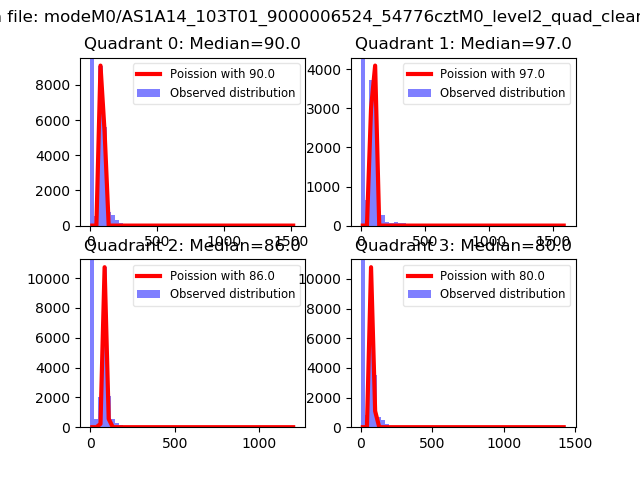 |
 |
| Quadrant-wise count rates Data is divided into 100 sec bins |
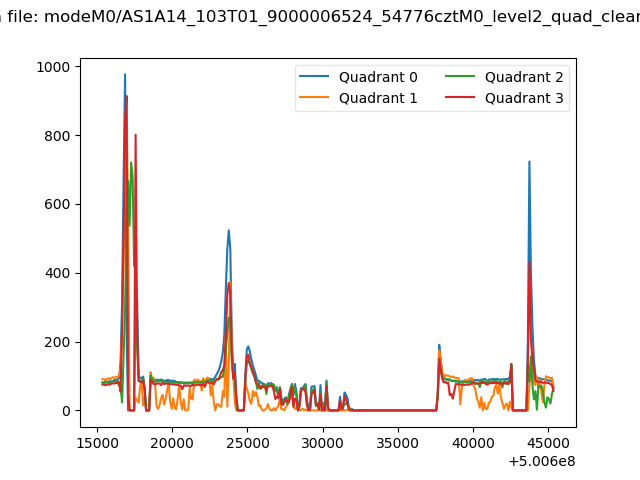 |
|
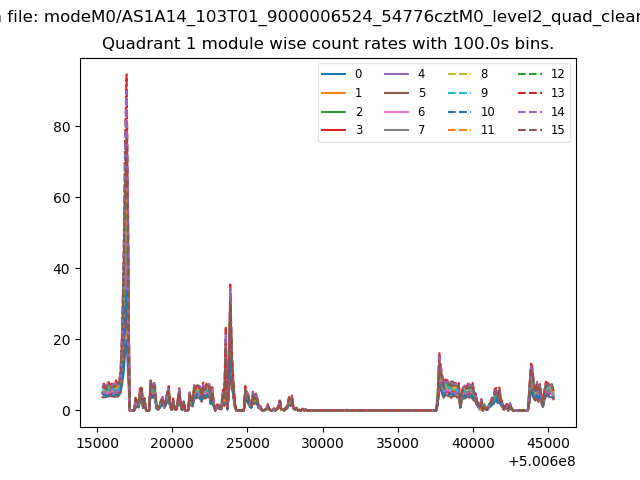
| Module-wise count rates for Quadrant A Data is divided into 100 sec bins |
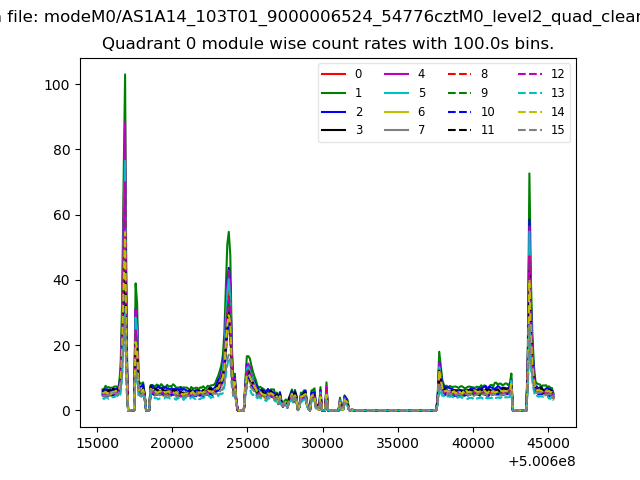 |
 |
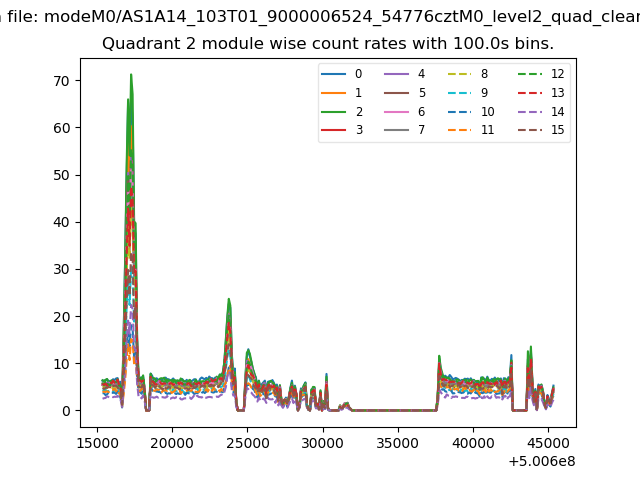
| Module-wise count rates for Quadrant B Data is divided into 100 sec bins |
 |
 |
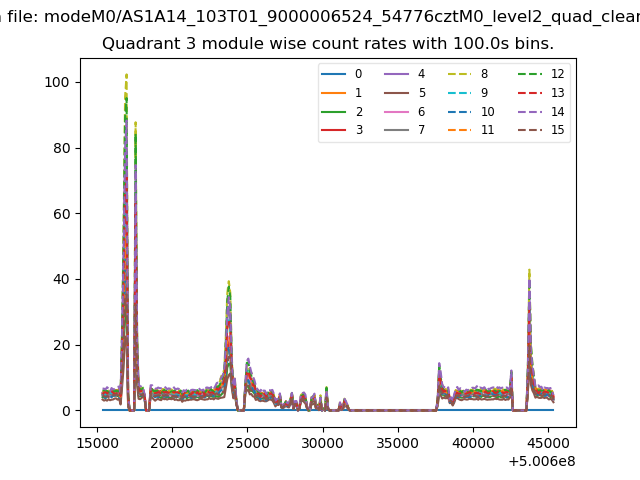
| Module-wise count rates for Quadrant C Data is divided into 100 sec bins |
 |
 |
| Module-wise count rates for Quadrant D Data is divided into 100 sec bins |
 |
 |
| Parameter | Plot |
|---|---|
| CZT HV Monitor | 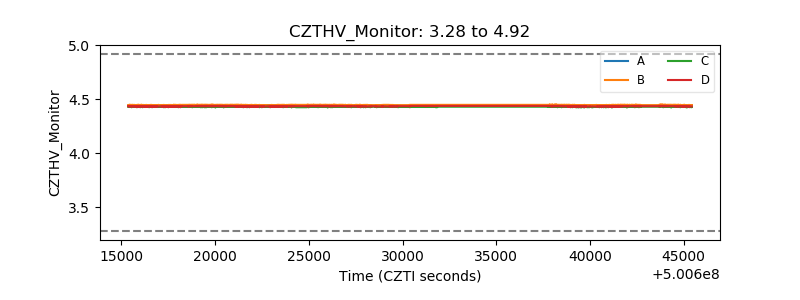 |
| D_VDD | 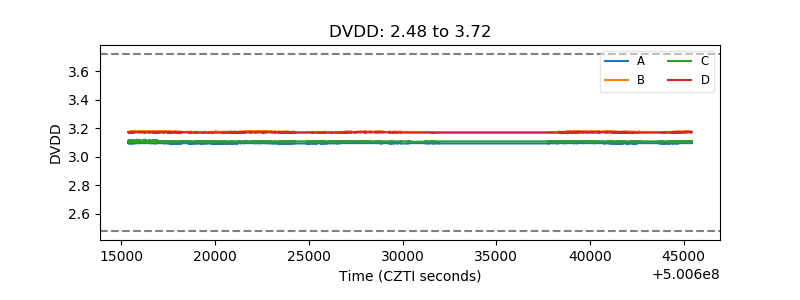 |
| Temperature 1 | 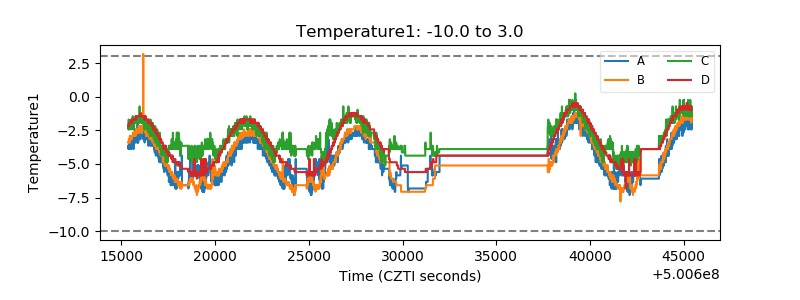 |
| Veto HV Monitor | 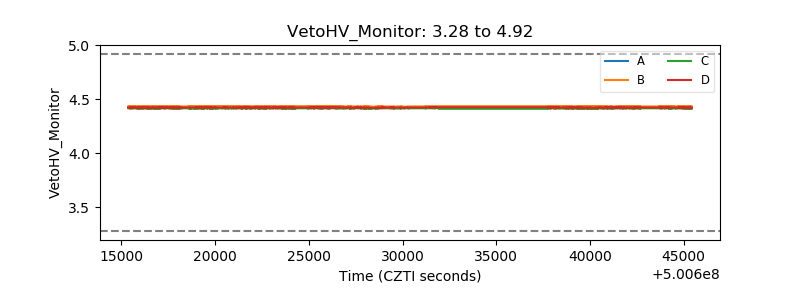 |
| Veto LLD | 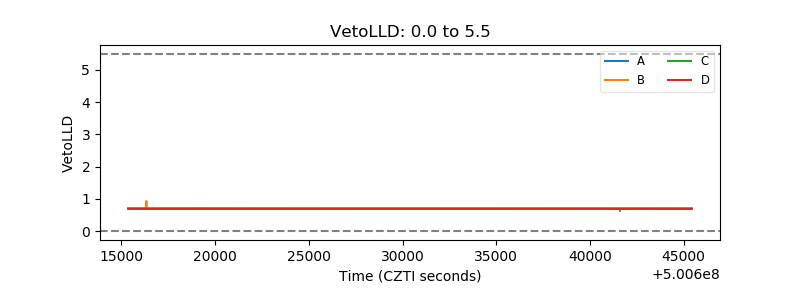 |
| Alpha Counter |  |
| _CPM_Rate | 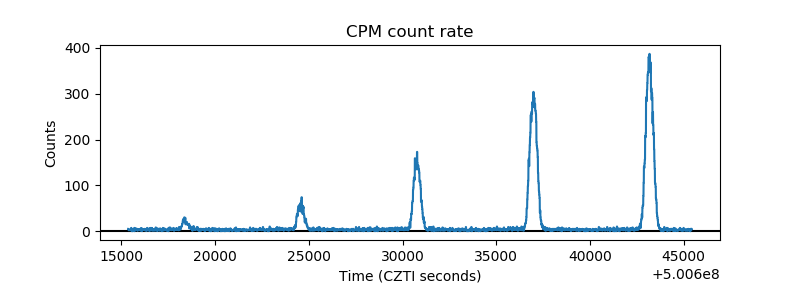 |
| CZT Counter | 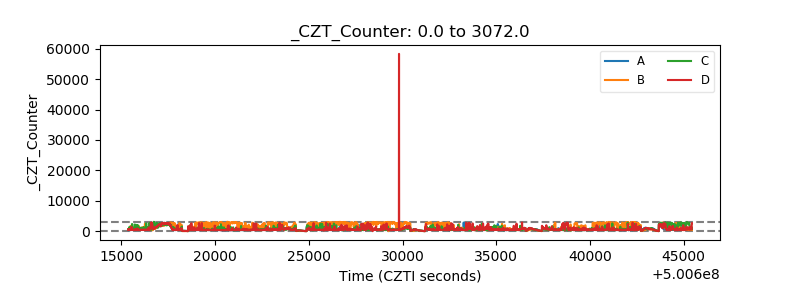 |
| +2.5 Volts monitor |  |
| +5 Volts monitor |  |
| _ROLL_ROT | 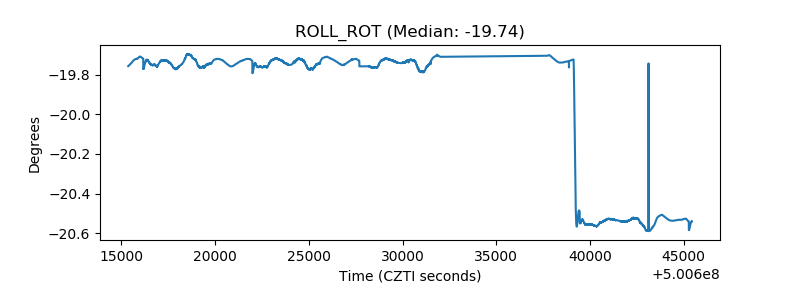 |
| _Roll_DEC | 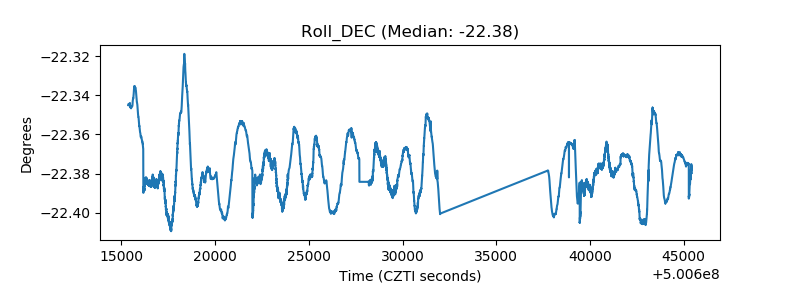 |
| _Roll_RA | 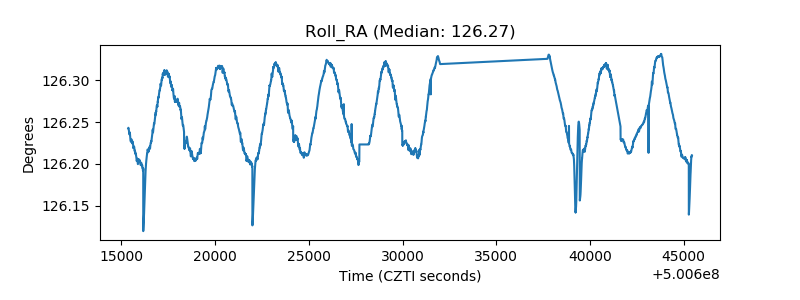 |
| Veto Counter | 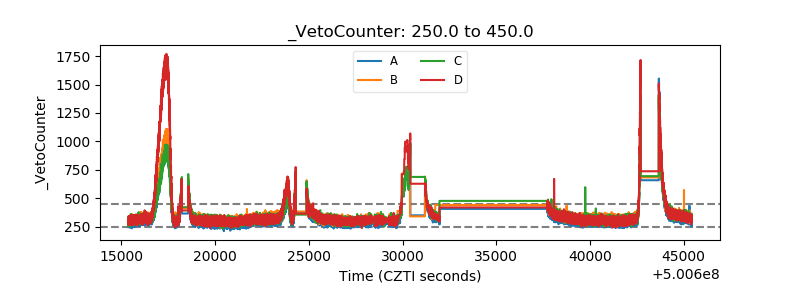 |