| Param | Original file | Final file |
|---|---|---|
| Filename | modeM0/AS1A14_103T01_9000006524_54778cztM0_level2.fits | modeM0/AS1A14_103T01_9000006524_54778cztM0_level2_quad_clean.evt |
| Size (bytes) | 703,814,400 | 88,416,000 |
| Size | 671.2 MB | 84.3 MB |
| Events in quadrant A | 3,240,015 | 650,359 |
| Events in quadrant B | 10,039,146 | 440,362 |
| Events in quadrant C | 6,863,822 | 566,524 |
| Events in quadrant D | 5,387,032 | 550,198 |
| Mode SS | |||
|---|---|---|---|
| Quadrant | BADHDUFLAG | Total packets | Discarded packets |
| A | 0 | 136 | 0 |
| B | 0 | 136 | 0 |
| C | 0 | 136 | 0 |
| D | 0 | 136 | 0 |
| Mode M0 | |||
|---|---|---|---|
| Quadrant | BADHDUFLAG | Total packets | Discarded packets |
| A | 0 | 14694 | 2 |
| B | 0 | 34419 | 2 |
| C | 0 | 25080 | 2 |
| D | 0 | 20806 | 2 |
| Mode M9 | |||
|---|---|---|---|
| Quadrant | BADHDUFLAG | Total packets | Discarded packets |
| A | 0 | 14 | 0 |
| B | 0 | 14 | 0 |
| C | 0 | 14 | 0 |
| D | 0 | 15 | 0 |
| Quadrant | Total seconds | Saturated seconds | Saturation percentage |
|---|---|---|---|
| A | 6742 | 161 | 2.388015% |
| B | 6741 | 2846 | 42.219255% |
| C | 6741 | 953 | 14.137368% |
| D | 6741 | 687 | 10.191366% |
Noise dominated data is calculated using 1-second bins in cleaned event files. If a bin has >2000 counts, and if more than 50% of those come from <1% of pixels, then it is considered to be noise-dominated and hence unusable.
| Quadrant | # 1 sec bins | Bins with >0 counts | Bins with >2000 counts | High rate bins dominated by noise | Noise dominated (total time) | Noise dominated (detector-on time) | Marked lightcurve |
|---|---|---|---|---|---|---|---|
| A | 7822 | 6743 | 36 | 36 | 0.46% | 0.53% | 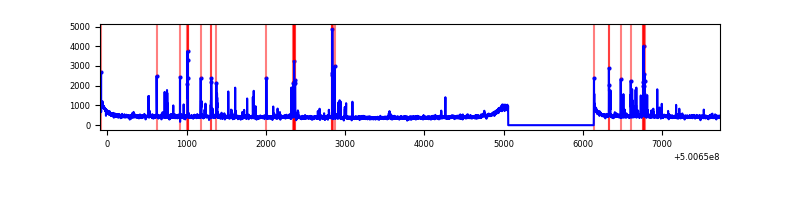 |
| B | 7821 | 6742 | 2361 | 2361 | 30.19% | 35.02% | 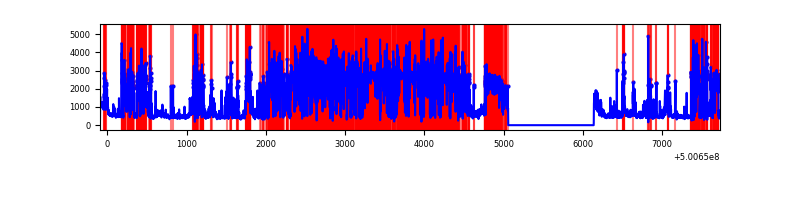 |
| C | 7821 | 6742 | 739 | 739 | 9.45% | 10.96% | 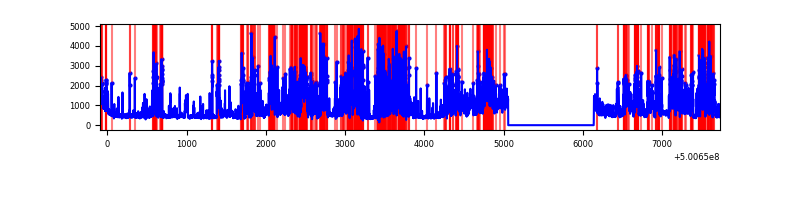 |
| D | 7821 | 6742 | 514 | 514 | 6.57% | 7.62% | 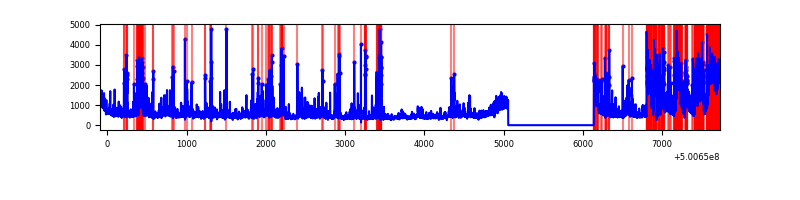 |
Top three noisy pixels from each quadrant. If the there are fewer than three noisy pixels in the level2.evt file, extra rows are filled as -1
| Pixel properties | Quadrant properties | ||||||
|---|---|---|---|---|---|---|---|
| Quadrant | DetID | PixID | Counts | Sigma | Mean | Median | Sigma |
| A | 13 | 248 | 223731 | 1200.05 | 745 | 723 | 185.8 |
| A | 5 | 240 | 61310 | 326.03 | 745 | 723 | 185.8 |
| A | 4 | 3 | 20930 | 108.74 | 745 | 723 | 185.8 |
| B | 2 | 249 | 7554441 | 63775.24 | 551 | 530 | 118.4 |
| B | 5 | 185 | 165417 | 1392.09 | 551 | 530 | 118.4 |
| B | 0 | 245 | 45724 | 381.56 | 551 | 530 | 118.4 |
| C | 9 | 38 | 3478279 | 18385.15 | 688 | 681 | 189.2 |
| C | 12 | 252 | 279781 | 1475.53 | 688 | 681 | 189.2 |
| C | 14 | 254 | 158296 | 833.27 | 688 | 681 | 189.2 |
| D | 3 | 12 | 840267 | 4271.83 | 698 | 668 | 196.5 |
| D | 3 | 224 | 442415 | 2247.58 | 698 | 668 | 196.5 |
| D | 15 | 94 | 397114 | 2017.09 | 698 | 668 | 196.5 |
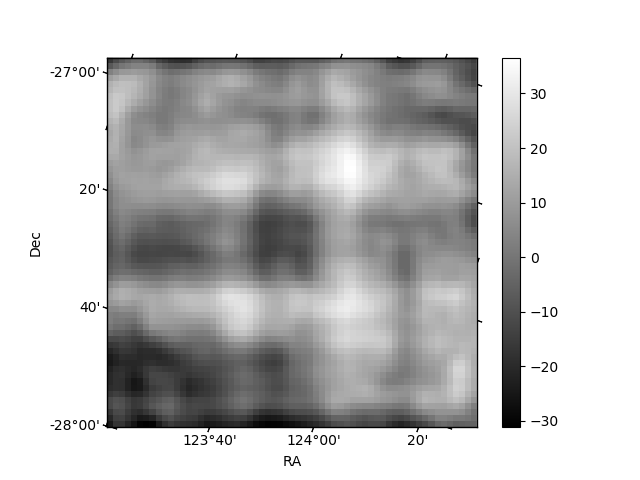
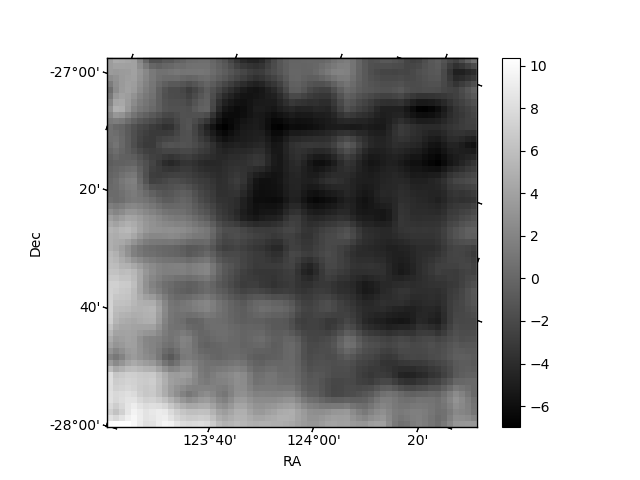
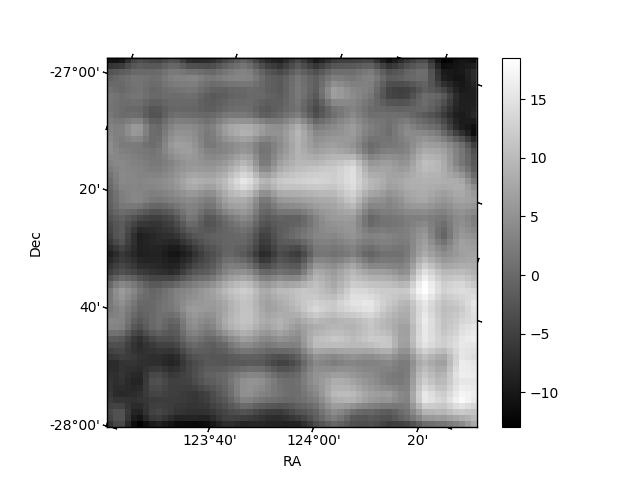
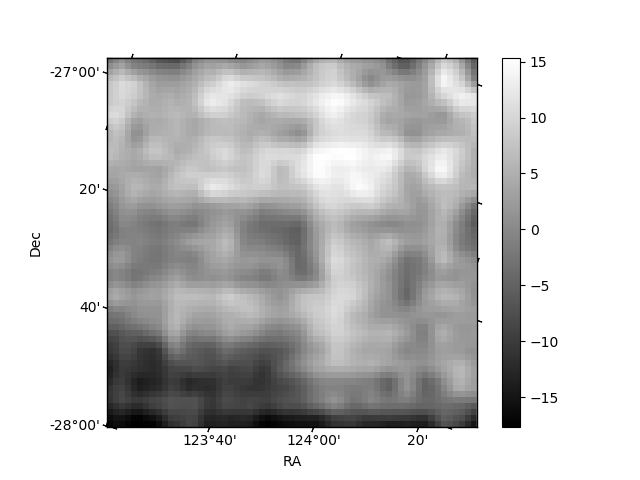
Histogram calculated using DETX and DETY for each event in the final _common_clean file
| Quadrant A | 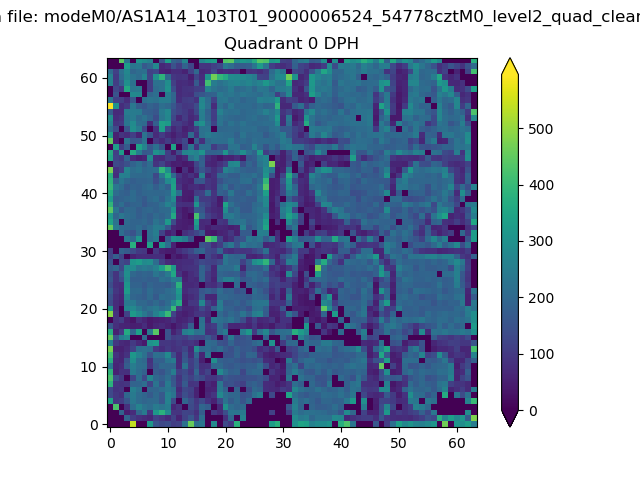 |
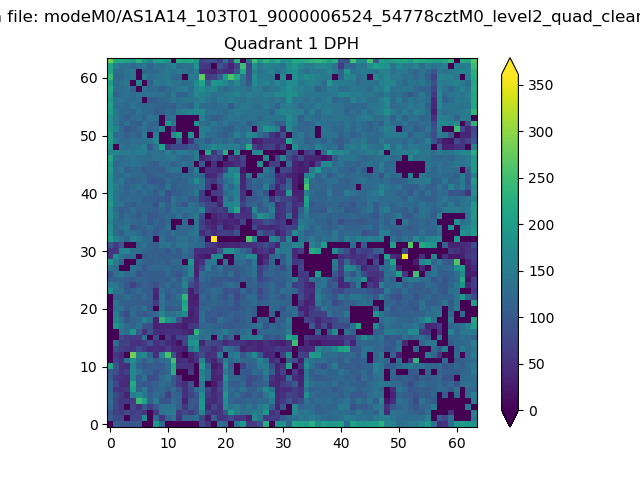 |
Quadrant B |
|---|---|---|---|
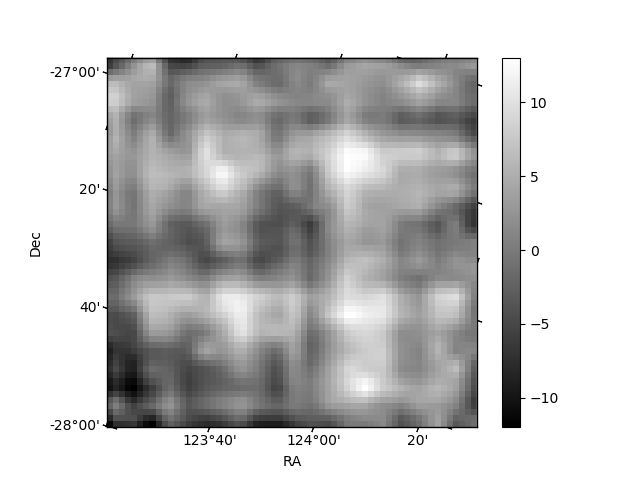
| Quadrant D | 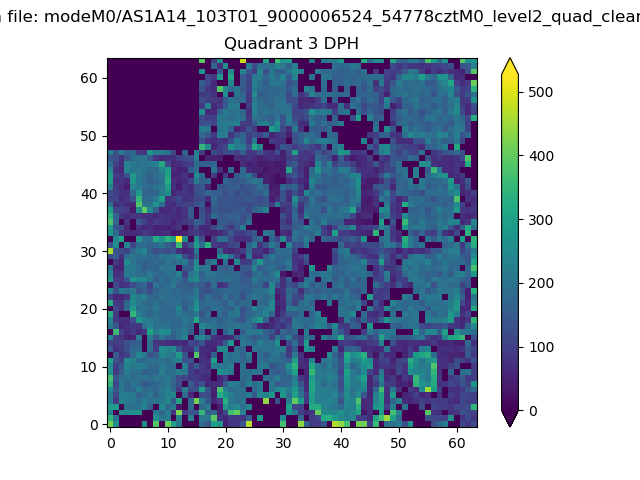 |
 |
Quadrant C |
| Plot type | Count rate plots | Images |
|---|---|---|
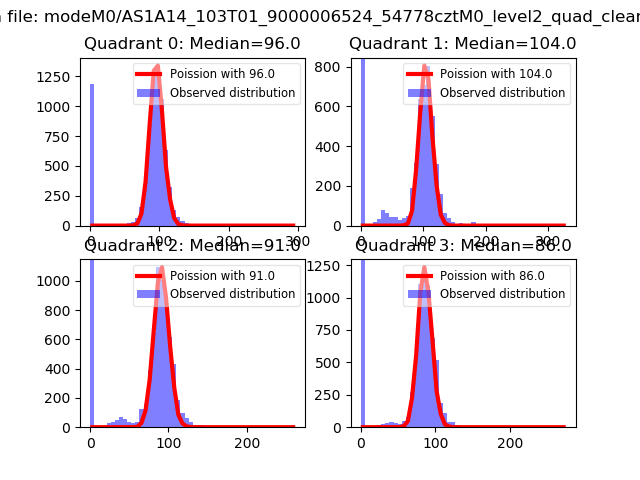
| Comparison with Poisson distribution Blue bars denote a histogram of data divided into 1 sec bins. Red curve is a Poisson curve with rate = median count rate of data. |
 |
 |
| Quadrant-wise count rates Data is divided into 100 sec bins |
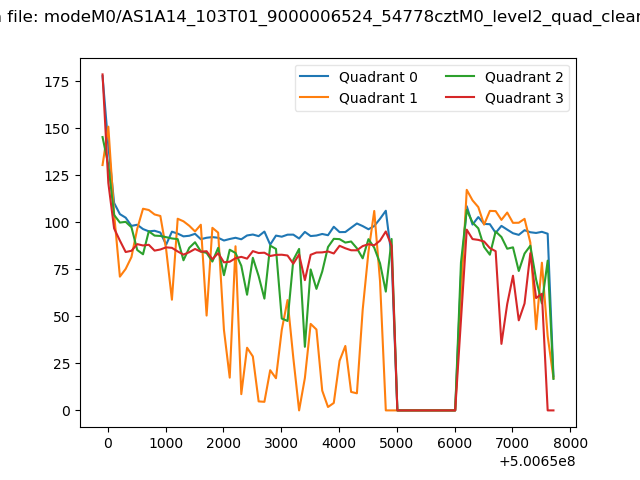 |
|
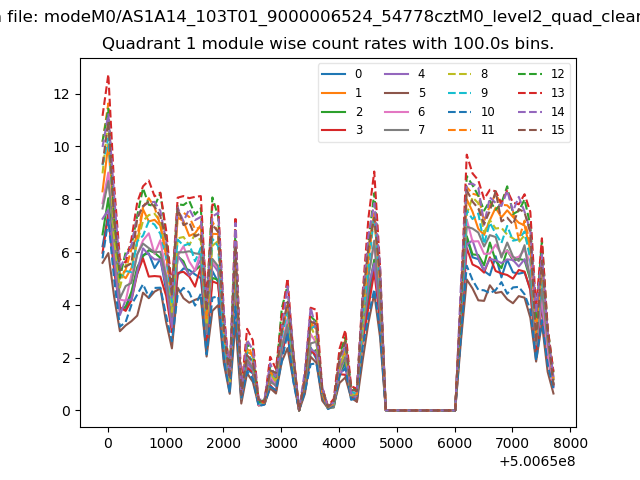
| Module-wise count rates for Quadrant A Data is divided into 100 sec bins |
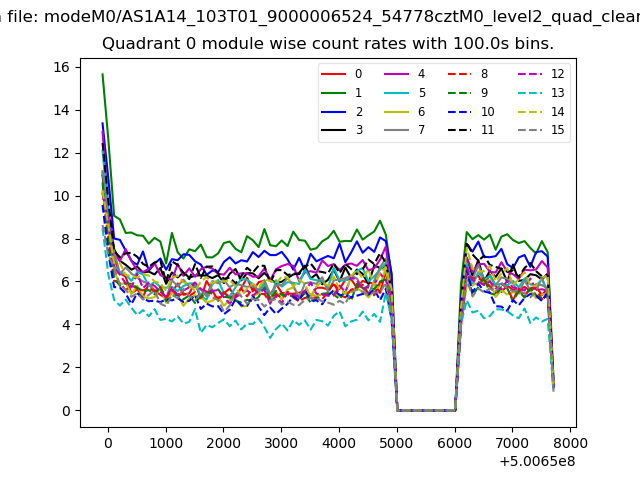 |
 |
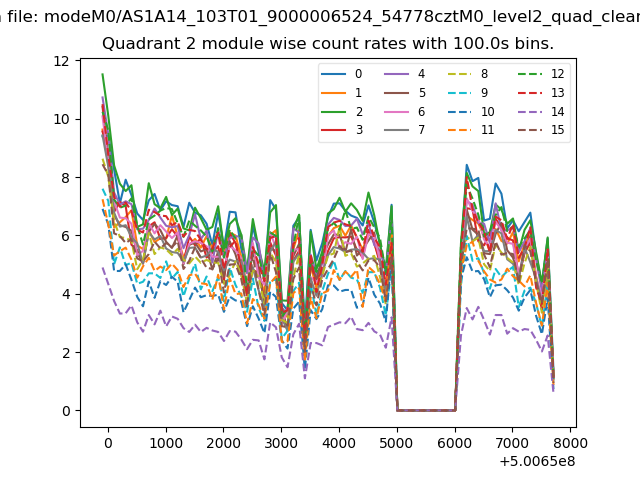
| Module-wise count rates for Quadrant B Data is divided into 100 sec bins |
 |
 |
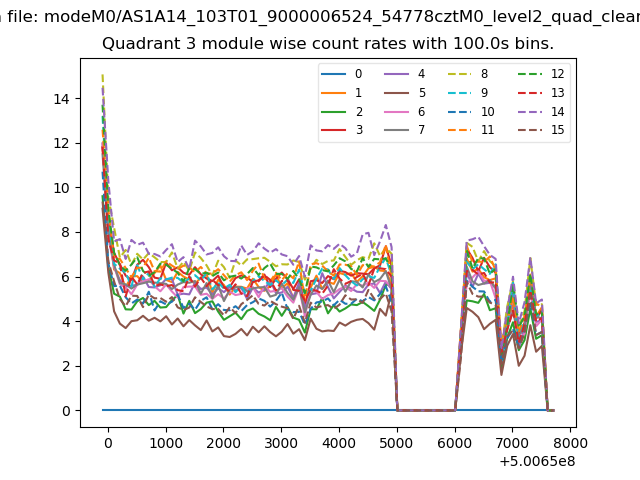
| Module-wise count rates for Quadrant C Data is divided into 100 sec bins |
 |
 |
| Module-wise count rates for Quadrant D Data is divided into 100 sec bins |
 |
 |
| Parameter | Plot |
|---|---|
| CZT HV Monitor | 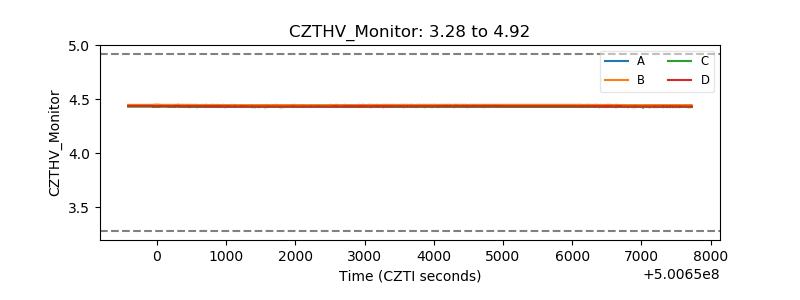 |
| D_VDD | 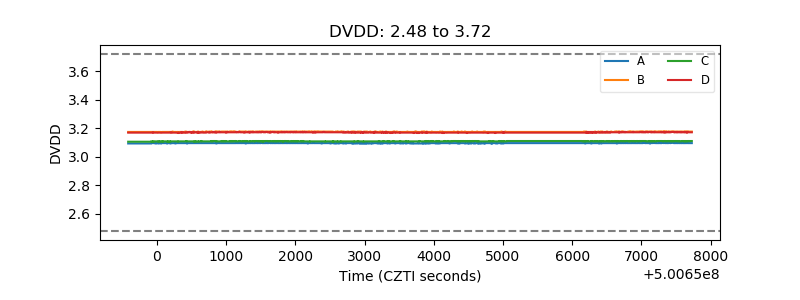 |
| Temperature 1 | 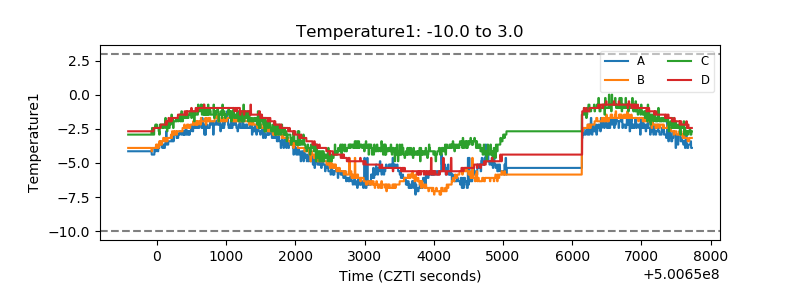 |
| Veto HV Monitor | 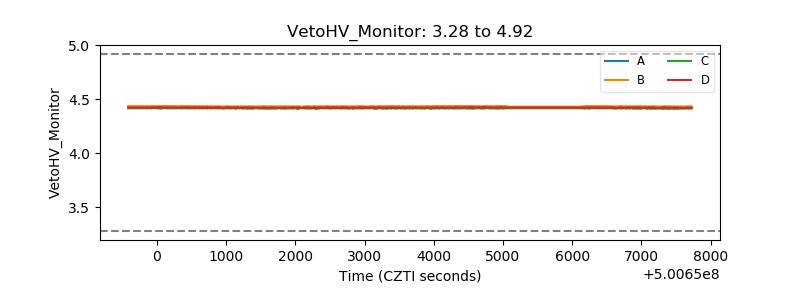 |
| Veto LLD | 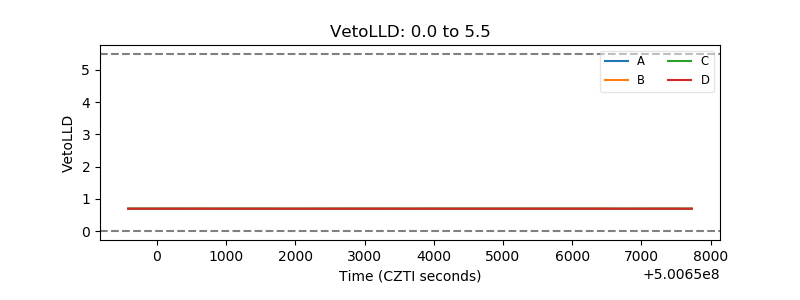 |
| Alpha Counter | 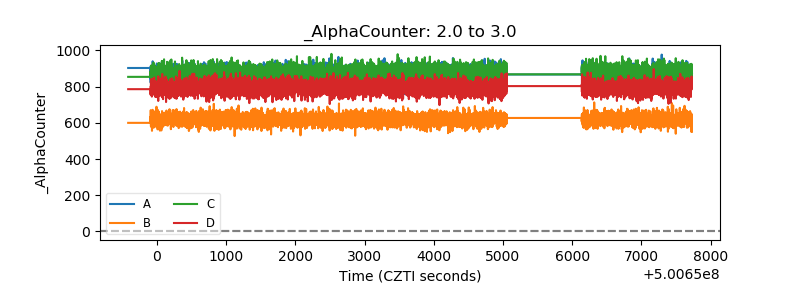 |
| _CPM_Rate | 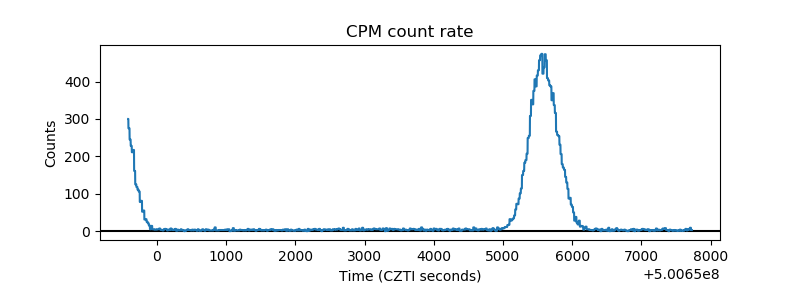 |
| CZT Counter | 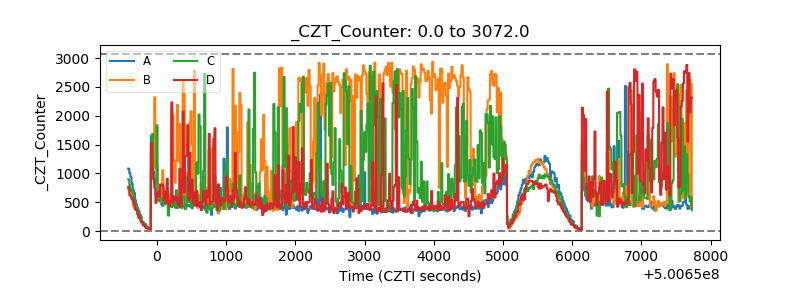 |
| +2.5 Volts monitor |  |
| +5 Volts monitor |  |
| _ROLL_ROT | 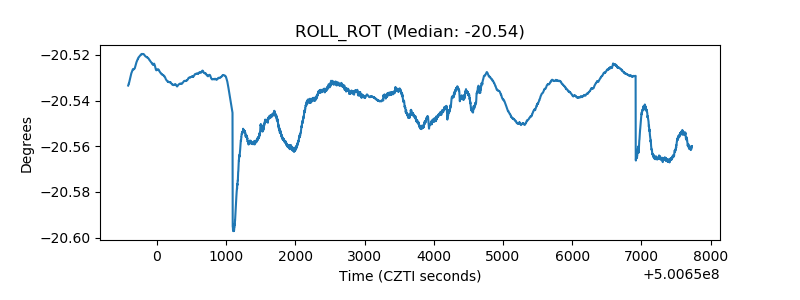 |
| _Roll_DEC | 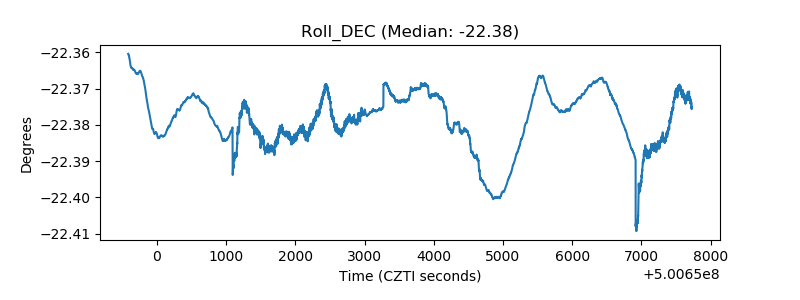 |
| _Roll_RA | 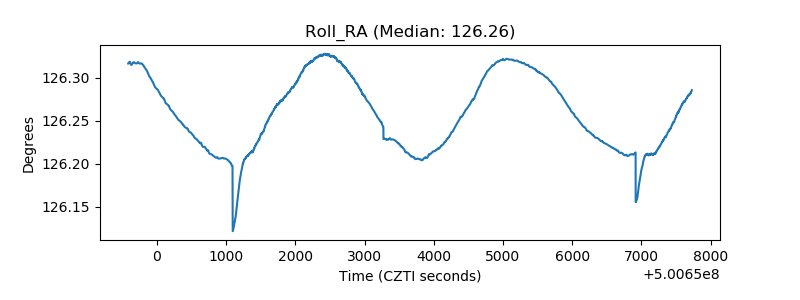 |
| Veto Counter | 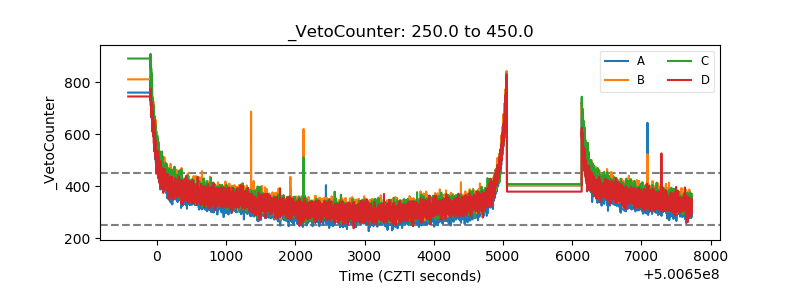 |