| Param | Original file | Final file |
|---|---|---|
| Filename | modeM0/AS1A14_103T01_9000006524_54780cztM0_level2.fits | modeM0/AS1A14_103T01_9000006524_54780cztM0_level2_quad_clean.evt |
| Size (bytes) | 434,888,640 | 72,020,160 |
| Size | 414.7 MB | 68.7 MB |
| Events in quadrant A | 2,546,353 | 504,456 |
| Events in quadrant B | 5,516,986 | 431,722 |
| Events in quadrant C | 3,973,749 | 435,157 |
| Events in quadrant D | 3,641,618 | 431,534 |
| Mode SS | |||
|---|---|---|---|
| Quadrant | BADHDUFLAG | Total packets | Discarded packets |
| A | 0 | 128 | 10 |
| B | 0 | 128 | 12 |
| C | 0 | 128 | 10 |
| D | 0 | 128 | 16 |
| Mode M0 | |||
|---|---|---|---|
| Quadrant | BADHDUFLAG | Total packets | Discarded packets |
| A | 0 | 13253 | 1357 |
| B | 0 | 23518 | 3391 |
| C | 0 | 19443 | 4065 |
| D | 0 | 17193 | 2400 |
| Mode M9 | |||
|---|---|---|---|
| Quadrant | BADHDUFLAG | Total packets | Discarded packets |
| A | 0 | 15 | 1 |
| B | 0 | 15 | 0 |
| C | 0 | 15 | 0 |
| D | 0 | 15 | 0 |
| Quadrant | Total seconds | Saturated seconds | Saturation percentage |
|---|---|---|---|
| A | 5525 | 157 | 2.841629% |
| B | 5316 | 1116 | 20.993228% |
| C | 5252 | 426 | 8.111196% |
| D | 5406 | 361 | 6.677765% |
Noise dominated data is calculated using 1-second bins in cleaned event files. If a bin has >2000 counts, and if more than 50% of those come from <1% of pixels, then it is considered to be noise-dominated and hence unusable.
| Quadrant | # 1 sec bins | Bins with >0 counts | Bins with >2000 counts | High rate bins dominated by noise | Noise dominated (total time) | Noise dominated (detector-on time) | Marked lightcurve |
|---|---|---|---|---|---|---|---|
| A | 8710 | 5900 | 16 | 16 | 0.18% | 0.27% | 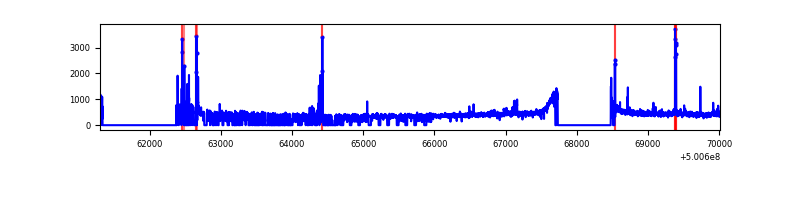 |
| B | 8711 | 5760 | 825 | 825 | 9.47% | 14.32% | 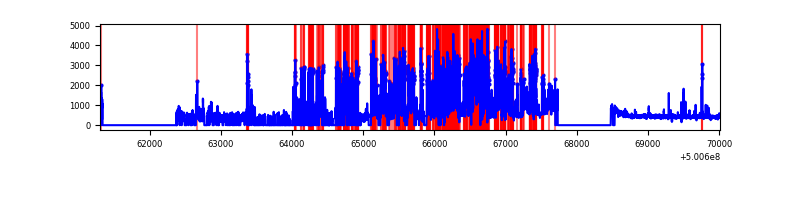 |
| C | 8712 | 5688 | 199 | 199 | 2.28% | 3.50% | 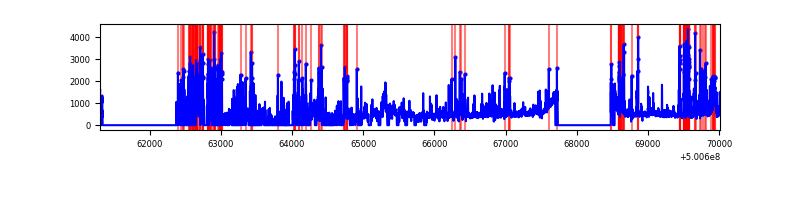 |
| D | 8712 | 5832 | 223 | 223 | 2.56% | 3.82% | 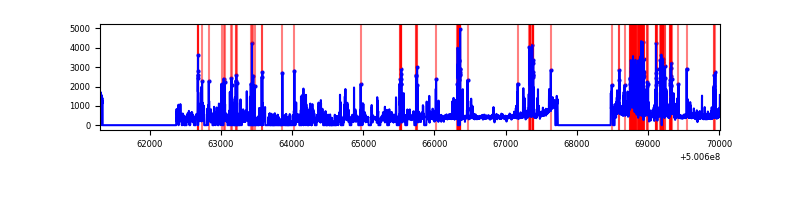 |
Top three noisy pixels from each quadrant. If the there are fewer than three noisy pixels in the level2.evt file, extra rows are filled as -1
| Pixel properties | Quadrant properties | ||||||
|---|---|---|---|---|---|---|---|
| Quadrant | DetID | PixID | Counts | Sigma | Mean | Median | Sigma |
| A | 13 | 248 | 103748 | 685.55 | 604 | 588 | 150.5 |
| A | 0 | 8 | 26052 | 169.22 | 604 | 588 | 150.5 |
| A | 5 | 240 | 22771 | 147.42 | 604 | 588 | 150.5 |
| B | 2 | 249 | 3255608 | 28256.29 | 532 | 512 | 115.2 |
| B | 5 | 185 | 78976 | 681.12 | 532 | 512 | 115.2 |
| B | 10 | 247 | 30416 | 259.59 | 532 | 512 | 115.2 |
| C | 9 | 38 | 1146160 | 7597.14 | 544 | 539 | 150.8 |
| C | 13 | 3 | 269348 | 1782.6 | 544 | 539 | 150.8 |
| C | 14 | 254 | 134713 | 889.77 | 544 | 539 | 150.8 |
| D | 15 | 94 | 425194 | 2661.91 | 562 | 538 | 159.5 |
| D | 11 | 129 | 355459 | 2224.79 | 562 | 538 | 159.5 |
| D | 3 | 176 | 184143 | 1150.91 | 562 | 538 | 159.5 |
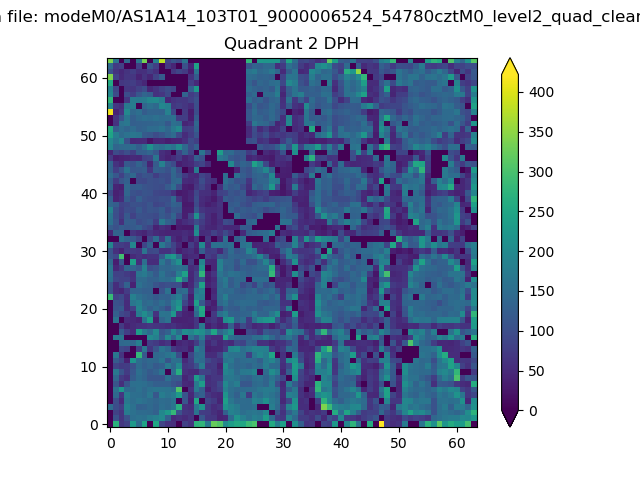
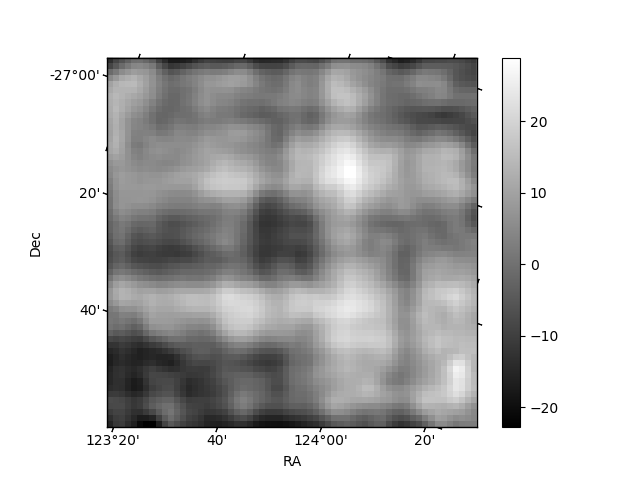
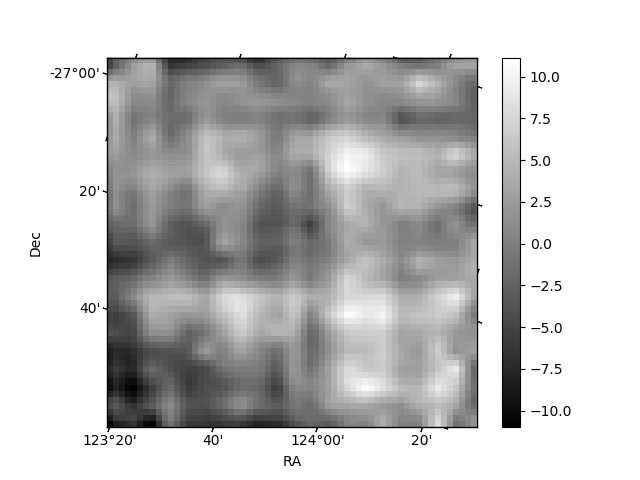
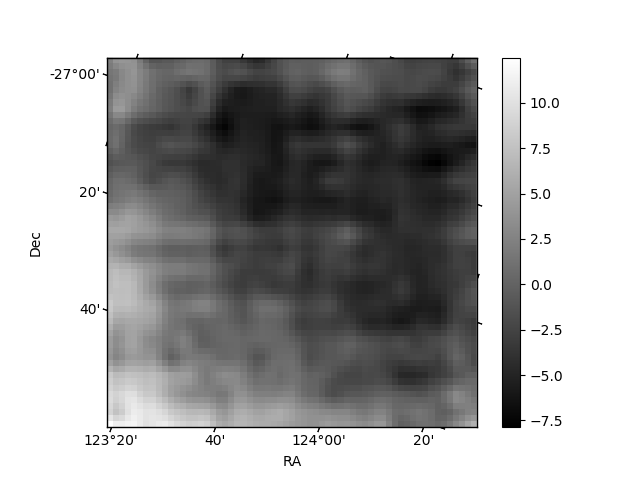
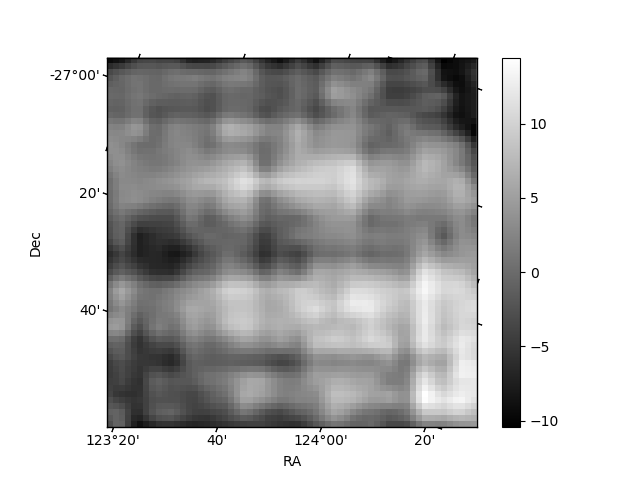
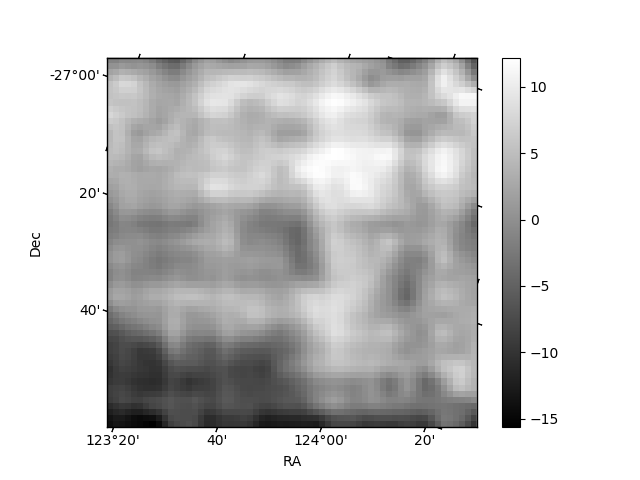
Histogram calculated using DETX and DETY for each event in the final _common_clean file
| Quadrant A | 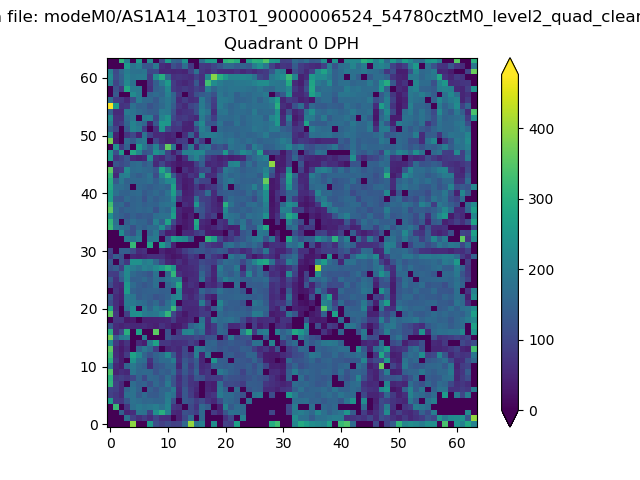 |
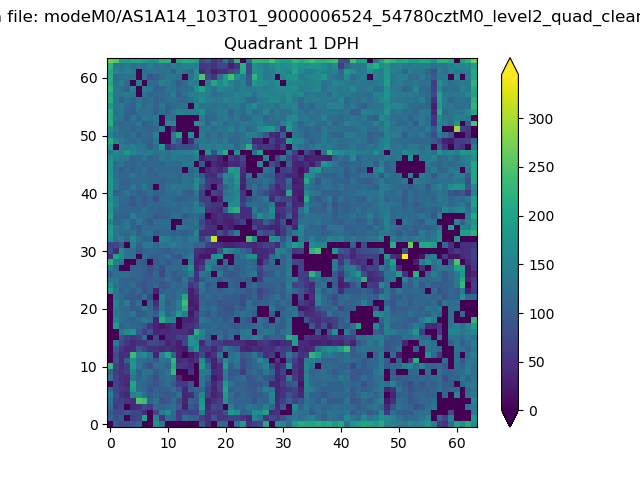 |
Quadrant B |
|---|---|---|---|
| Quadrant D | 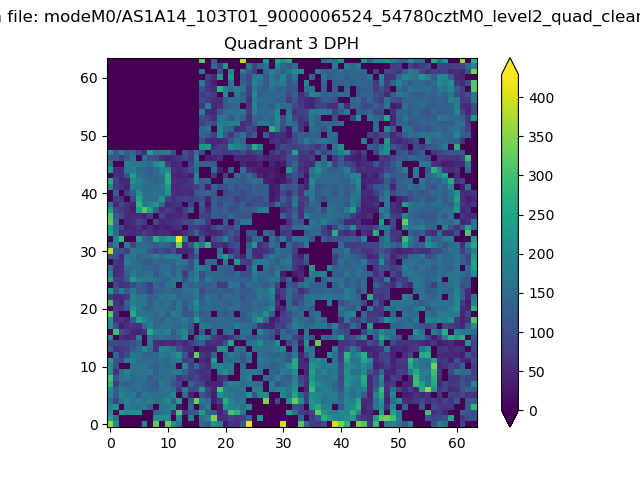 |
 |
Quadrant C |
| Plot type | Count rate plots | Images |
|---|---|---|
| Comparison with Poisson distribution Blue bars denote a histogram of data divided into 1 sec bins. Red curve is a Poisson curve with rate = median count rate of data. |
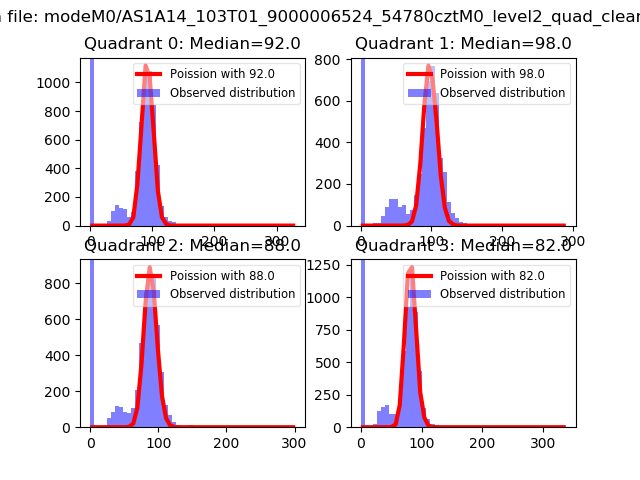 |
 |
| Quadrant-wise count rates Data is divided into 100 sec bins |
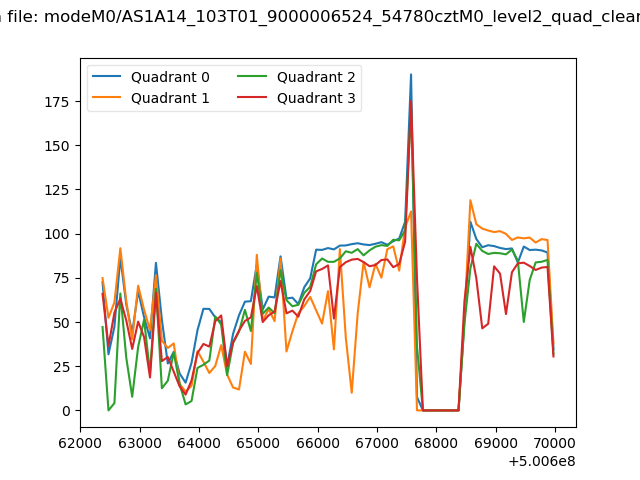 |
|
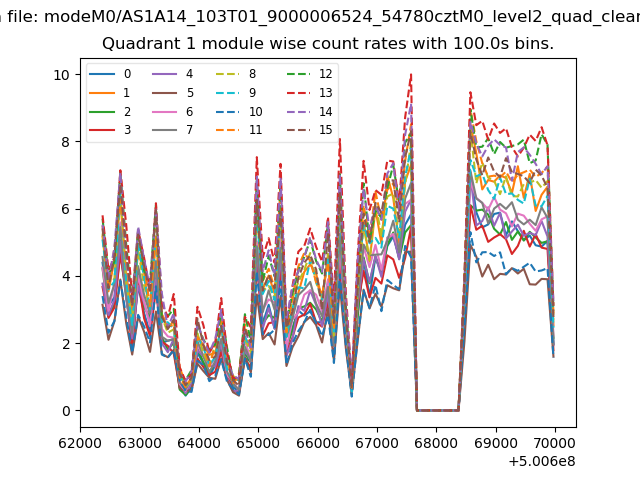
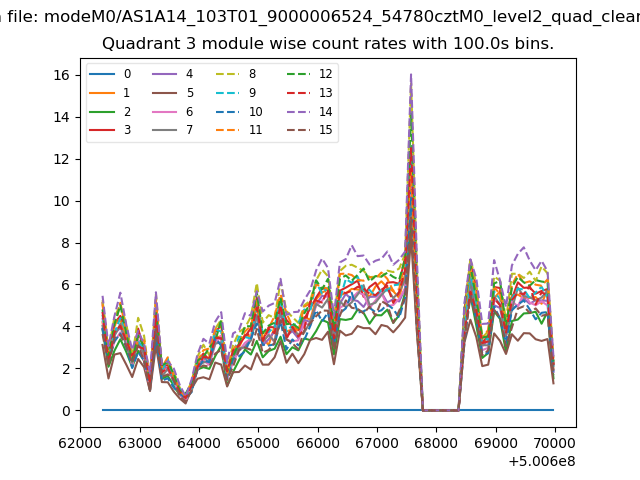
| Module-wise count rates for Quadrant A Data is divided into 100 sec bins |
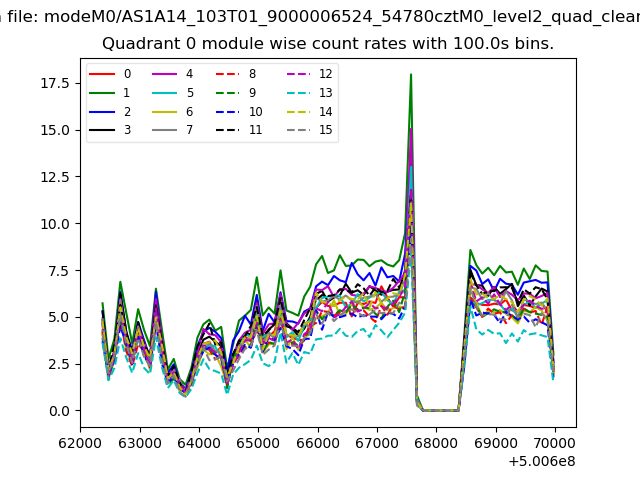 |
 |
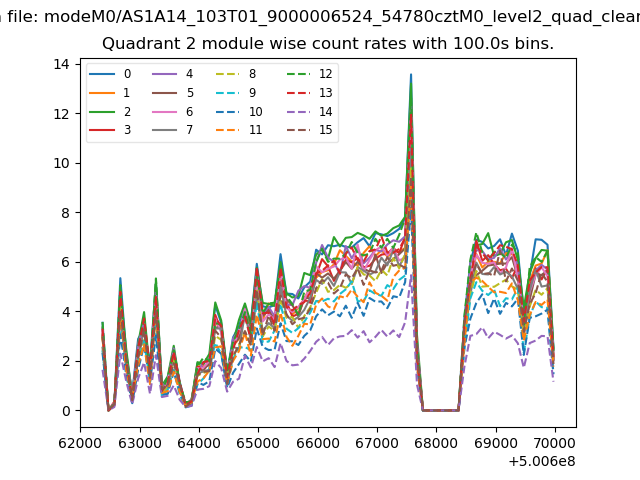
| Module-wise count rates for Quadrant B Data is divided into 100 sec bins |
 |
 |
| Module-wise count rates for Quadrant C Data is divided into 100 sec bins |
 |
 |
| Module-wise count rates for Quadrant D Data is divided into 100 sec bins |
 |
 |
| Parameter | Plot |
|---|---|
| CZT HV Monitor | 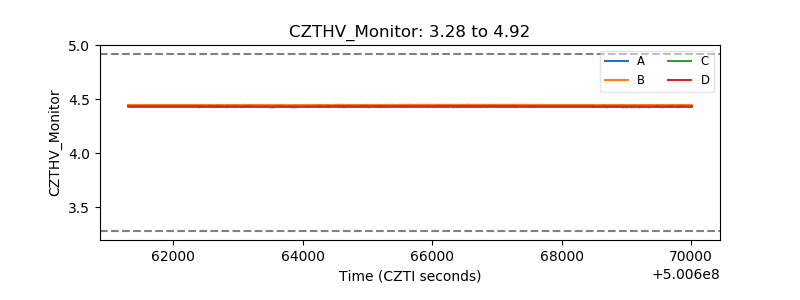 |
| D_VDD | 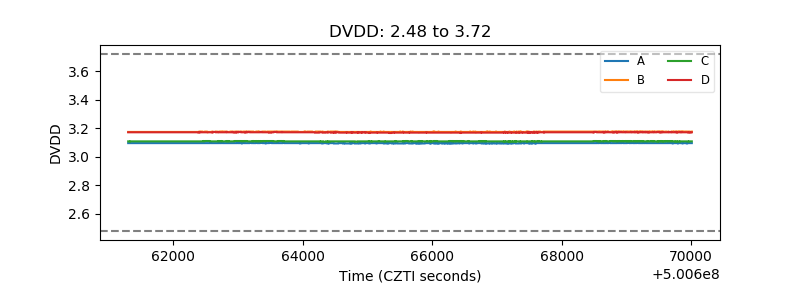 |
| Temperature 1 |  |
| Veto HV Monitor | 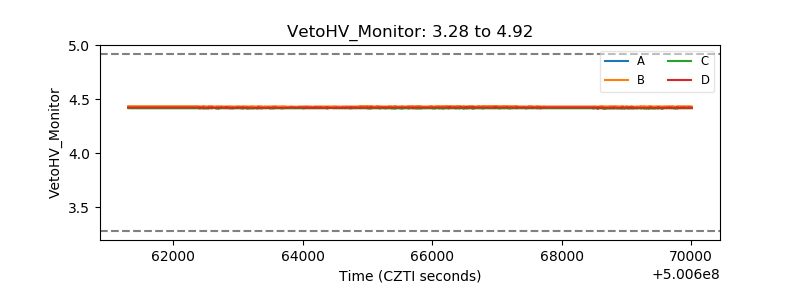 |
| Veto LLD | 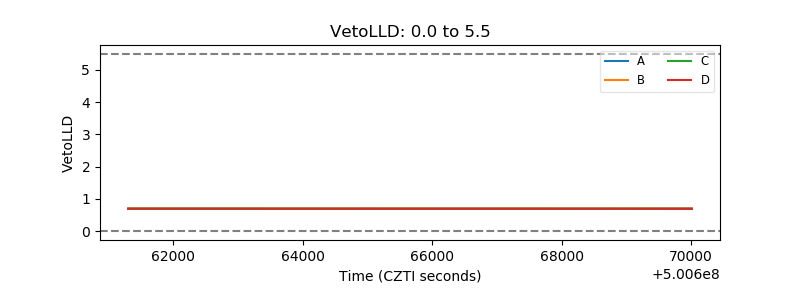 |
| Alpha Counter | 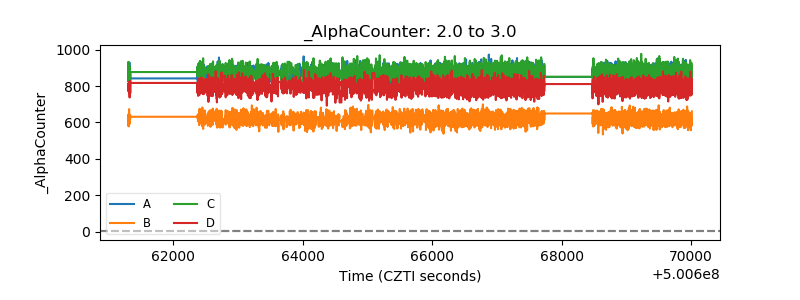 |
| _CPM_Rate | 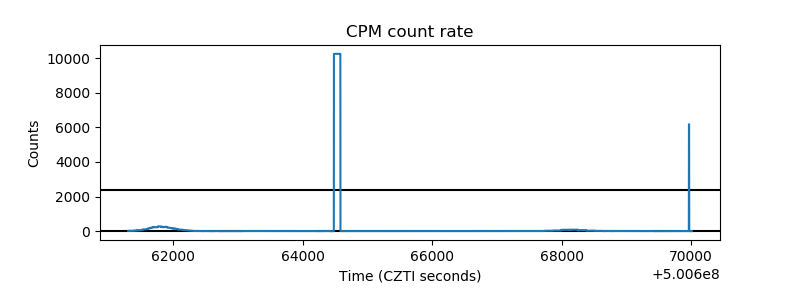 |
| CZT Counter | 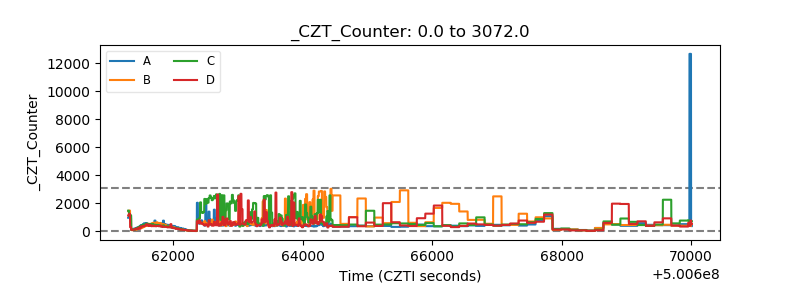 |
| +2.5 Volts monitor | 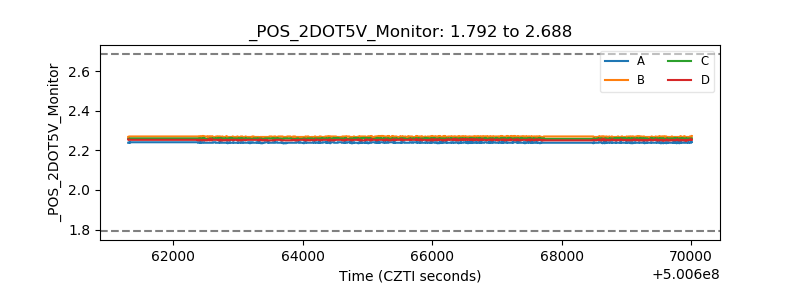 |
| +5 Volts monitor |  |
| _ROLL_ROT |  |
| _Roll_DEC | 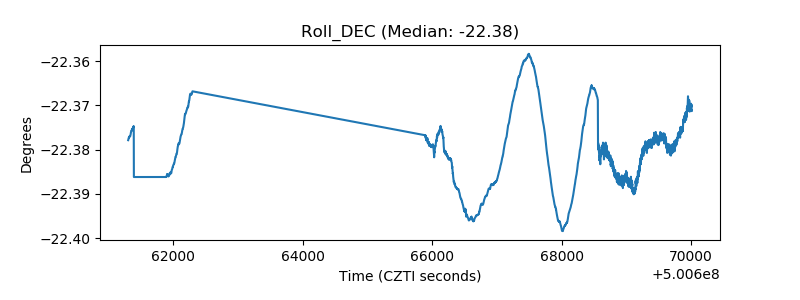 |
| _Roll_RA | 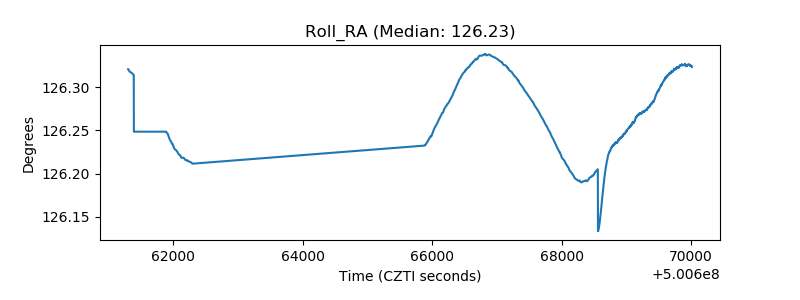 |
| Veto Counter | 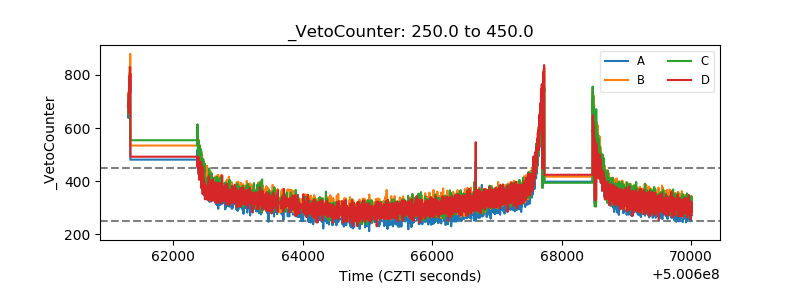 |