| Param | Original file | Final file |
|---|---|---|
| Filename | modeM0/AS1A14_103T01_9000006524_54781cztM0_level2.fits | modeM0/AS1A14_103T01_9000006524_54781cztM0_level2_quad_clean.evt |
| Size (bytes) | 286,128,000 | 54,771,840 |
| Size | 272.9 MB | 52.2 MB |
| Events in quadrant A | 2,263,715 | 356,808 |
| Events in quadrant B | 2,115,782 | 376,157 |
| Events in quadrant C | 2,932,913 | 332,185 |
| Events in quadrant D | 2,974,477 | 318,078 |
| Mode SS | |||
|---|---|---|---|
| Quadrant | BADHDUFLAG | Total packets | Discarded packets |
| A | 0 | 84 | 4 |
| B | 0 | 84 | 6 |
| C | 0 | 84 | 2 |
| D | 0 | 83 | 3 |
| Mode M0 | |||
|---|---|---|---|
| Quadrant | BADHDUFLAG | Total packets | Discarded packets |
| A | 0 | 9977 | 300 |
| B | 0 | 9454 | 309 |
| C | 0 | 11988 | 546 |
| D | 0 | 12327 | 651 |
| Mode M9 | |||
|---|---|---|---|
| Quadrant | BADHDUFLAG | Total packets | Discarded packets |
| A | 0 | 7 | 0 |
| B | 0 | 7 | 0 |
| C | 0 | 7 | 0 |
| D | 0 | 7 | 0 |
| Quadrant | Total seconds | Saturated seconds | Saturation percentage |
|---|---|---|---|
| A | 3900 | 203 | 5.205128% |
| B | 3901 | 187 | 4.793643% |
| C | 3892 | 259 | 6.654676% |
| D | 3894 | 315 | 8.089368% |
Noise dominated data is calculated using 1-second bins in cleaned event files. If a bin has >2000 counts, and if more than 50% of those come from <1% of pixels, then it is considered to be noise-dominated and hence unusable.
| Quadrant | # 1 sec bins | Bins with >0 counts | Bins with >2000 counts | High rate bins dominated by noise | Noise dominated (total time) | Noise dominated (detector-on time) | Marked lightcurve |
|---|---|---|---|---|---|---|---|
| A | 8918 | 3939 | 100 | 100 | 1.12% | 2.54% | 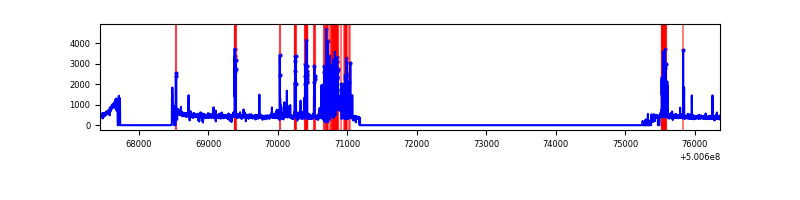 |
| B | 8918 | 3947 | 35 | 35 | 0.39% | 0.89% | 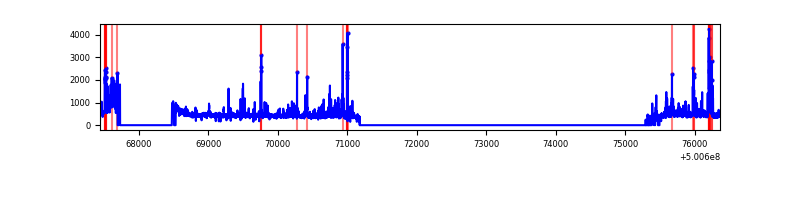 |
| C | 8919 | 3932 | 152 | 152 | 1.70% | 3.87% | 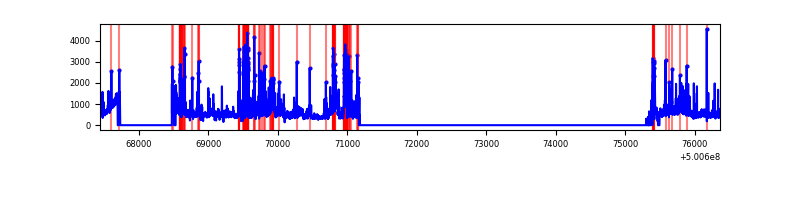 |
| D | 8919 | 3937 | 228 | 228 | 2.56% | 5.79% | 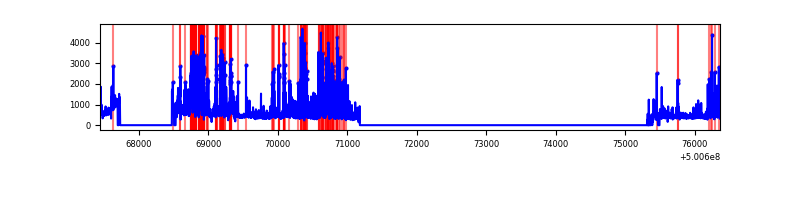 |
Top three noisy pixels from each quadrant. If the there are fewer than three noisy pixels in the level2.evt file, extra rows are filled as -1
| Pixel properties | Quadrant properties | ||||||
|---|---|---|---|---|---|---|---|
| Quadrant | DetID | PixID | Counts | Sigma | Mean | Median | Sigma |
| A | 13 | 248 | 484441 | 4568.02 | 420 | 409 | 106.0 |
| A | 0 | 8 | 100796 | 947.4 | 420 | 409 | 106.0 |
| A | 13 | 254 | 10618 | 96.35 | 420 | 409 | 106.0 |
| B | 5 | 185 | 188845 | 2088.55 | 414 | 399 | 90.2 |
| B | 2 | 249 | 101772 | 1123.52 | 414 | 399 | 90.2 |
| B | 4 | 171 | 93999 | 1037.37 | 414 | 399 | 90.2 |
| C | 9 | 38 | 620390 | 5533.84 | 397 | 393 | 112.0 |
| C | 13 | 3 | 382175 | 3407.63 | 397 | 393 | 112.0 |
| C | 14 | 254 | 132747 | 1181.34 | 397 | 393 | 112.0 |
| D | 15 | 94 | 428249 | 3819.45 | 393 | 375 | 112.0 |
| D | 11 | 129 | 407756 | 3636.51 | 393 | 375 | 112.0 |
| D | 15 | 170 | 260804 | 2324.74 | 393 | 375 | 112.0 |
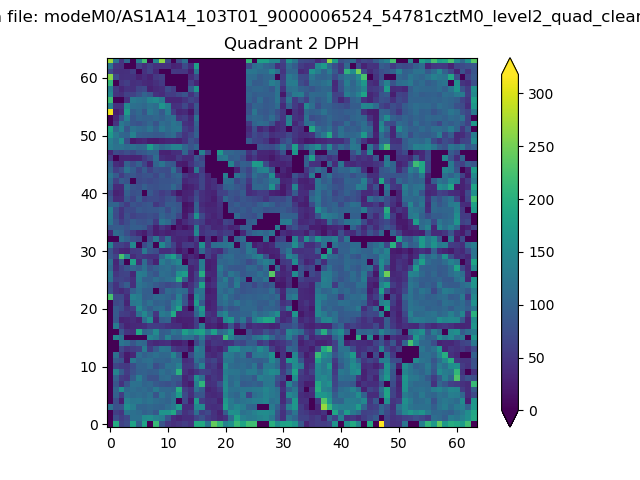
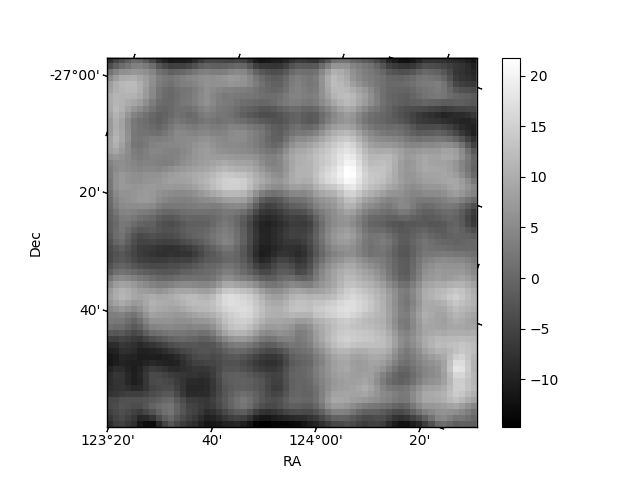
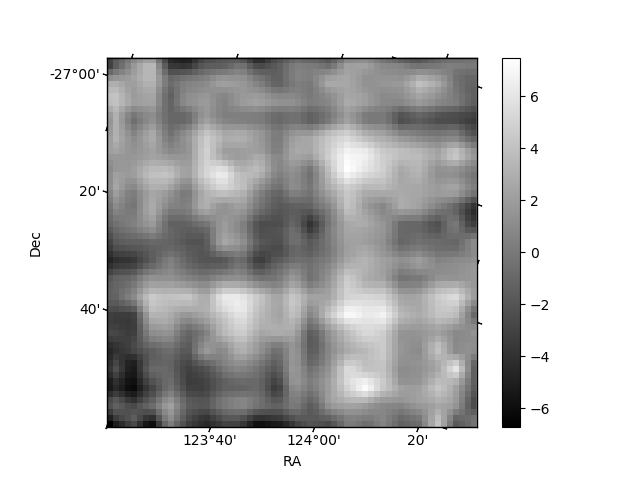
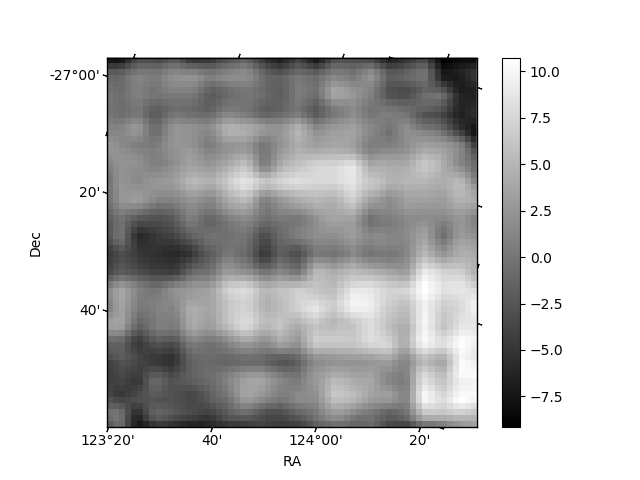
Histogram calculated using DETX and DETY for each event in the final _common_clean file
| Quadrant A | 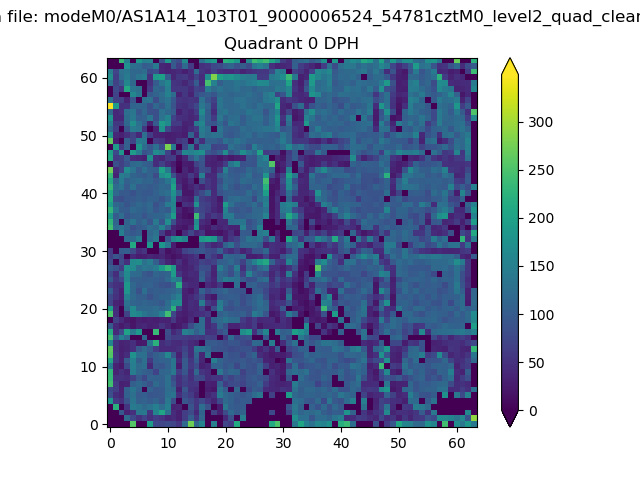 |
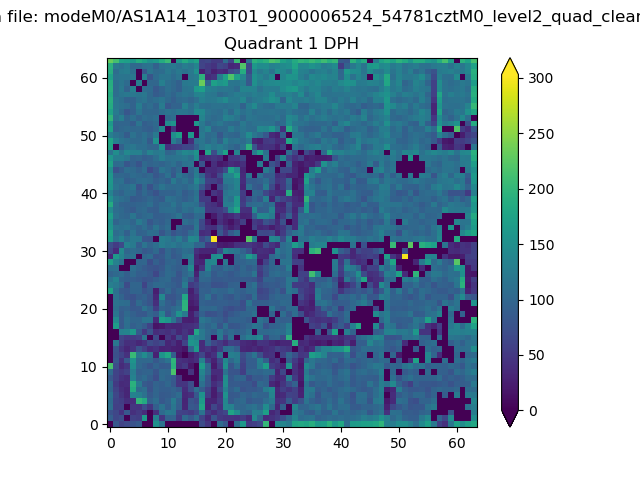 |
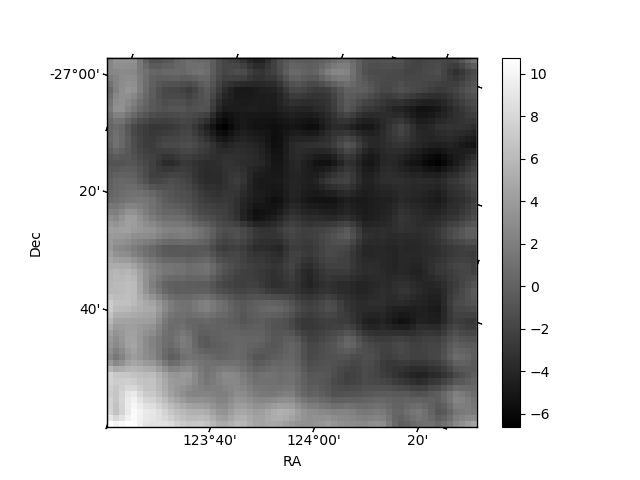
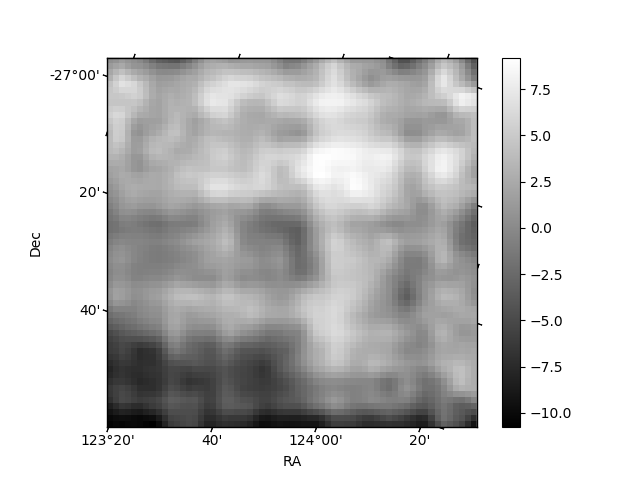
Quadrant B |
|---|---|---|---|
| Quadrant D | 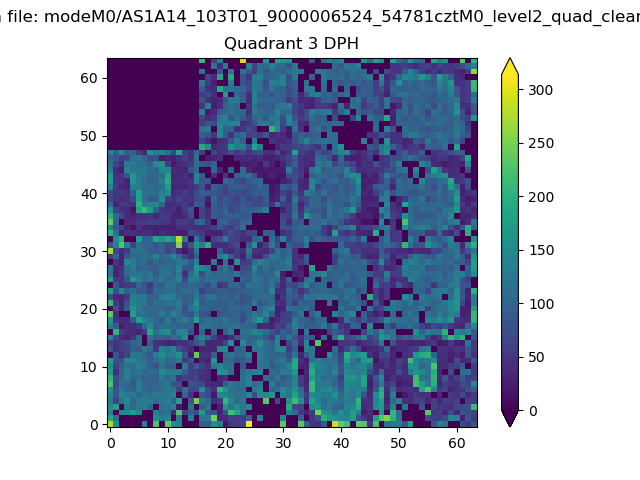 |
 |
Quadrant C |
| Plot type | Count rate plots | Images |
|---|---|---|
| Comparison with Poisson distribution Blue bars denote a histogram of data divided into 1 sec bins. Red curve is a Poisson curve with rate = median count rate of data. |
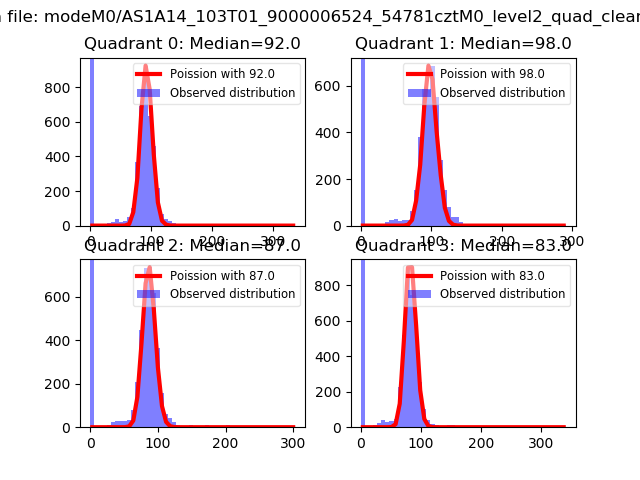 |
 |
| Quadrant-wise count rates Data is divided into 100 sec bins |
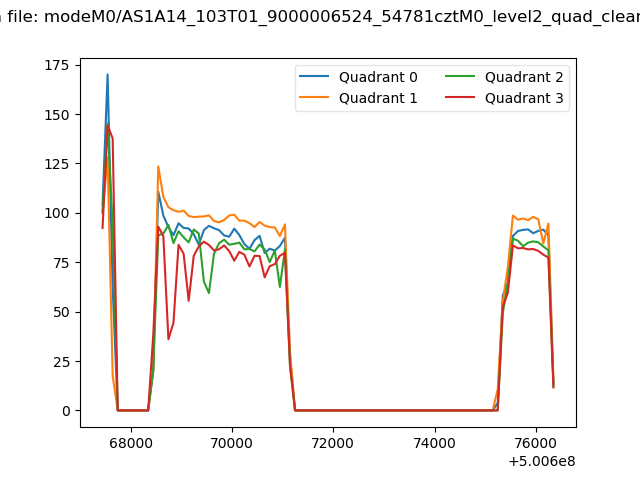 |
|
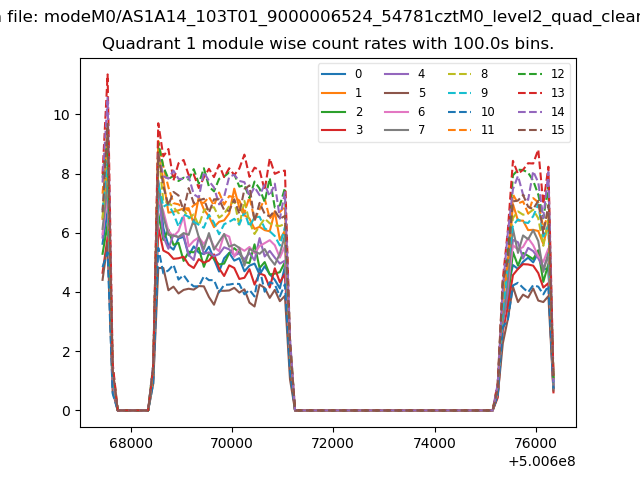
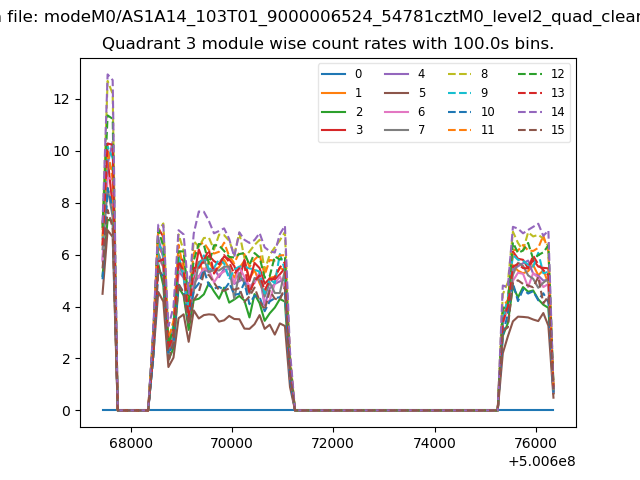
| Module-wise count rates for Quadrant A Data is divided into 100 sec bins |
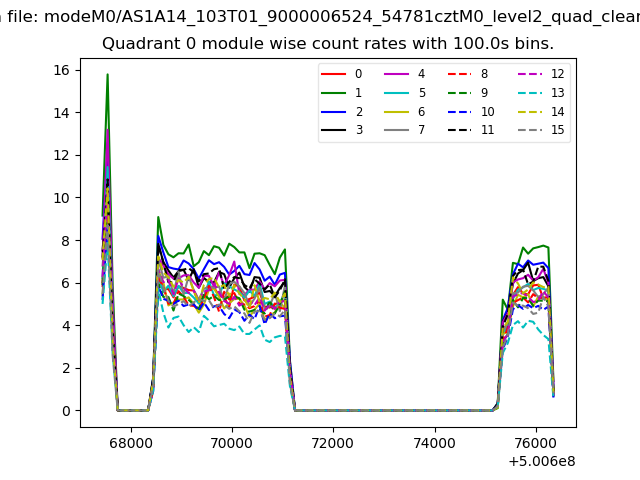 |
 |
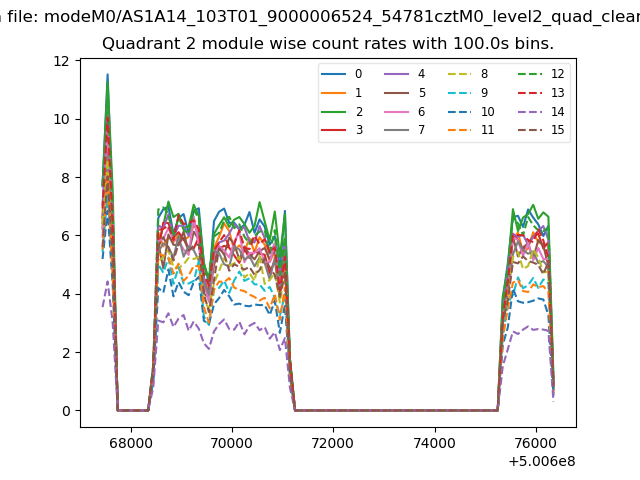
| Module-wise count rates for Quadrant B Data is divided into 100 sec bins |
 |
 |
| Module-wise count rates for Quadrant C Data is divided into 100 sec bins |
 |
 |
| Module-wise count rates for Quadrant D Data is divided into 100 sec bins |
 |
 |
| Parameter | Plot |
|---|---|
| CZT HV Monitor | 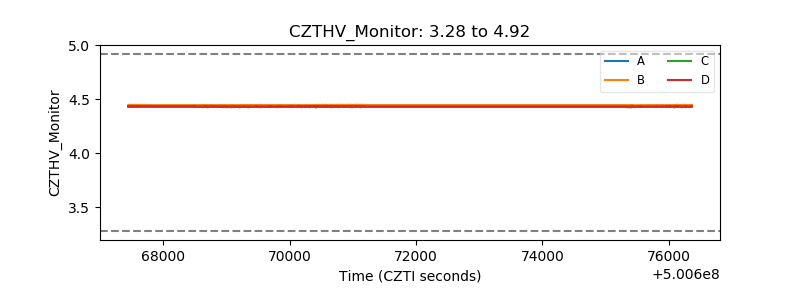 |
| D_VDD | 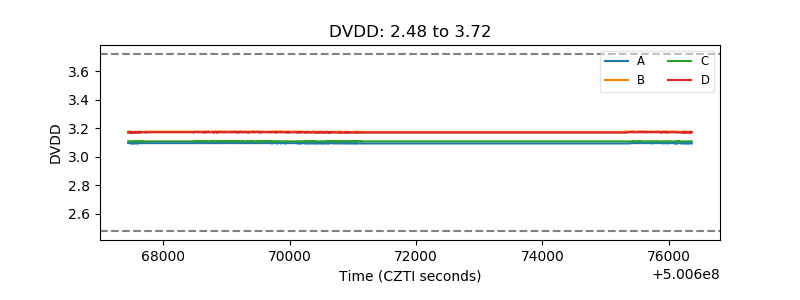 |
| Temperature 1 | 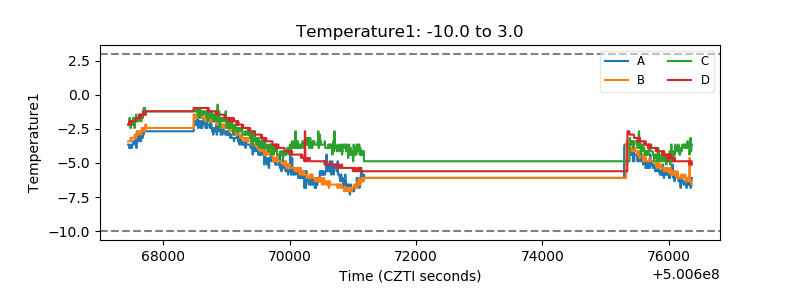 |
| Veto HV Monitor | 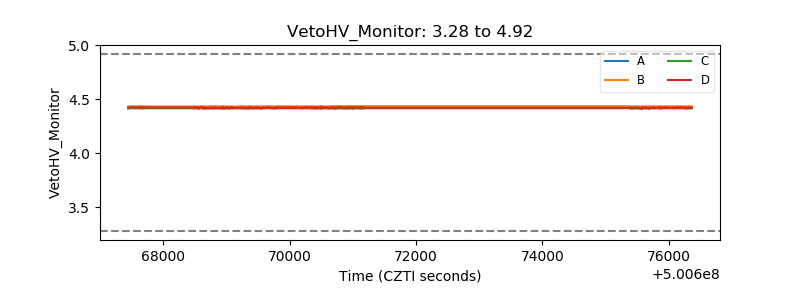 |
| Veto LLD | 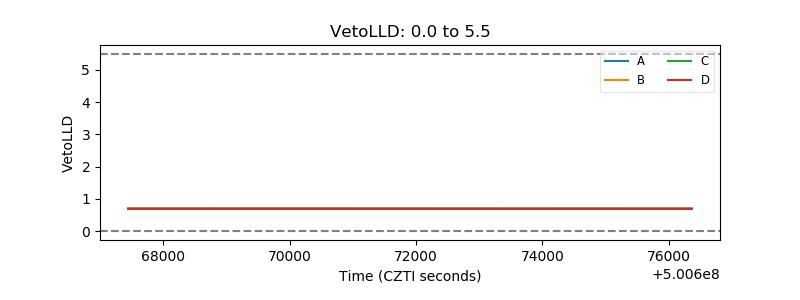 |
| Alpha Counter | 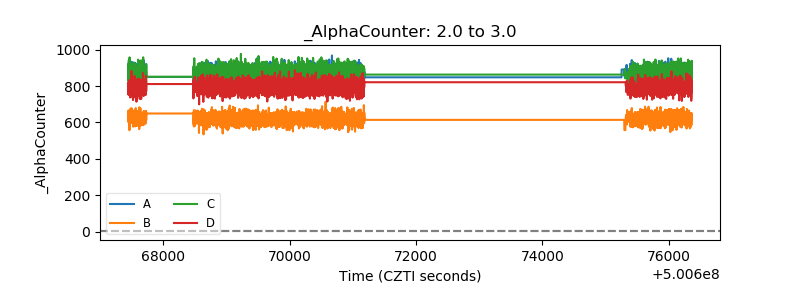 |
| _CPM_Rate | 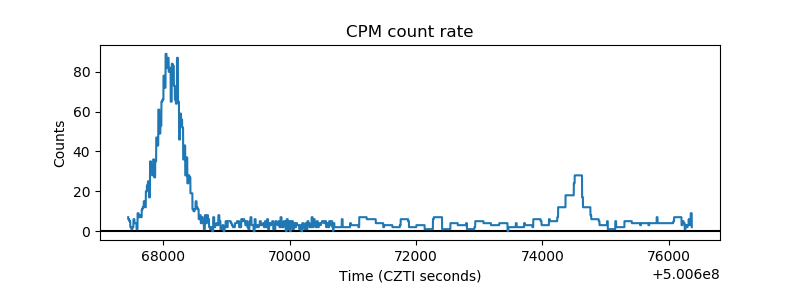 |
| CZT Counter | 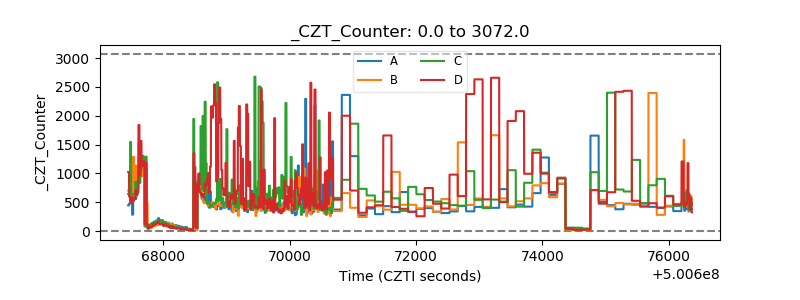 |
| +2.5 Volts monitor |  |
| +5 Volts monitor |  |
| _ROLL_ROT | 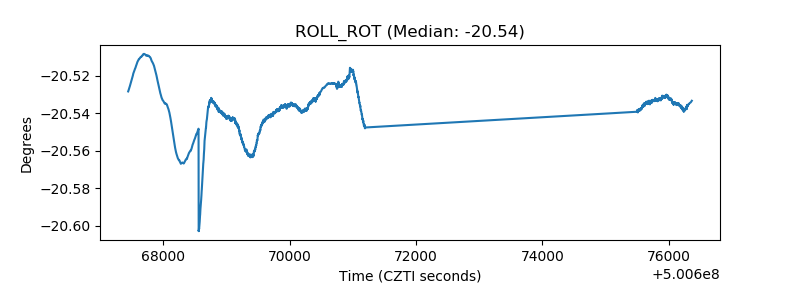 |
| _Roll_DEC | 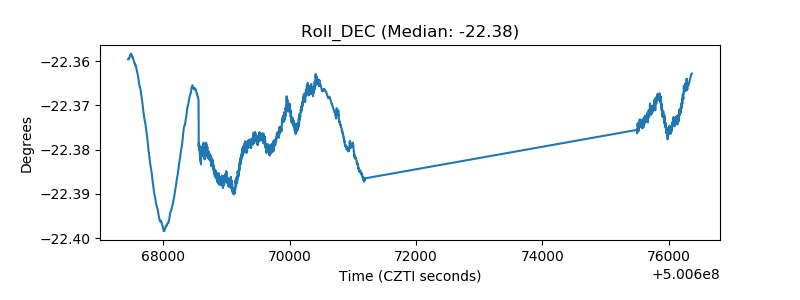 |
| _Roll_RA | 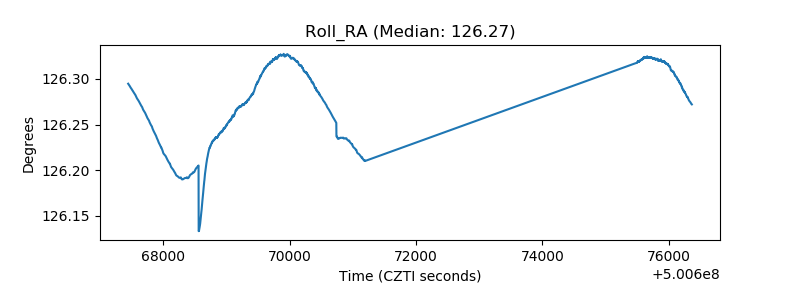 |
| Veto Counter | 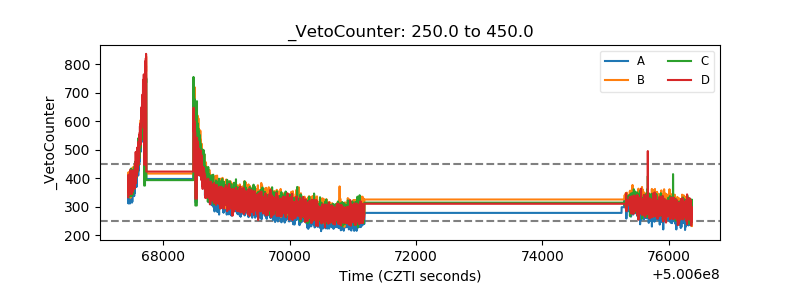 |