| Param | Original file | Final file |
|---|---|---|
| Filename | modeM0/AS1A14_103T01_9000006524_54782cztM0_level2.fits | modeM0/AS1A14_103T01_9000006524_54782cztM0_level2_quad_clean.evt |
| Size (bytes) | 664,810,560 | 128,885,760 |
| Size | 634.0 MB | 122.9 MB |
| Events in quadrant A | 4,111,879 | 886,936 |
| Events in quadrant B | 5,283,194 | 914,452 |
| Events in quadrant C | 8,052,668 | 760,174 |
| Events in quadrant D | 6,502,034 | 750,183 |
| Mode SS | |||
|---|---|---|---|
| Quadrant | BADHDUFLAG | Total packets | Discarded packets |
| A | 0 | 174 | 0 |
| B | 0 | 174 | 0 |
| C | 0 | 174 | 0 |
| D | 0 | 174 | 0 |
| Mode M0 | |||
|---|---|---|---|
| Quadrant | BADHDUFLAG | Total packets | Discarded packets |
| A | 0 | 19030 | 3 |
| B | 0 | 21846 | 1 |
| C | 0 | 29861 | 12 |
| D | 0 | 25634 | 11 |
| Mode M9 | |||
|---|---|---|---|
| Quadrant | BADHDUFLAG | Total packets | Discarded packets |
| A | 0 | 3 | 0 |
| B | 0 | 3 | 0 |
| C | 0 | 3 | 0 |
| D | 0 | 3 | 0 |
| Quadrant | Total seconds | Saturated seconds | Saturation percentage |
|---|---|---|---|
| A | 8508 | 177 | 2.080395% |
| B | 8509 | 323 | 3.795981% |
| C | 8506 | 867 | 10.192805% |
| D | 8506 | 675 | 7.935575% |
Noise dominated data is calculated using 1-second bins in cleaned event files. If a bin has >2000 counts, and if more than 50% of those come from <1% of pixels, then it is considered to be noise-dominated and hence unusable.
| Quadrant | # 1 sec bins | Bins with >0 counts | Bins with >2000 counts | High rate bins dominated by noise | Noise dominated (total time) | Noise dominated (detector-on time) | Marked lightcurve |
|---|---|---|---|---|---|---|---|
| A | 8819 | 8512 | 71 | 71 | 0.81% | 0.83% | 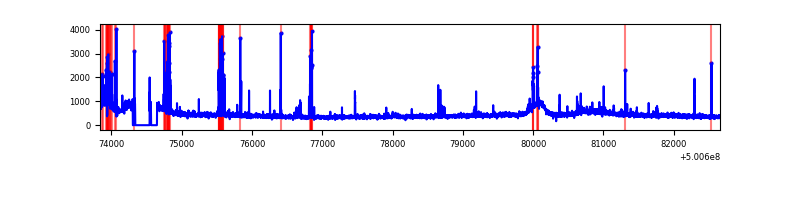 |
| B | 8819 | 8512 | 144 | 144 | 1.63% | 1.69% | 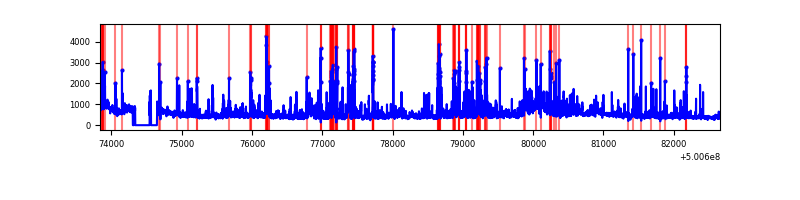 |
| C | 8819 | 8512 | 724 | 724 | 8.21% | 8.51% | 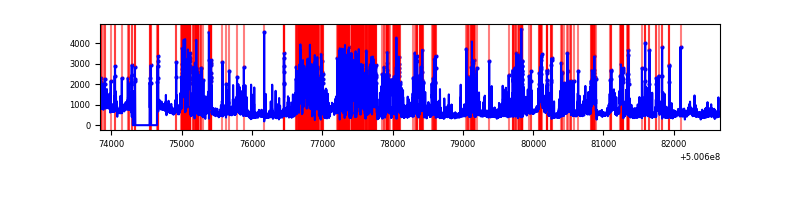 |
| D | 8820 | 8513 | 563 | 563 | 6.38% | 6.61% | 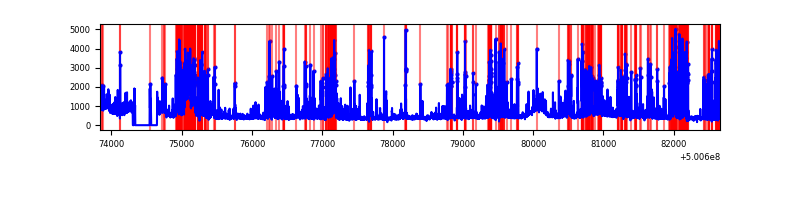 |
Top three noisy pixels from each quadrant. If the there are fewer than three noisy pixels in the level2.evt file, extra rows are filled as -1
| Pixel properties | Quadrant properties | ||||||
|---|---|---|---|---|---|---|---|
| Quadrant | DetID | PixID | Counts | Sigma | Mean | Median | Sigma |
| A | 0 | 8 | 198956 | 828.04 | 936 | 912 | 239.2 |
| A | 13 | 248 | 91885 | 380.37 | 936 | 912 | 239.2 |
| A | 5 | 240 | 51878 | 213.09 | 936 | 912 | 239.2 |
| B | 2 | 249 | 702150 | 3569.63 | 910 | 878 | 196.5 |
| B | 5 | 185 | 559195 | 2841.96 | 910 | 878 | 196.5 |
| B | 4 | 171 | 203751 | 1032.67 | 910 | 878 | 196.5 |
| C | 9 | 38 | 2831645 | 11731.08 | 865 | 859 | 241.3 |
| C | 13 | 3 | 870588 | 3604.25 | 865 | 859 | 241.3 |
| C | 14 | 254 | 551789 | 2283.11 | 865 | 859 | 241.3 |
| D | 15 | 94 | 950613 | 3725.3 | 879 | 837 | 255.0 |
| D | 15 | 170 | 655427 | 2567.5 | 879 | 837 | 255.0 |
| D | 14 | 52 | 368968 | 1443.92 | 879 | 837 | 255.0 |
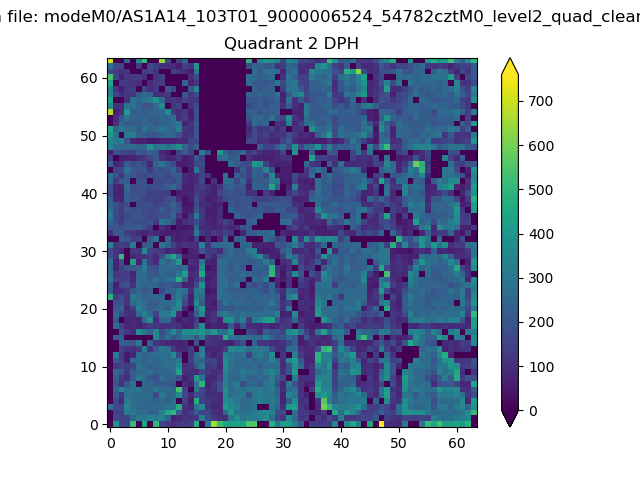
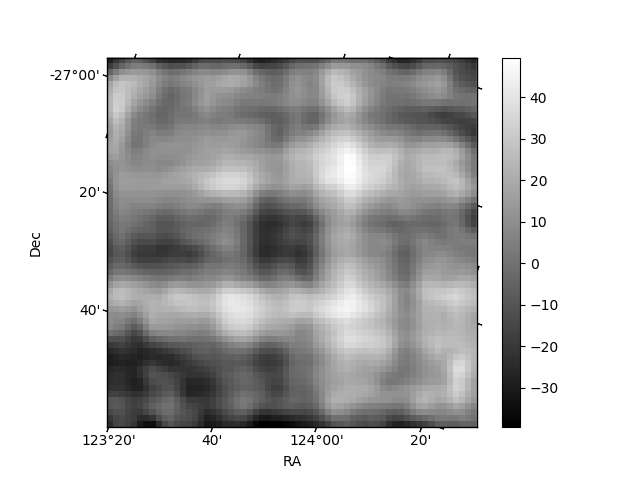
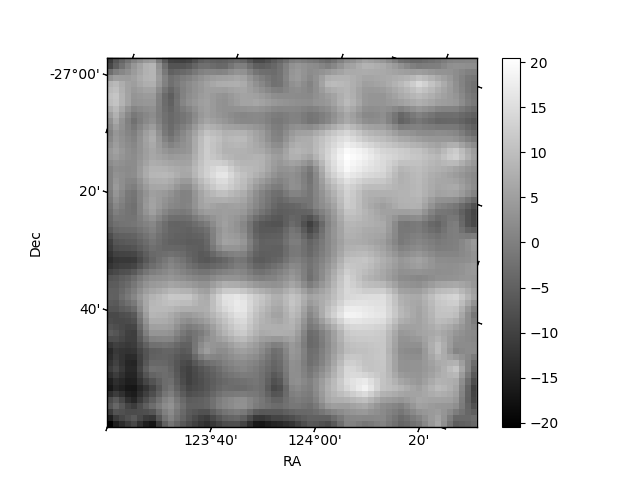
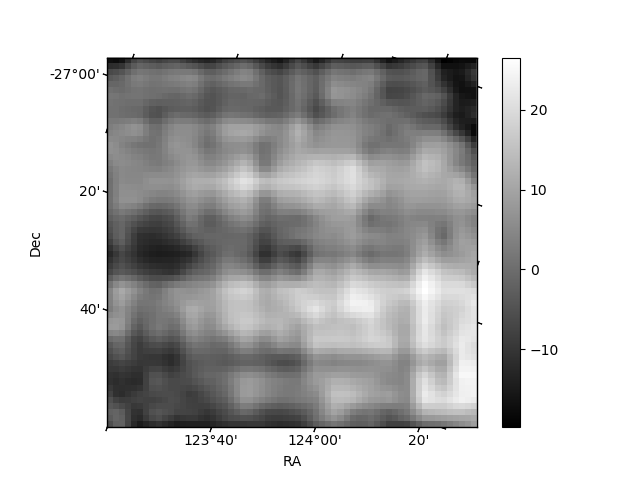
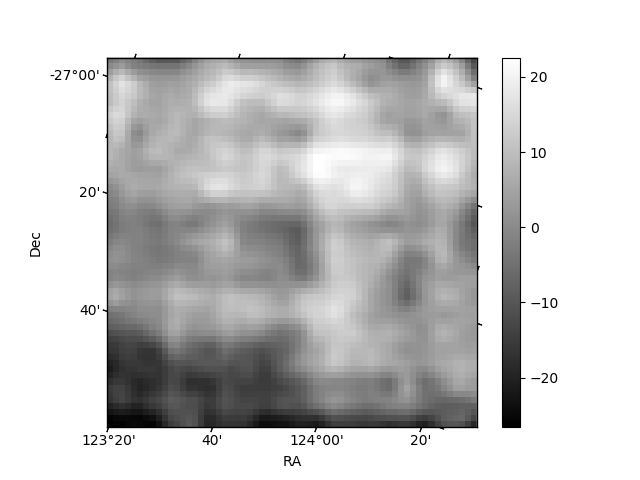
Histogram calculated using DETX and DETY for each event in the final _common_clean file
| Quadrant A | 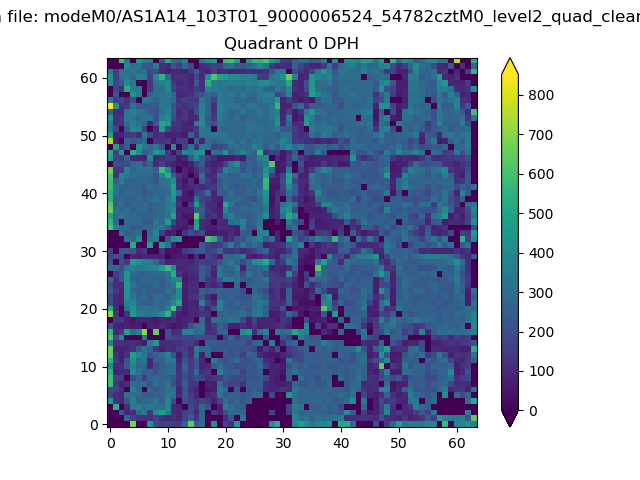 |
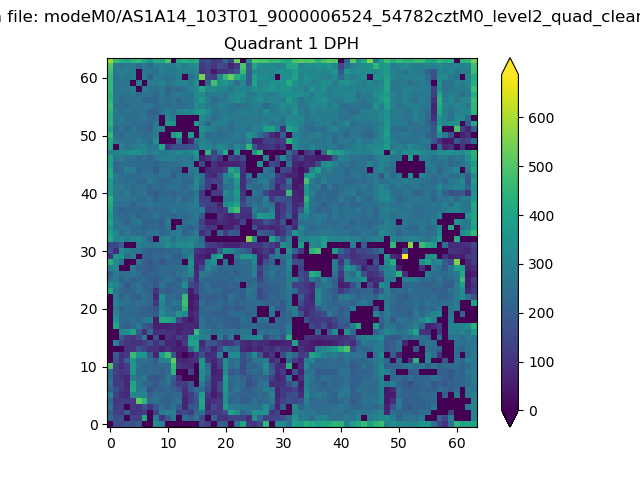 |
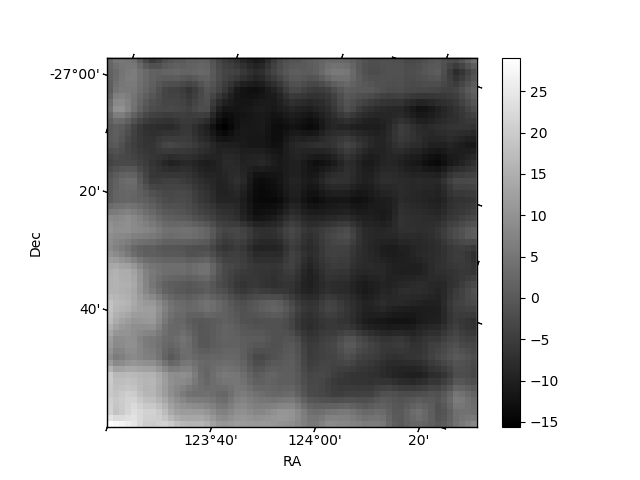
Quadrant B |
|---|---|---|---|
| Quadrant D | 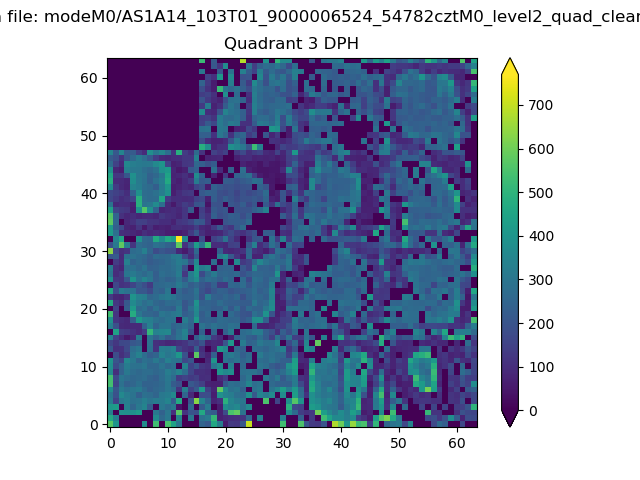 |
 |
Quadrant C |
| Plot type | Count rate plots | Images |
|---|---|---|
| Comparison with Poisson distribution Blue bars denote a histogram of data divided into 1 sec bins. Red curve is a Poisson curve with rate = median count rate of data. |
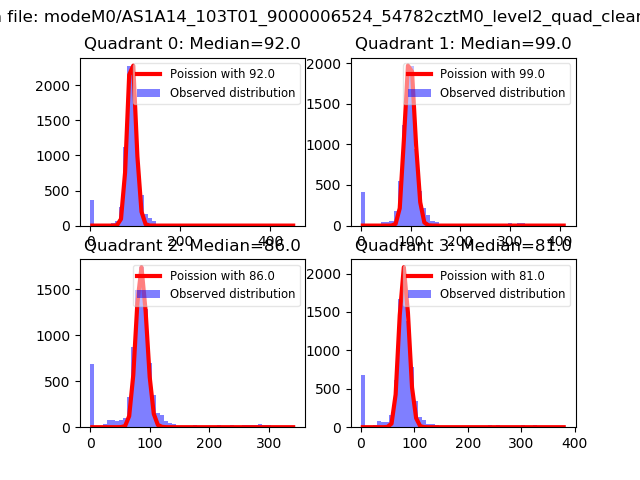 |
 |
| Quadrant-wise count rates Data is divided into 100 sec bins |
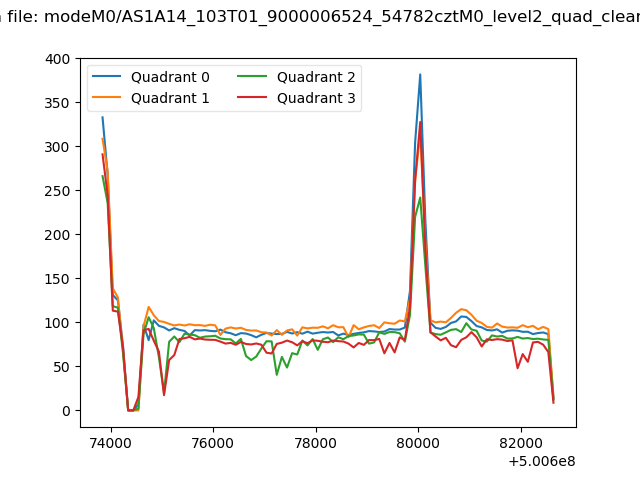 |
|
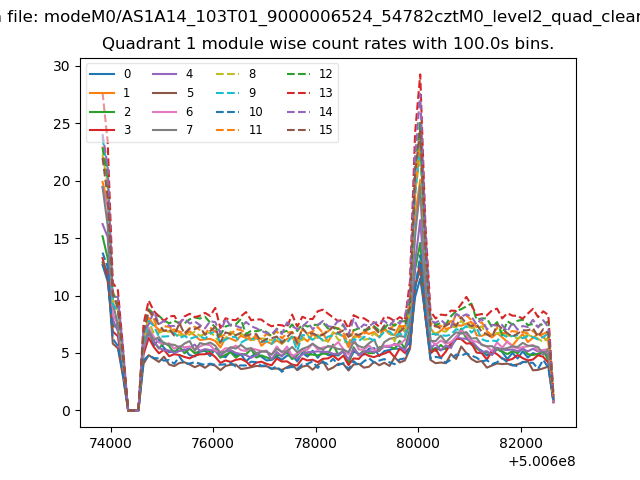
| Module-wise count rates for Quadrant A Data is divided into 100 sec bins |
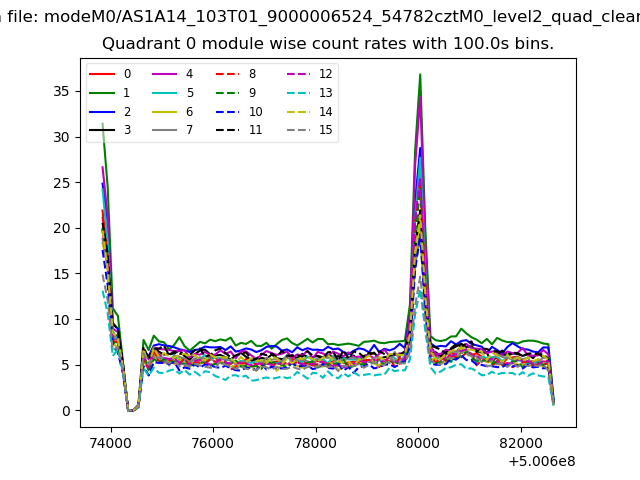 |
 |
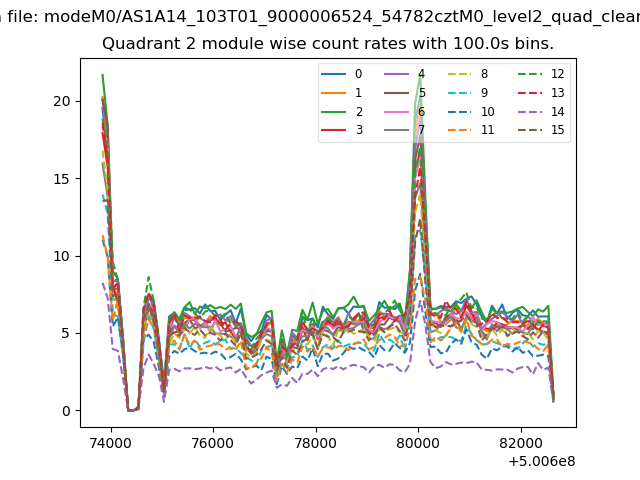
| Module-wise count rates for Quadrant B Data is divided into 100 sec bins |
 |
 |
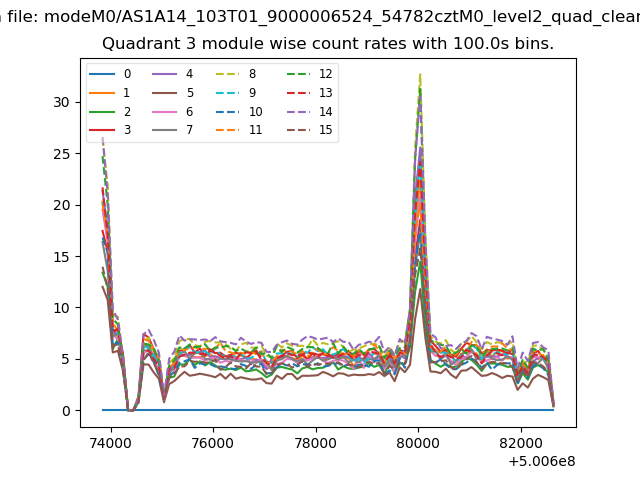
| Module-wise count rates for Quadrant C Data is divided into 100 sec bins |
 |
 |
| Module-wise count rates for Quadrant D Data is divided into 100 sec bins |
 |
 |
| Parameter | Plot |
|---|---|
| CZT HV Monitor | 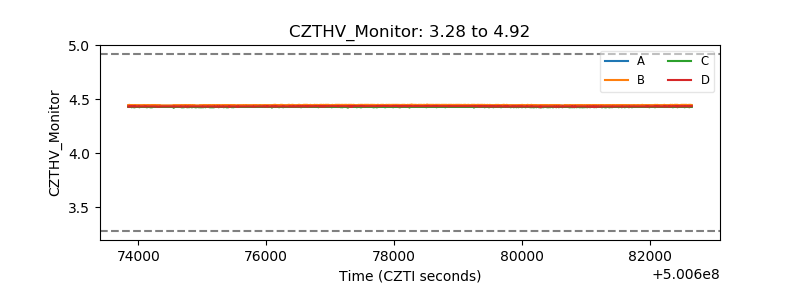 |
| D_VDD | 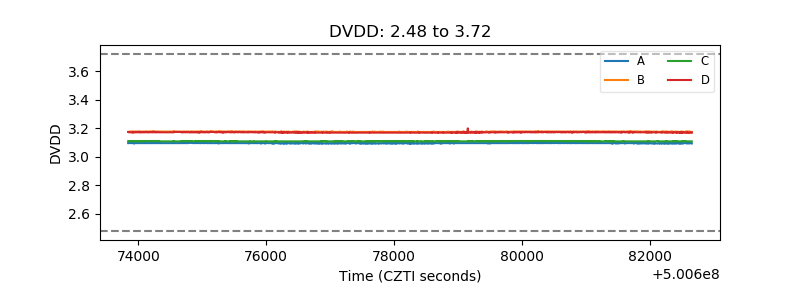 |
| Temperature 1 | 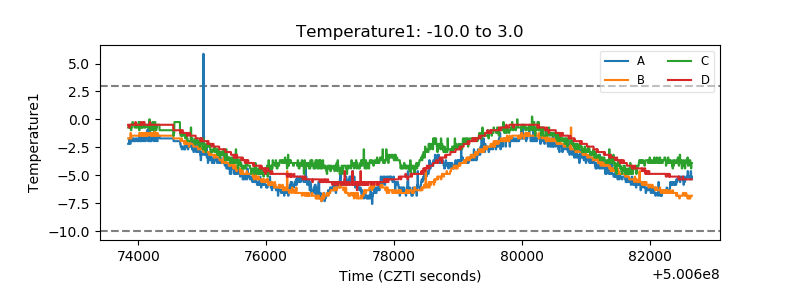 |
| Veto HV Monitor | 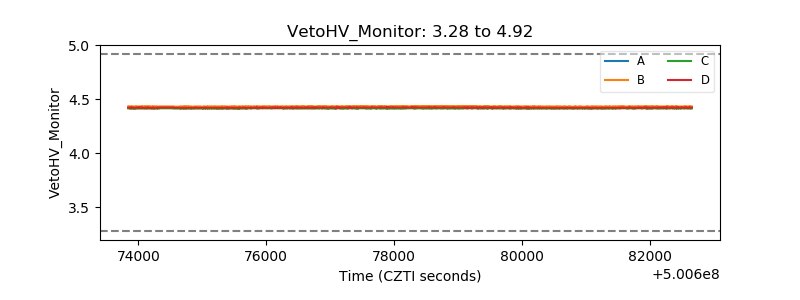 |
| Veto LLD | 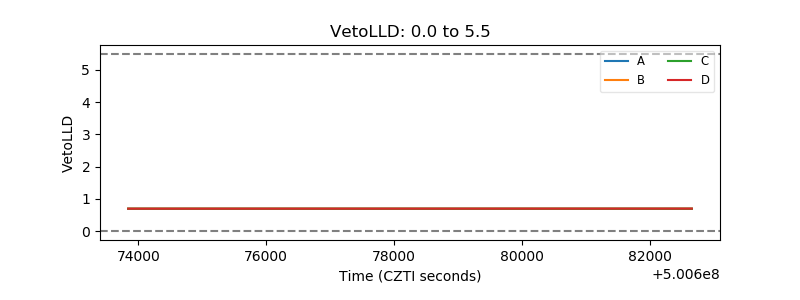 |
| Alpha Counter | 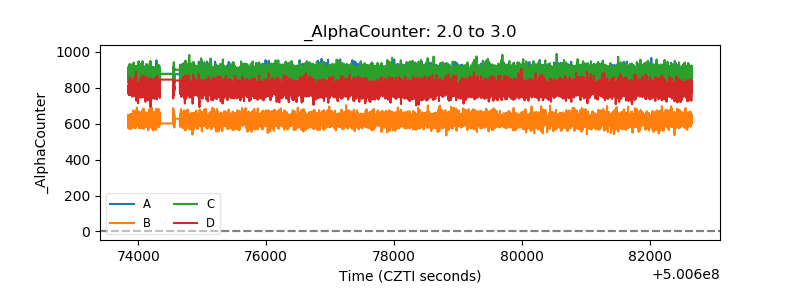 |
| _CPM_Rate | 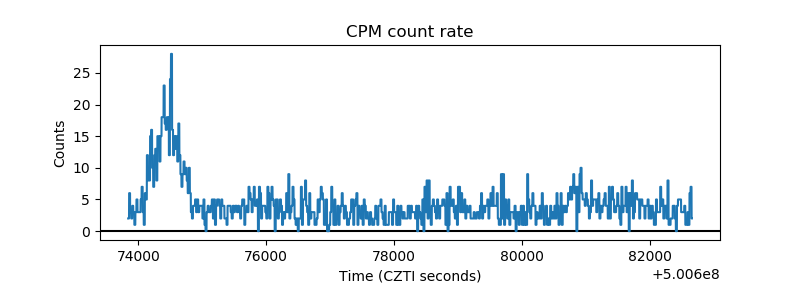 |
| CZT Counter | 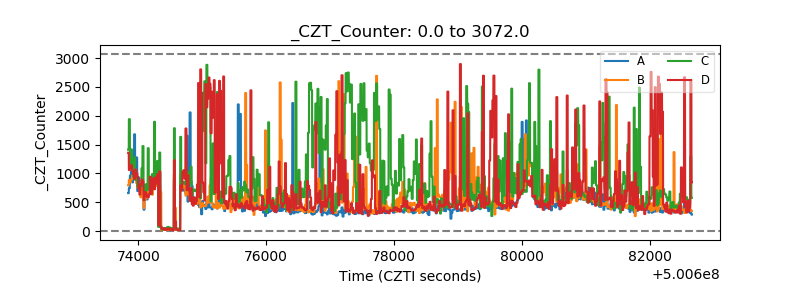 |
| +2.5 Volts monitor |  |
| +5 Volts monitor |  |
| _ROLL_ROT | 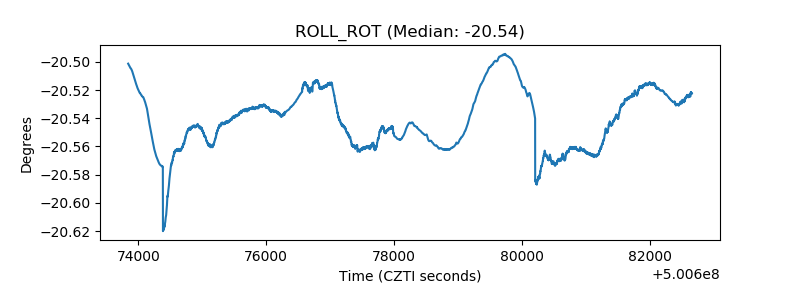 |
| _Roll_DEC | 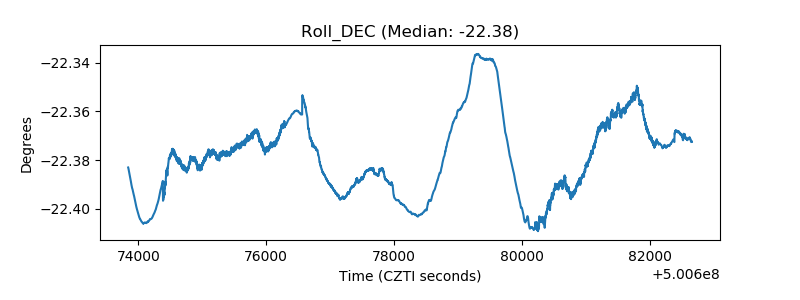 |
| _Roll_RA | 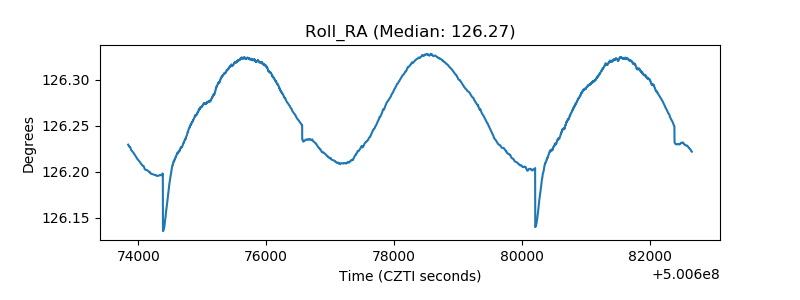 |
| Veto Counter | 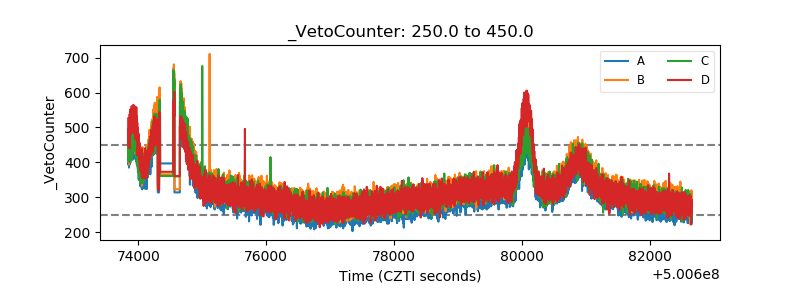 |