| Param | Original file | Final file |
|---|---|---|
| Filename | modeM0/AS1A14_103T01_9000006524_54788cztM0_level2.fits | modeM0/AS1A14_103T01_9000006524_54788cztM0_level2_quad_clean.evt |
| Size (bytes) | 2,281,858,560 | 384,318,720 |
| Size | 2.1 GB | 366.5 MB |
| Events in quadrant A | 13,372,551 | 2,752,066 |
| Events in quadrant B | 17,764,309 | 2,748,677 |
| Events in quadrant C | 31,070,339 | 1,953,995 |
| Events in quadrant D | 20,114,617 | 2,273,917 |
| Mode SS | |||
|---|---|---|---|
| Quadrant | BADHDUFLAG | Total packets | Discarded packets |
| A | 0 | 560 | 0 |
| B | 0 | 560 | 0 |
| C | 0 | 560 | 0 |
| D | 0 | 560 | 0 |
| Mode M0 | |||
|---|---|---|---|
| Quadrant | BADHDUFLAG | Total packets | Discarded packets |
| A | 0 | 62536 | 18 |
| B | 0 | 73787 | 69 |
| C | 0 | 111878 | 78 |
| D | 0 | 81055 | 83 |
| Mode M9 | |||
|---|---|---|---|
| Quadrant | BADHDUFLAG | Total packets | Discarded packets |
| A | 0 | 8 | 0 |
| B | 0 | 8 | 0 |
| C | 0 | 8 | 0 |
| D | 0 | 8 | 0 |
| Quadrant | Total seconds | Saturated seconds | Saturation percentage |
|---|---|---|---|
| A | 27748 | 543 | 1.956898% |
| B | 27745 | 1703 | 6.138043% |
| C | 27740 | 6974 | 25.140591% |
| D | 27739 | 2330 | 8.399726% |
Noise dominated data is calculated using 1-second bins in cleaned event files. If a bin has >2000 counts, and if more than 50% of those come from <1% of pixels, then it is considered to be noise-dominated and hence unusable.
| Quadrant | # 1 sec bins | Bins with >0 counts | Bins with >2000 counts | High rate bins dominated by noise | Noise dominated (total time) | Noise dominated (detector-on time) | Marked lightcurve |
|---|---|---|---|---|---|---|---|
| A | 28476 | 27758 | 352 | 352 | 1.24% | 1.27% | 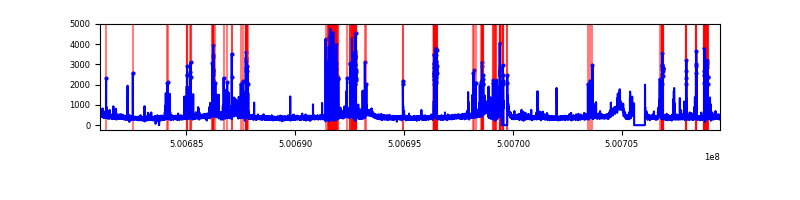 |
| B | 28476 | 27756 | 1306 | 1306 | 4.59% | 4.71% | 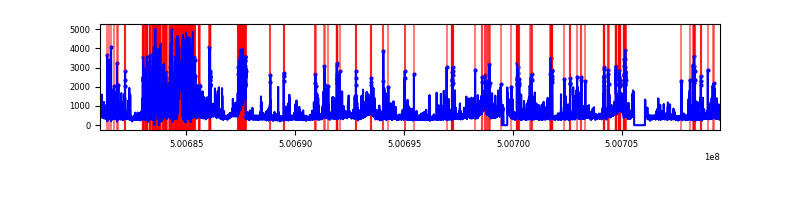 |
| C | 28476 | 27757 | 3700 | 3700 | 12.99% | 13.33% | 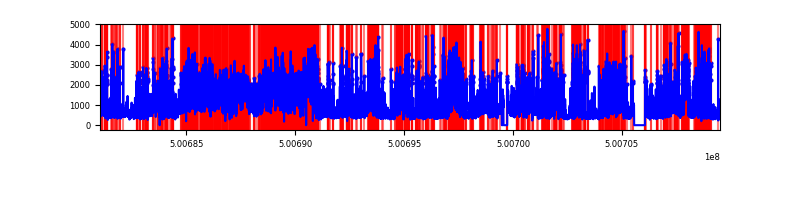 |
| D | 28476 | 27755 | 2054 | 2054 | 7.21% | 7.40% | 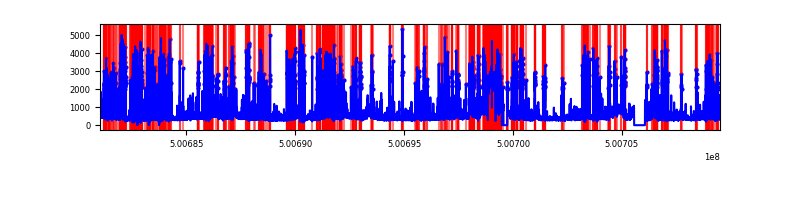 |
Top three noisy pixels from each quadrant. If the there are fewer than three noisy pixels in the level2.evt file, extra rows are filled as -1
| Pixel properties | Quadrant properties | ||||||
|---|---|---|---|---|---|---|---|
| Quadrant | DetID | PixID | Counts | Sigma | Mean | Median | Sigma |
| A | 13 | 248 | 870316 | 1183.45 | 2875 | 2811 | 733.0 |
| A | 0 | 8 | 854057 | 1161.27 | 2875 | 2811 | 733.0 |
| A | 0 | 117 | 124098 | 165.46 | 2875 | 2811 | 733.0 |
| B | 2 | 249 | 5051897 | 8495.96 | 2741 | 2640 | 594.3 |
| B | 5 | 185 | 979055 | 1642.93 | 2741 | 2640 | 594.3 |
| B | 4 | 81 | 559397 | 936.81 | 2741 | 2640 | 594.3 |
| C | 9 | 38 | 10299928 | 15400.29 | 2413 | 2397 | 668.7 |
| C | 15 | 148 | 8090650 | 12096.25 | 2413 | 2397 | 668.7 |
| C | 14 | 254 | 960534 | 1432.93 | 2413 | 2397 | 668.7 |
| D | 15 | 94 | 3452761 | 4495.74 | 2670 | 2558 | 767.4 |
| D | 3 | 12 | 3108235 | 4046.81 | 2670 | 2558 | 767.4 |
| D | 3 | 224 | 691018 | 897.09 | 2670 | 2558 | 767.4 |
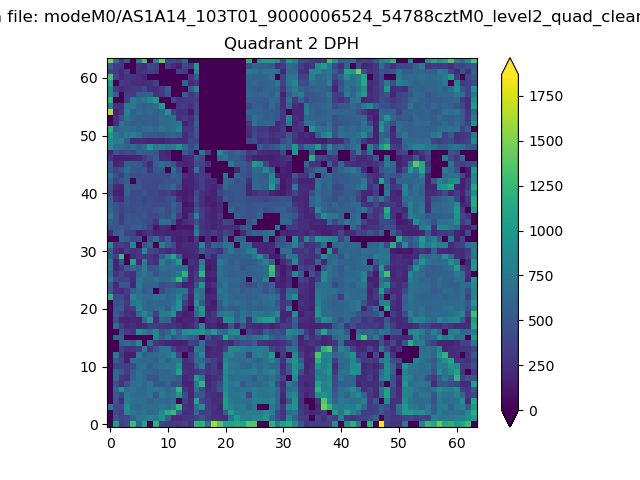
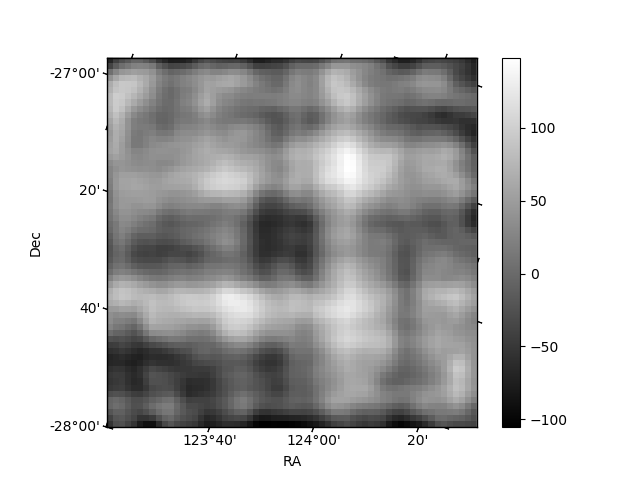
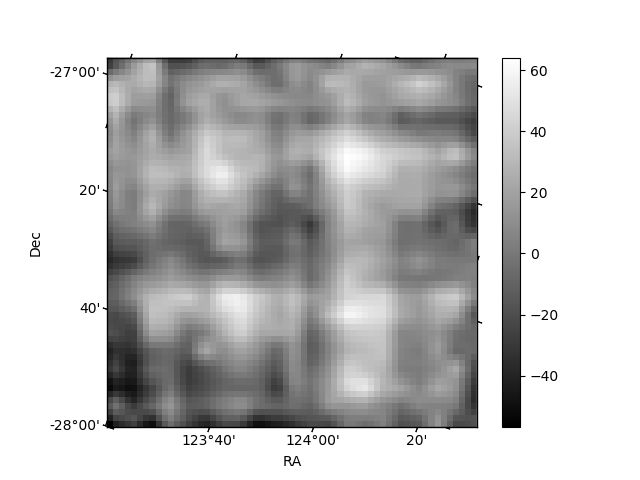
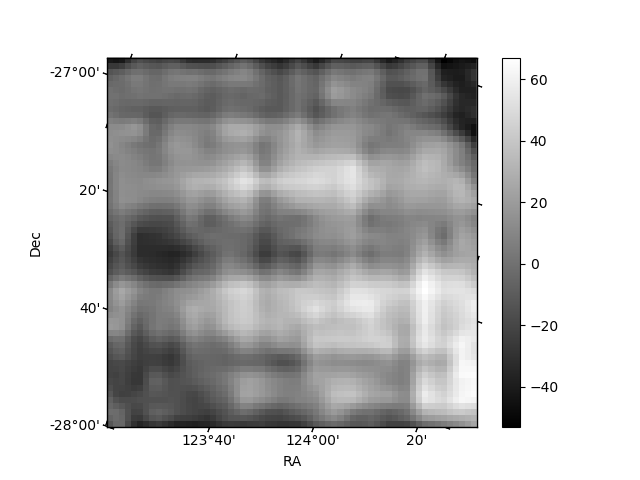
Histogram calculated using DETX and DETY for each event in the final _common_clean file
| Quadrant A | 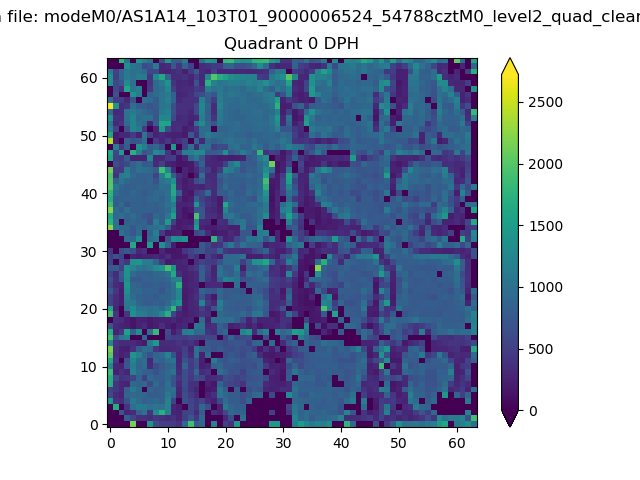 |
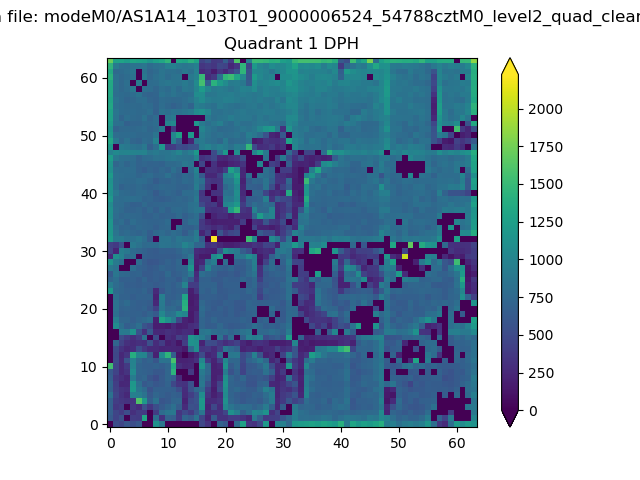 |
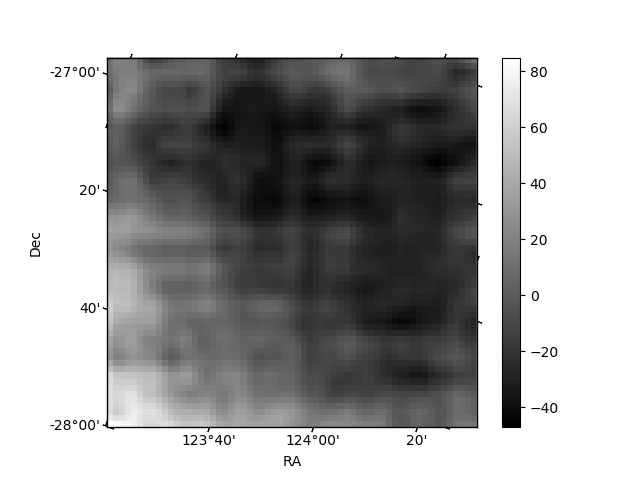
Quadrant B |
|---|---|---|---|
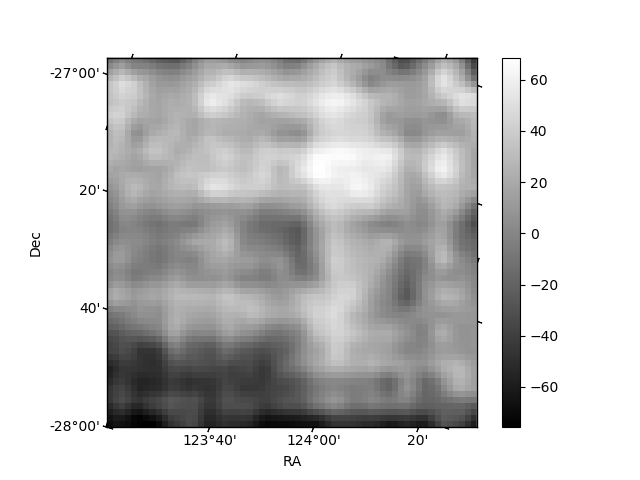
| Quadrant D | 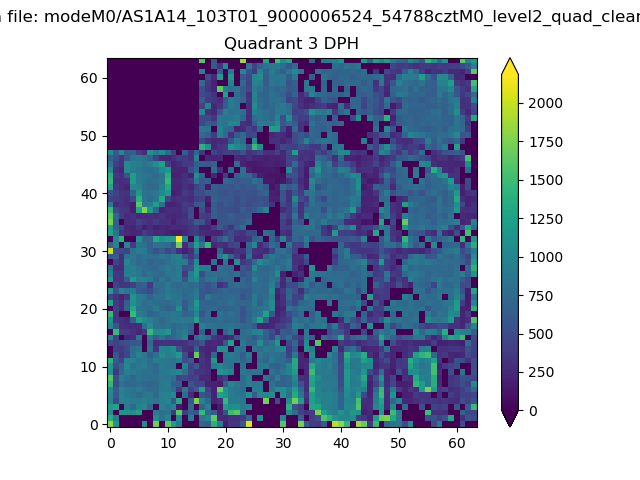 |
 |
Quadrant C |
| Plot type | Count rate plots | Images |
|---|---|---|
| Comparison with Poisson distribution Blue bars denote a histogram of data divided into 1 sec bins. Red curve is a Poisson curve with rate = median count rate of data. |
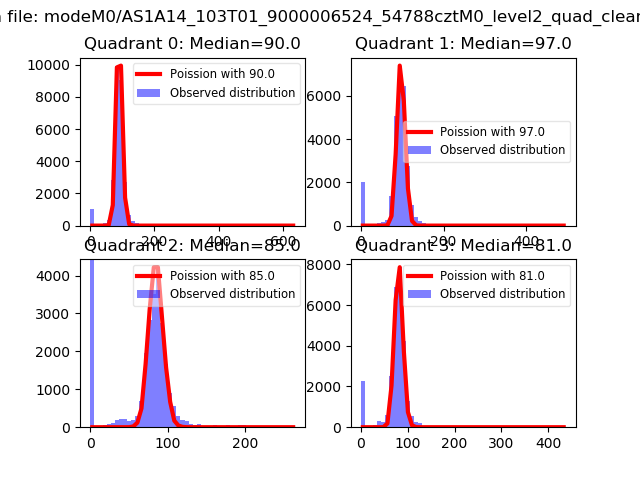 |
 |
| Quadrant-wise count rates Data is divided into 100 sec bins |
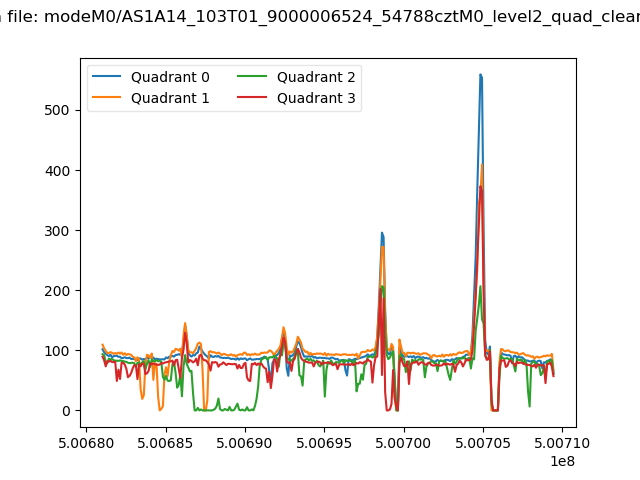 |
|
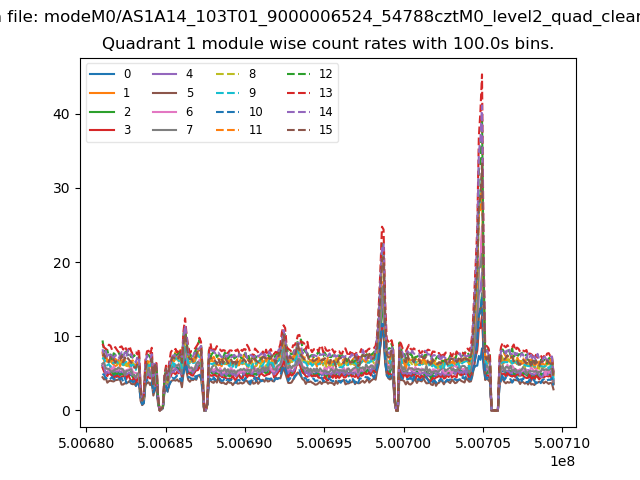
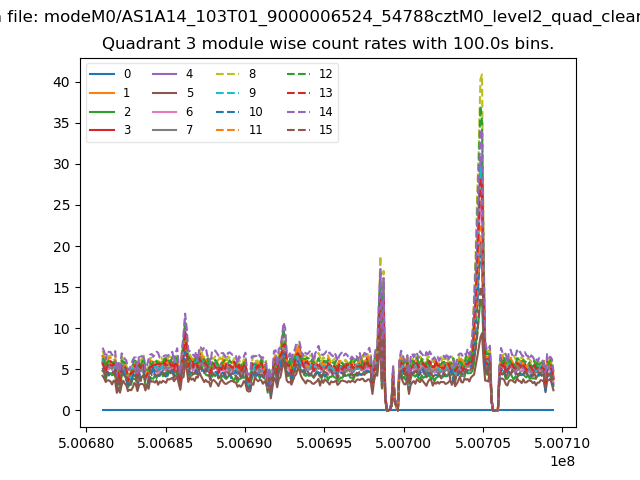
| Module-wise count rates for Quadrant A Data is divided into 100 sec bins |
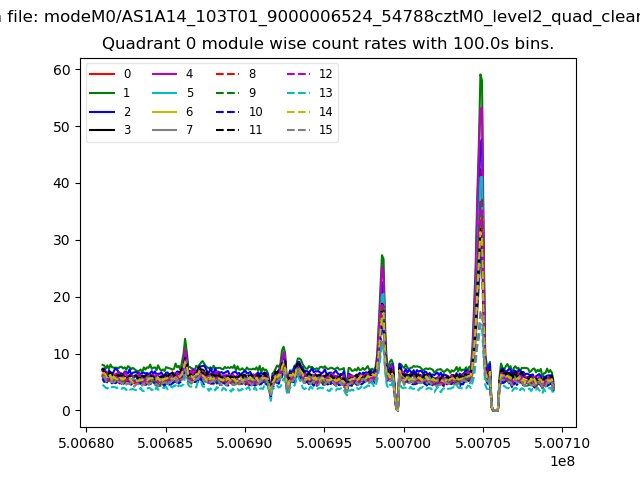 |
 |
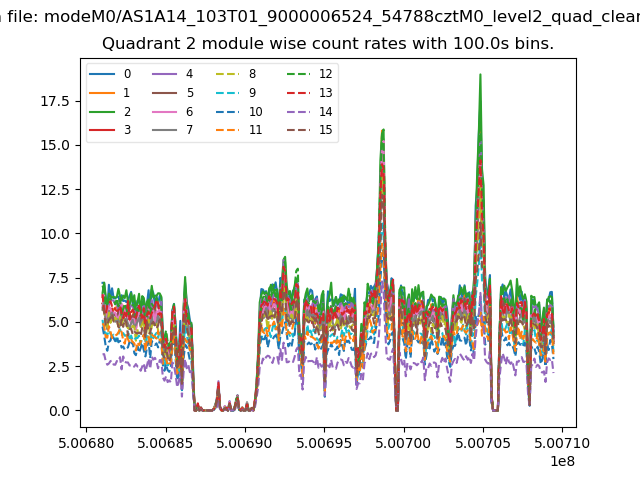
| Module-wise count rates for Quadrant B Data is divided into 100 sec bins |
 |
 |
| Module-wise count rates for Quadrant C Data is divided into 100 sec bins |
 |
 |
| Module-wise count rates for Quadrant D Data is divided into 100 sec bins |
 |
 |
| Parameter | Plot |
|---|---|
| CZT HV Monitor | 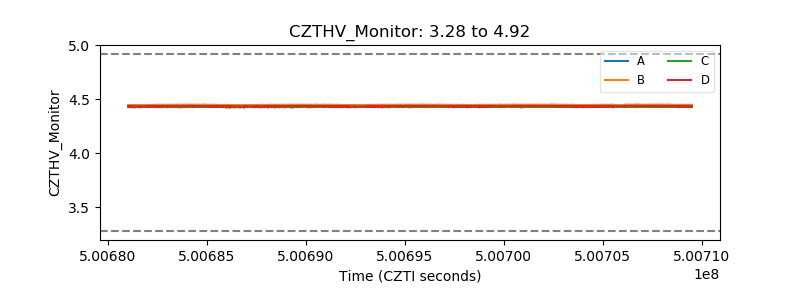 |
| D_VDD | 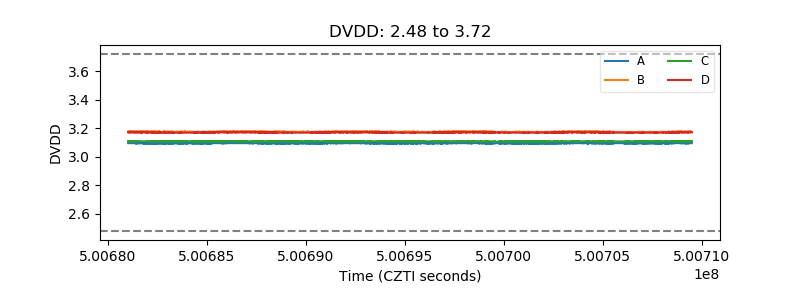 |
| Temperature 1 | 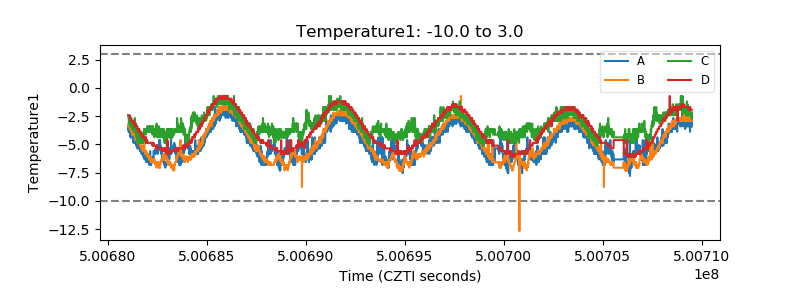 |
| Veto HV Monitor | 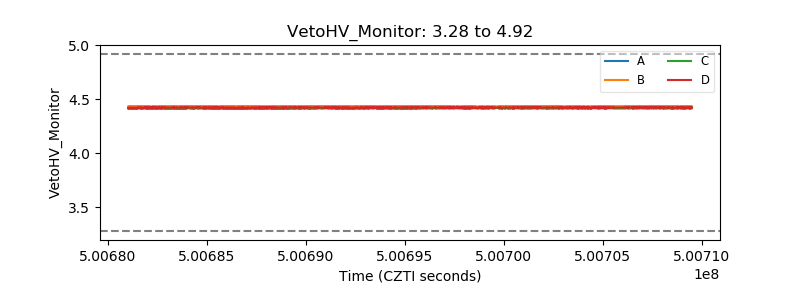 |
| Veto LLD | 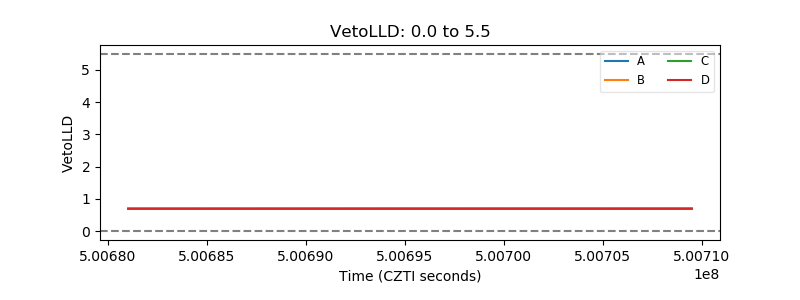 |
| Alpha Counter | 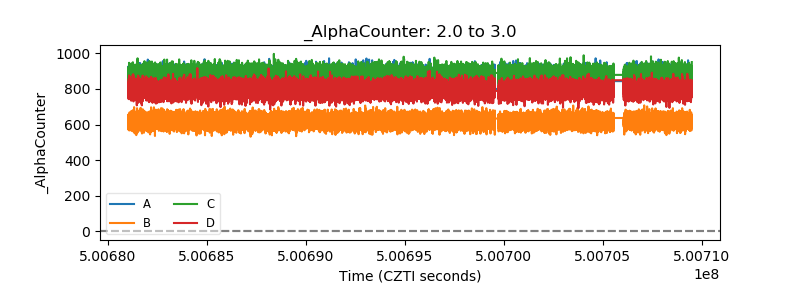 |
| _CPM_Rate | 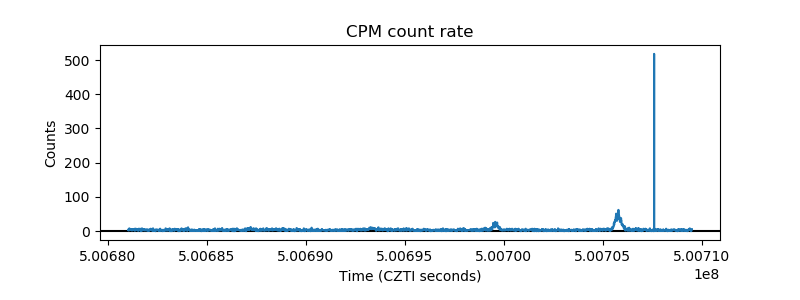 |
| CZT Counter | 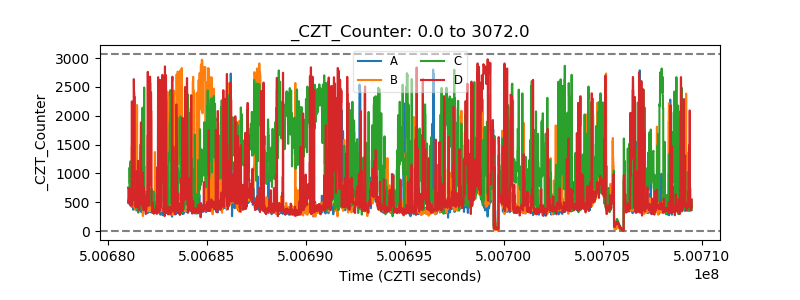 |
| +2.5 Volts monitor |  |
| +5 Volts monitor |  |
| _ROLL_ROT | 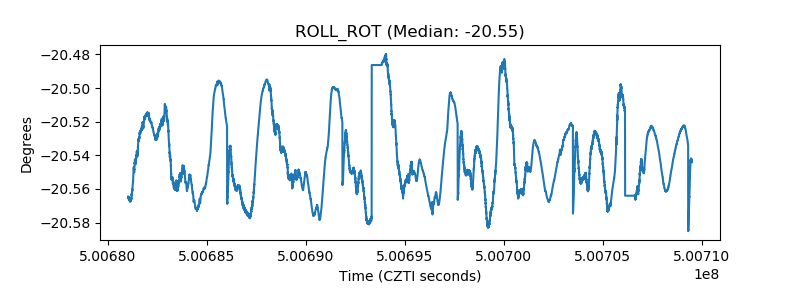 |
| _Roll_DEC | 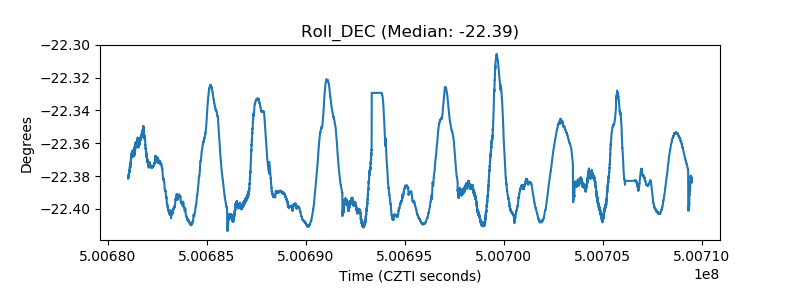 |
| _Roll_RA | 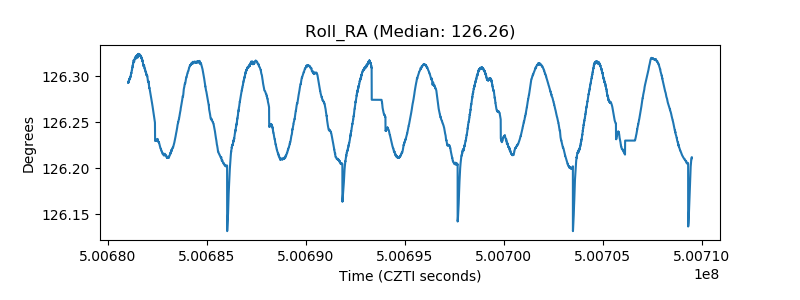 |
| Veto Counter | 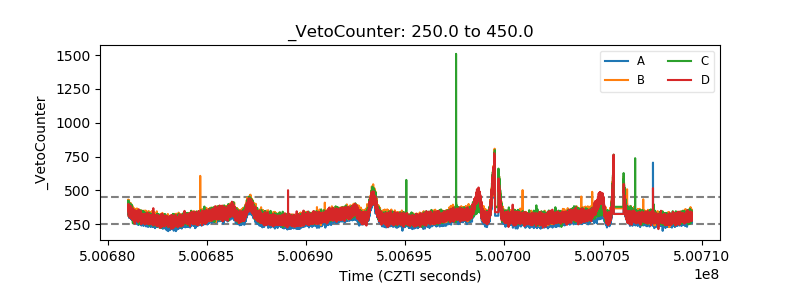 |