| Param | Original file | Final file |
|---|---|---|
| Filename | modeM0/AS1A14_103T01_9000006524_54791cztM0_level2.fits | modeM0/AS1A14_103T01_9000006524_54791cztM0_level2_quad_clean.evt |
| Size (bytes) | 1,631,030,400 | 380,620,800 |
| Size | 1.5 GB | 363.0 MB |
| Events in quadrant A | 11,643,255 | 2,688,865 |
| Events in quadrant B | 12,138,775 | 2,710,957 |
| Events in quadrant C | 21,345,429 | 2,179,212 |
| Events in quadrant D | 13,446,841 | 2,345,194 |
| Mode SS | |||
|---|---|---|---|
| Quadrant | BADHDUFLAG | Total packets | Discarded packets |
| A | 0 | 472 | 0 |
| B | 0 | 472 | 0 |
| C | 0 | 472 | 0 |
| D | 0 | 472 | 0 |
| Mode M0 | |||
|---|---|---|---|
| Quadrant | BADHDUFLAG | Total packets | Discarded packets |
| A | 0 | 52775 | 8 |
| B | 0 | 53719 | 9 |
| C | 0 | 79851 | 10 |
| D | 0 | 57644 | 23 |
| Mode M9 | |||
|---|---|---|---|
| Quadrant | BADHDUFLAG | Total packets | Discarded packets |
| A | 0 | 43 | 0 |
| B | 0 | 43 | 0 |
| C | 0 | 43 | 0 |
| D | 0 | 43 | 0 |
| Quadrant | Total seconds | Saturated seconds | Saturation percentage |
|---|---|---|---|
| A | 23287 | 577 | 2.477777% |
| B | 23288 | 532 | 2.284438% |
| C | 23289 | 2538 | 10.897849% |
| D | 23283 | 738 | 3.169695% |
Noise dominated data is calculated using 1-second bins in cleaned event files. If a bin has >2000 counts, and if more than 50% of those come from <1% of pixels, then it is considered to be noise-dominated and hence unusable.
| Quadrant | # 1 sec bins | Bins with >0 counts | Bins with >2000 counts | High rate bins dominated by noise | Noise dominated (total time) | Noise dominated (detector-on time) | Marked lightcurve |
|---|---|---|---|---|---|---|---|
| A | 27419 | 23293 | 203 | 203 | 0.74% | 0.87% | 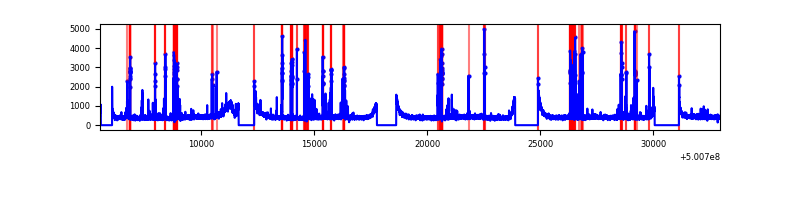 |
| B | 27420 | 23292 | 135 | 135 | 0.49% | 0.58% | 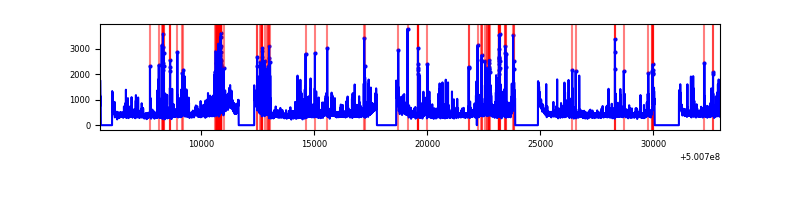 |
| C | 27420 | 23294 | 2130 | 2130 | 7.77% | 9.14% | 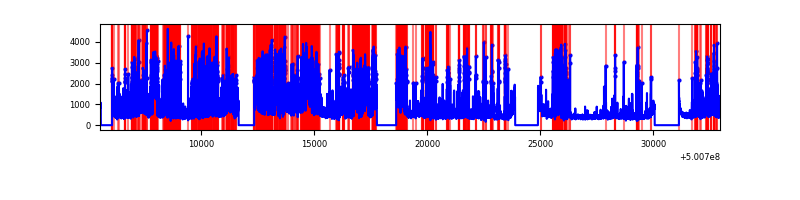 |
| D | 27420 | 23291 | 512 | 512 | 1.87% | 2.20% | 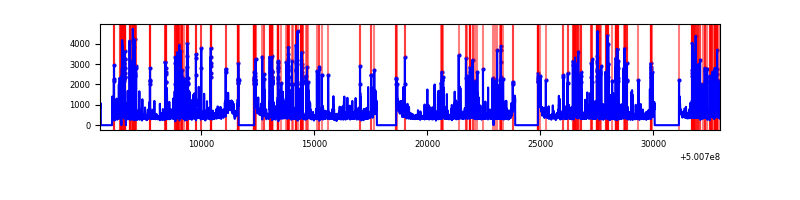 |
Top three noisy pixels from each quadrant. If the there are fewer than three noisy pixels in the level2.evt file, extra rows are filled as -1
| Pixel properties | Quadrant properties | ||||||
|---|---|---|---|---|---|---|---|
| Quadrant | DetID | PixID | Counts | Sigma | Mean | Median | Sigma |
| A | 0 | 8 | 543530 | 791.1 | 2610 | 2548 | 683.8 |
| A | 13 | 248 | 505671 | 735.74 | 2610 | 2548 | 683.8 |
| A | 0 | 117 | 119398 | 170.88 | 2610 | 2548 | 683.8 |
| B | 2 | 249 | 746704 | 1384.68 | 2494 | 2409 | 537.5 |
| B | 5 | 185 | 650081 | 1204.92 | 2494 | 2409 | 537.5 |
| B | 4 | 81 | 254625 | 469.22 | 2494 | 2409 | 537.5 |
| C | 9 | 38 | 8323715 | 12419.35 | 2376 | 2351 | 670.0 |
| C | 13 | 3 | 1772636 | 2642.09 | 2376 | 2351 | 670.0 |
| C | 14 | 254 | 712752 | 1060.25 | 2376 | 2351 | 670.0 |
| D | 15 | 94 | 704214 | 943.72 | 2509 | 2386 | 743.7 |
| D | 3 | 12 | 643542 | 862.14 | 2509 | 2386 | 743.7 |
| D | 3 | 224 | 421816 | 563.99 | 2509 | 2386 | 743.7 |
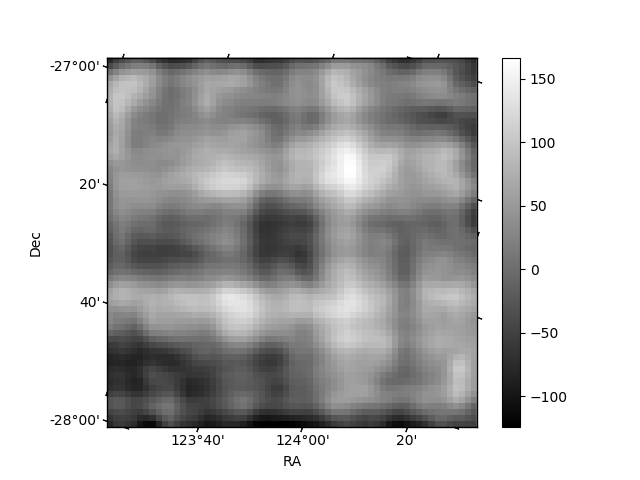
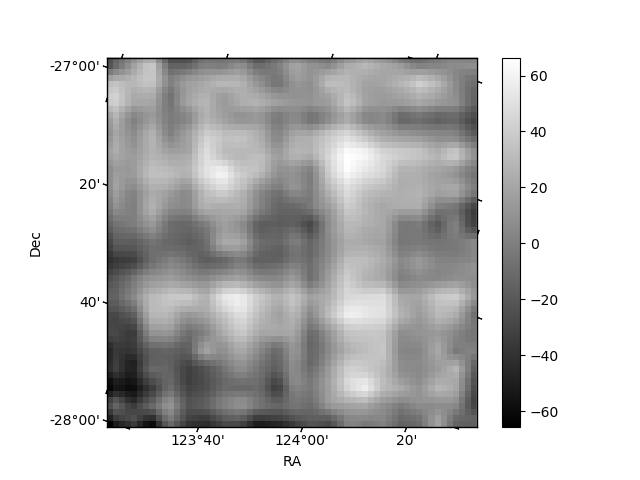
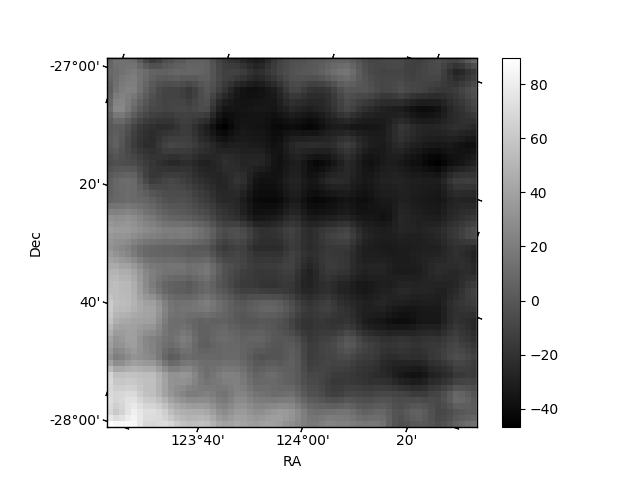
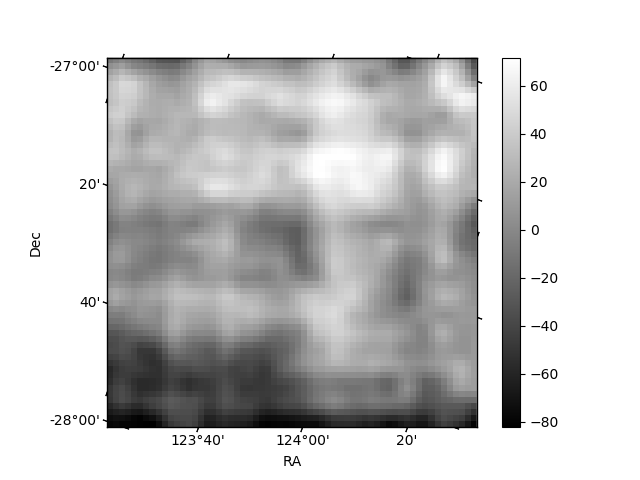
Histogram calculated using DETX and DETY for each event in the final _common_clean file
| Quadrant A | 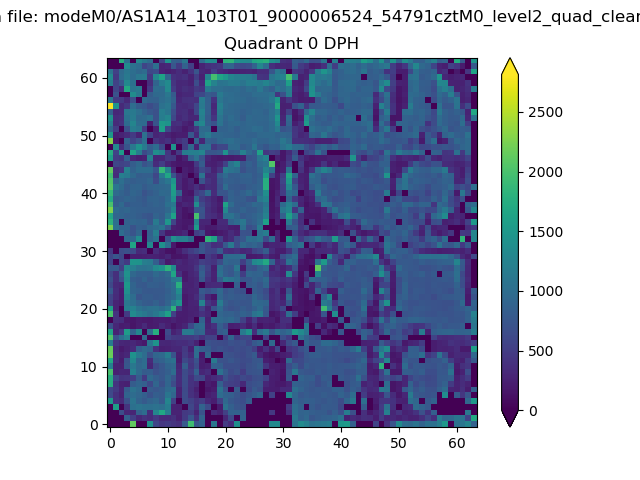 |
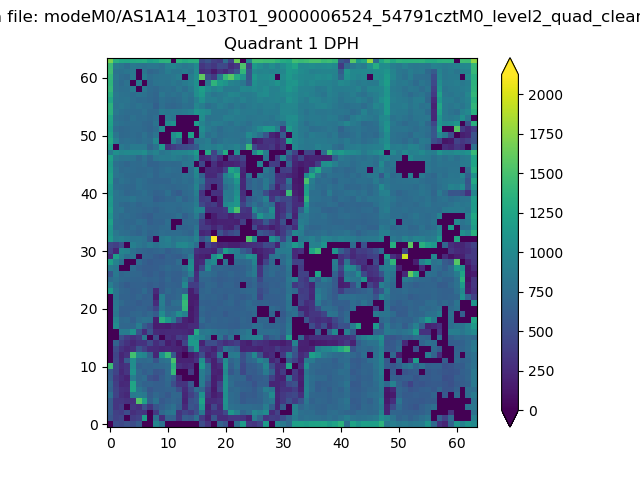 |
Quadrant B |
|---|---|---|---|
| Quadrant D | 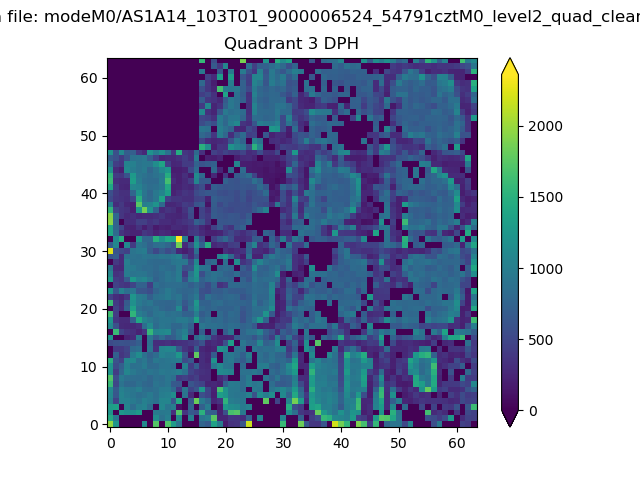 |
 |
Quadrant C |
| Plot type | Count rate plots | Images |
|---|---|---|
| Comparison with Poisson distribution Blue bars denote a histogram of data divided into 1 sec bins. Red curve is a Poisson curve with rate = median count rate of data. |
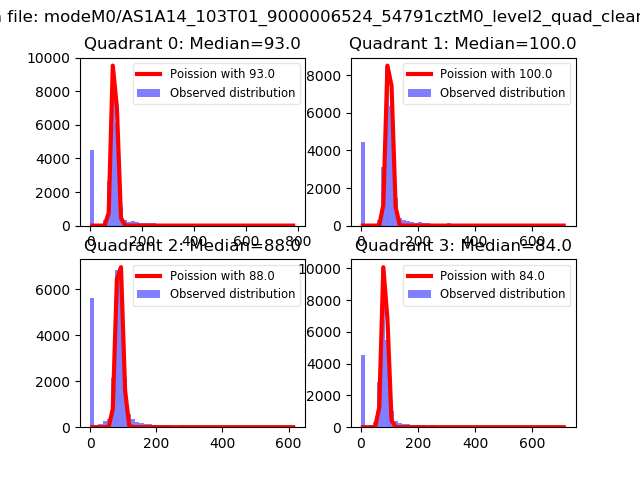 |
 |
| Quadrant-wise count rates Data is divided into 100 sec bins |
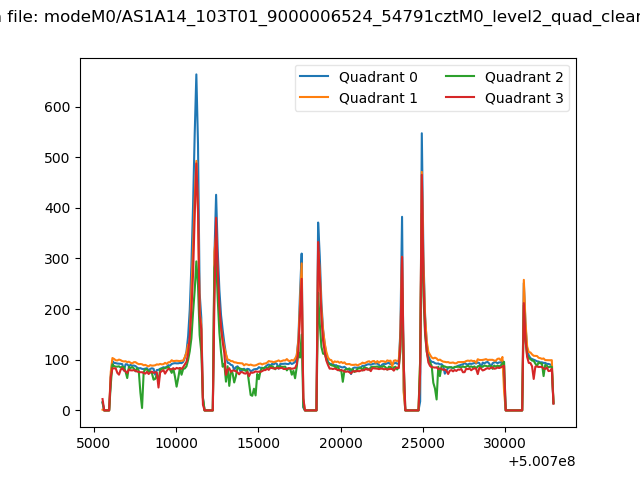 |
|
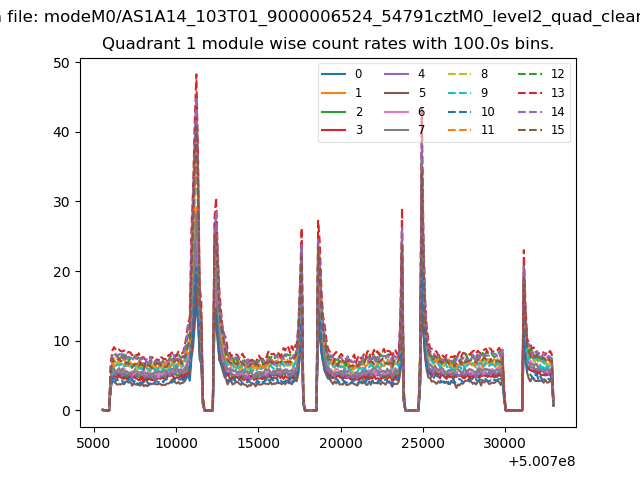
| Module-wise count rates for Quadrant A Data is divided into 100 sec bins |
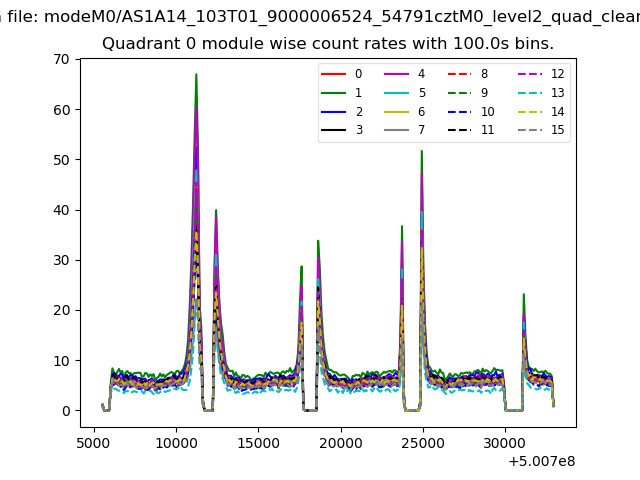 |
 |
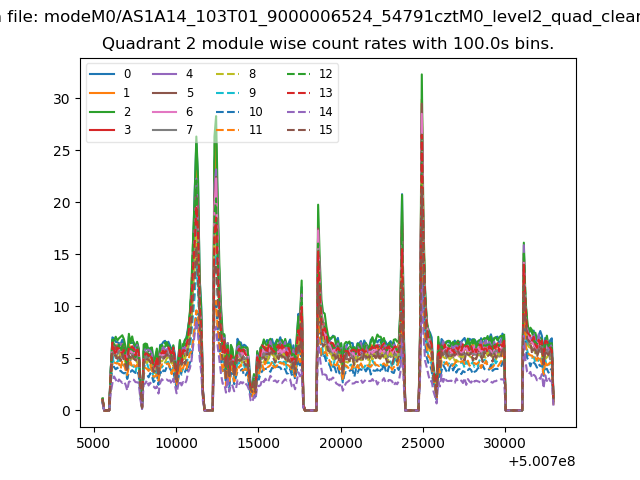
| Module-wise count rates for Quadrant B Data is divided into 100 sec bins |
 |
 |
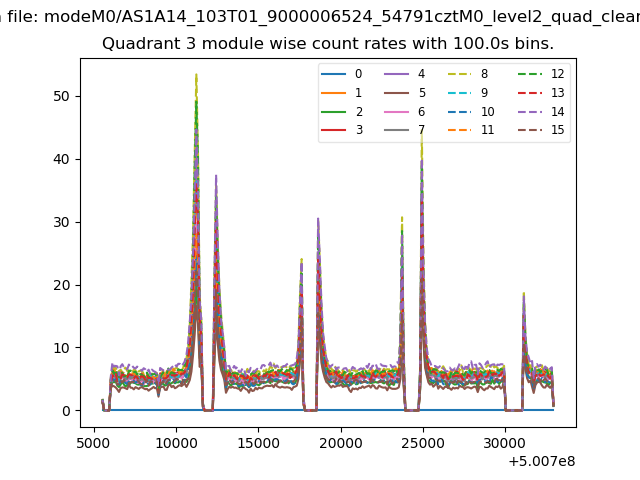
| Module-wise count rates for Quadrant C Data is divided into 100 sec bins |
 |
 |
| Module-wise count rates for Quadrant D Data is divided into 100 sec bins |
 |
 |
| Parameter | Plot |
|---|---|
| CZT HV Monitor | 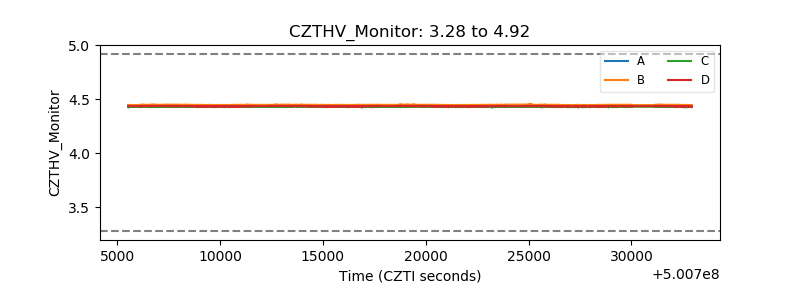 |
| D_VDD | 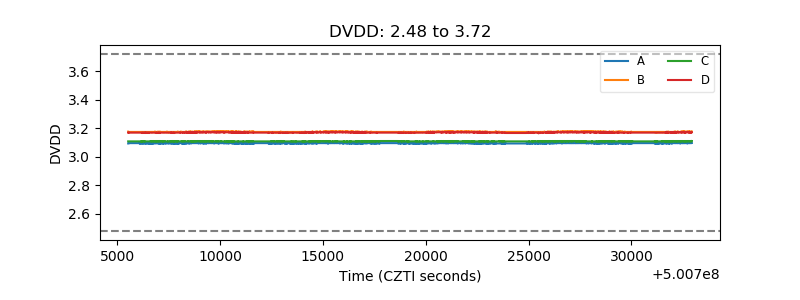 |
| Temperature 1 | 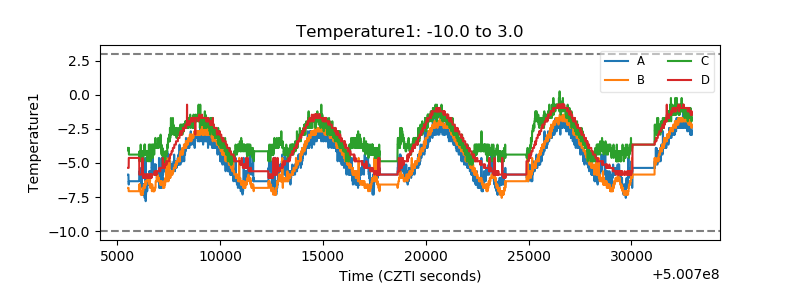 |
| Veto HV Monitor | 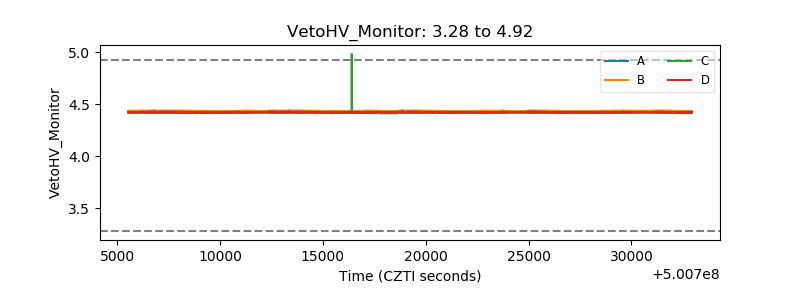 |
| Veto LLD | 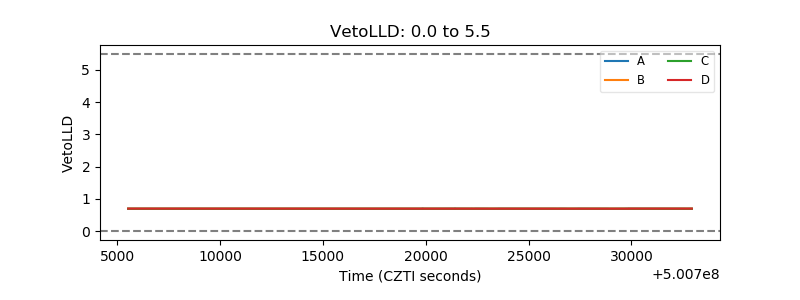 |
| Alpha Counter | 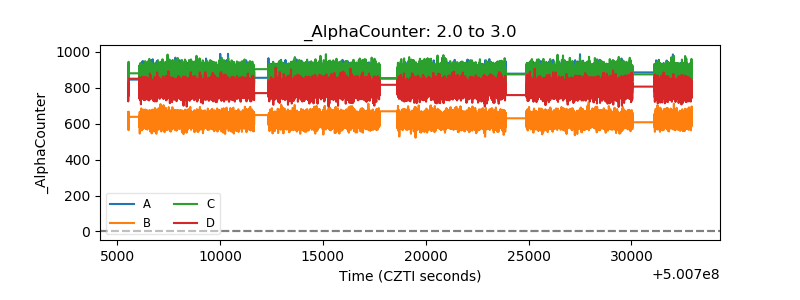 |
| _CPM_Rate | 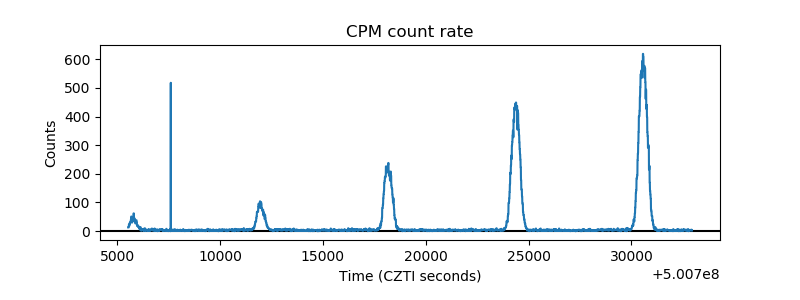 |
| CZT Counter | 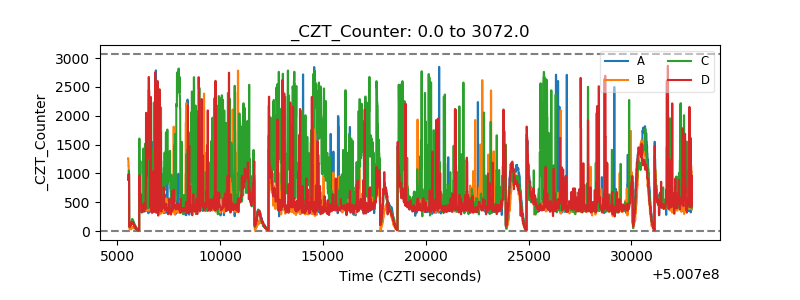 |
| +2.5 Volts monitor |  |
| +5 Volts monitor |  |
| _ROLL_ROT | 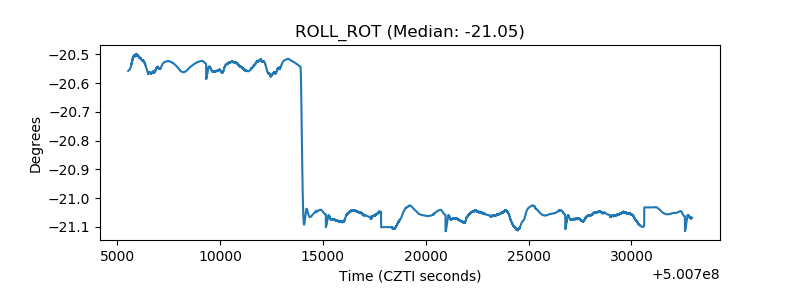 |
| _Roll_DEC | 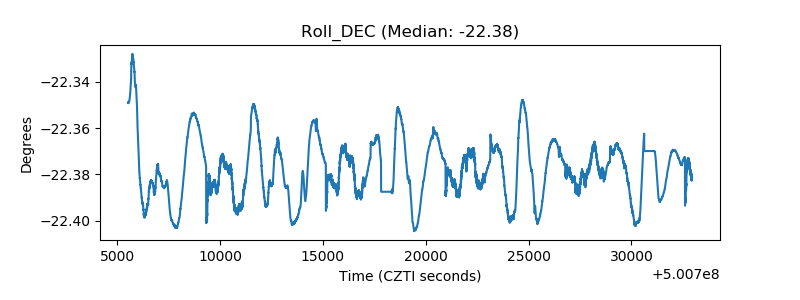 |
| _Roll_RA | 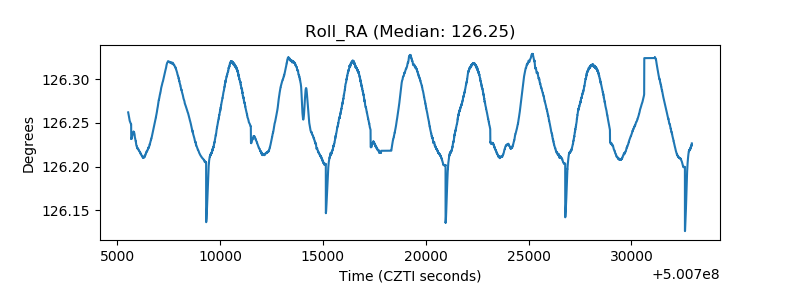 |
| Veto Counter | 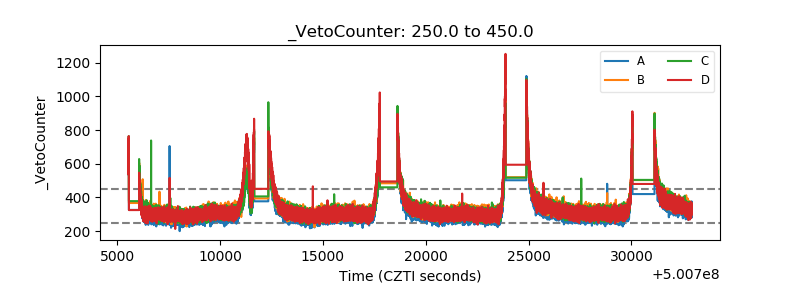 |