| Param | Original file | Final file |
|---|---|---|
| Filename | modeM0/AS1A14_103T01_9000006524_54792cztM0_level2.fits | modeM0/AS1A14_103T01_9000006524_54792cztM0_level2_quad_clean.evt |
| Size (bytes) | 2,168,815,680 | 497,413,440 |
| Size | 2.0 GB | 474.4 MB |
| Events in quadrant A | 14,922,218 | 3,553,581 |
| Events in quadrant B | 16,707,486 | 3,531,596 |
| Events in quadrant C | 28,027,134 | 2,823,472 |
| Events in quadrant D | 18,254,631 | 3,045,936 |
| Mode SS | |||
|---|---|---|---|
| Quadrant | BADHDUFLAG | Total packets | Discarded packets |
| A | 0 | 620 | 0 |
| B | 0 | 620 | 0 |
| C | 0 | 620 | 0 |
| D | 0 | 620 | 0 |
| Mode M0 | |||
|---|---|---|---|
| Quadrant | BADHDUFLAG | Total packets | Discarded packets |
| A | 0 | 68427 | 9 |
| B | 0 | 72616 | 13 |
| C | 0 | 104862 | 30 |
| D | 0 | 77412 | 10 |
| Mode M9 | |||
|---|---|---|---|
| Quadrant | BADHDUFLAG | Total packets | Discarded packets |
| A | 0 | 43 | 0 |
| B | 0 | 43 | 0 |
| C | 0 | 43 | 0 |
| D | 0 | 43 | 0 |
| Quadrant | Total seconds | Saturated seconds | Saturation percentage |
|---|---|---|---|
| A | 30683 | 582 | 1.896816% |
| B | 30679 | 784 | 2.555494% |
| C | 30680 | 3130 | 10.202086% |
| D | 30682 | 1084 | 3.533016% |
Noise dominated data is calculated using 1-second bins in cleaned event files. If a bin has >2000 counts, and if more than 50% of those come from <1% of pixels, then it is considered to be noise-dominated and hence unusable.
| Quadrant | # 1 sec bins | Bins with >0 counts | Bins with >2000 counts | High rate bins dominated by noise | Noise dominated (total time) | Noise dominated (detector-on time) | Marked lightcurve |
|---|---|---|---|---|---|---|---|
| A | 37144 | 30689 | 197 | 197 | 0.53% | 0.64% | 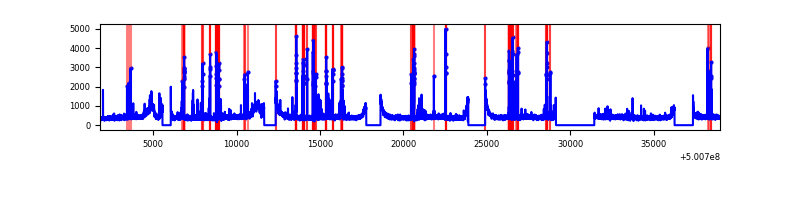 |
| B | 37144 | 30687 | 327 | 327 | 0.88% | 1.07% | 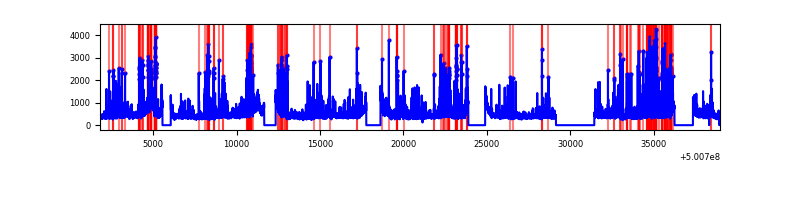 |
| C | 37144 | 30686 | 2653 | 2653 | 7.14% | 8.65% | 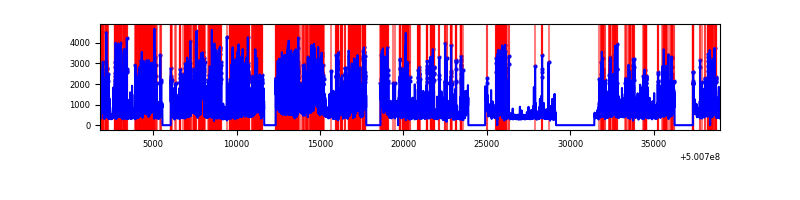 |
| D | 37144 | 30689 | 807 | 807 | 2.17% | 2.63% | 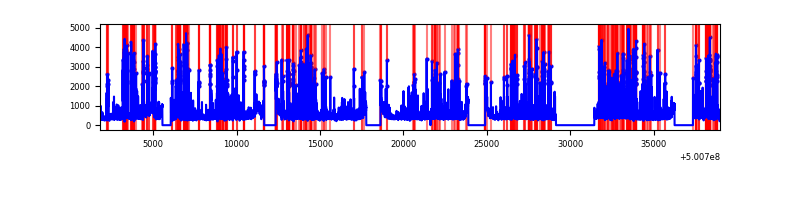 |
Top three noisy pixels from each quadrant. If the there are fewer than three noisy pixels in the level2.evt file, extra rows are filled as -1
| Pixel properties | Quadrant properties | ||||||
|---|---|---|---|---|---|---|---|
| Quadrant | DetID | PixID | Counts | Sigma | Mean | Median | Sigma |
| A | 0 | 8 | 556760 | 612.26 | 3435 | 3355 | 903.9 |
| A | 13 | 248 | 518316 | 569.72 | 3435 | 3355 | 903.9 |
| A | 0 | 117 | 120963 | 130.11 | 3435 | 3355 | 903.9 |
| B | 2 | 249 | 1975342 | 2799.84 | 3271 | 3163 | 704.4 |
| B | 5 | 185 | 760161 | 1074.69 | 3271 | 3163 | 704.4 |
| B | 4 | 81 | 276739 | 388.39 | 3271 | 3163 | 704.4 |
| C | 9 | 38 | 11161603 | 12742.54 | 3103 | 3069 | 875.7 |
| C | 13 | 3 | 2041487 | 2327.78 | 3103 | 3069 | 875.7 |
| C | 14 | 254 | 1119693 | 1275.13 | 3103 | 3069 | 875.7 |
| D | 3 | 12 | 1446298 | 1493.95 | 3270 | 3118 | 966.0 |
| D | 15 | 94 | 820751 | 846.4 | 3270 | 3118 | 966.0 |
| D | 3 | 224 | 636219 | 655.38 | 3270 | 3118 | 966.0 |
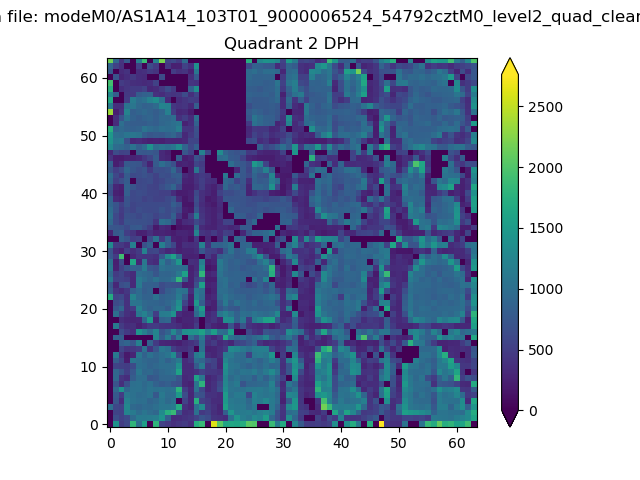
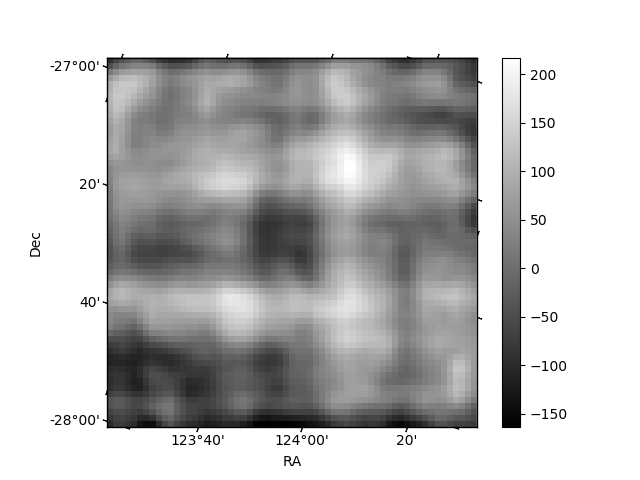
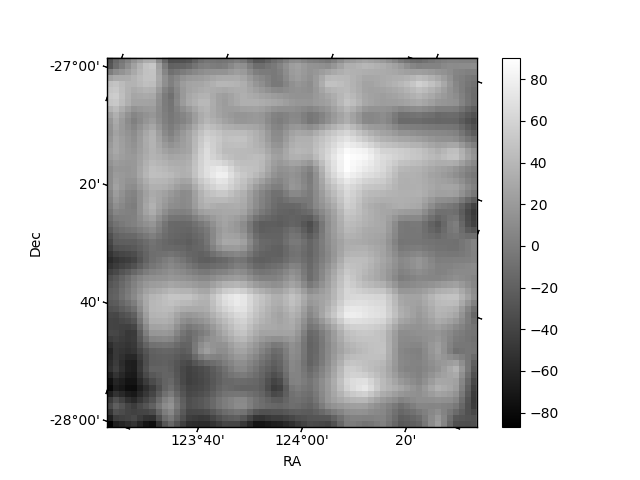
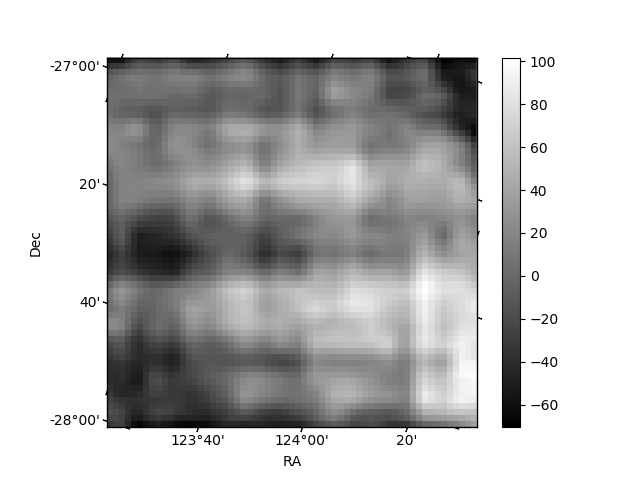
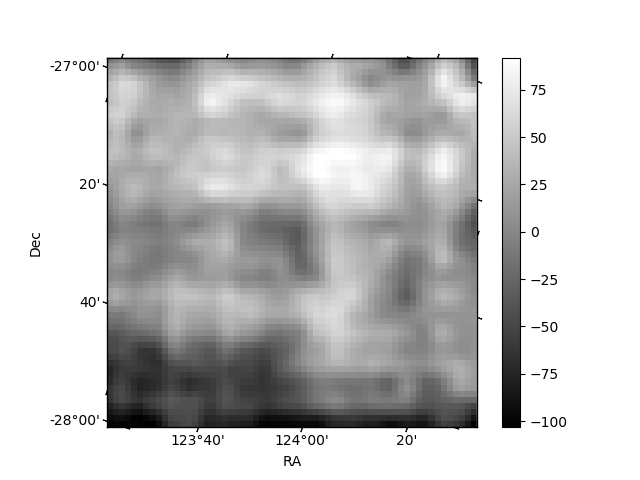
Histogram calculated using DETX and DETY for each event in the final _common_clean file
| Quadrant A | 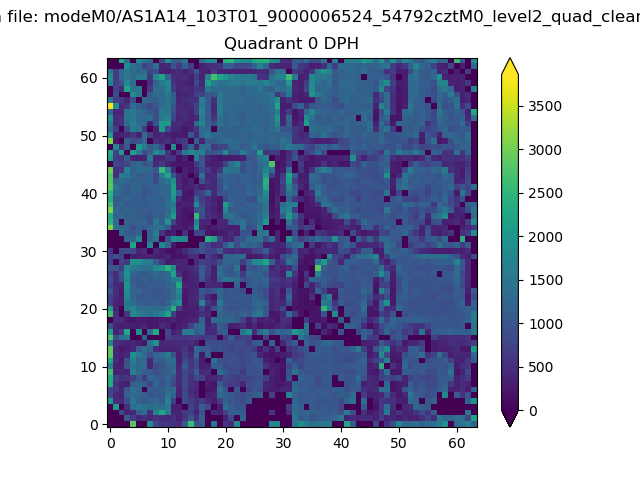 |
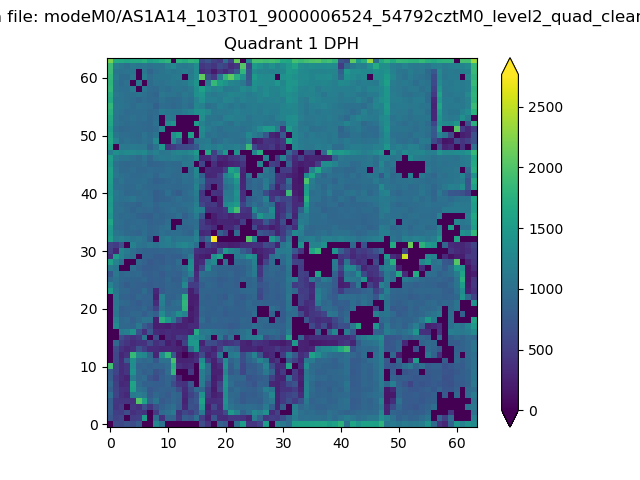 |
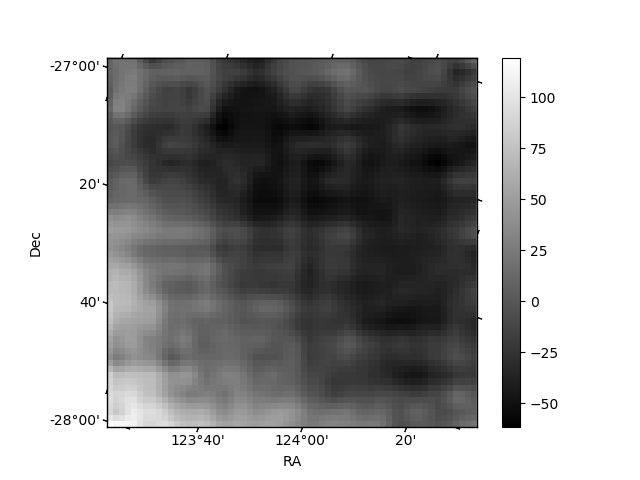
Quadrant B |
|---|---|---|---|
| Quadrant D | 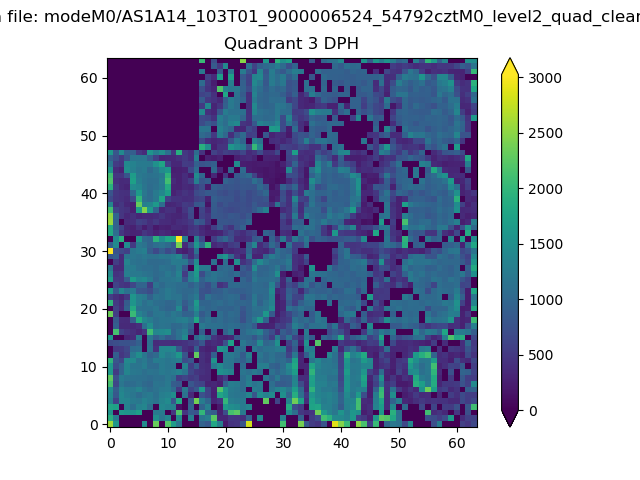 |
 |
Quadrant C |
| Plot type | Count rate plots | Images |
|---|---|---|
| Comparison with Poisson distribution Blue bars denote a histogram of data divided into 1 sec bins. Red curve is a Poisson curve with rate = median count rate of data. |
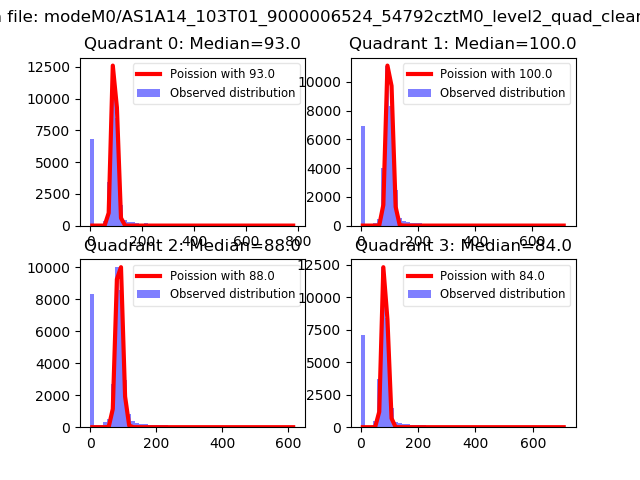 |
 |
| Quadrant-wise count rates Data is divided into 100 sec bins |
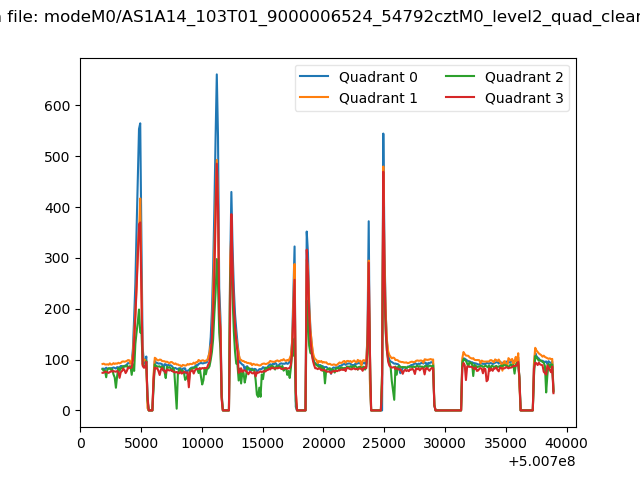 |
|
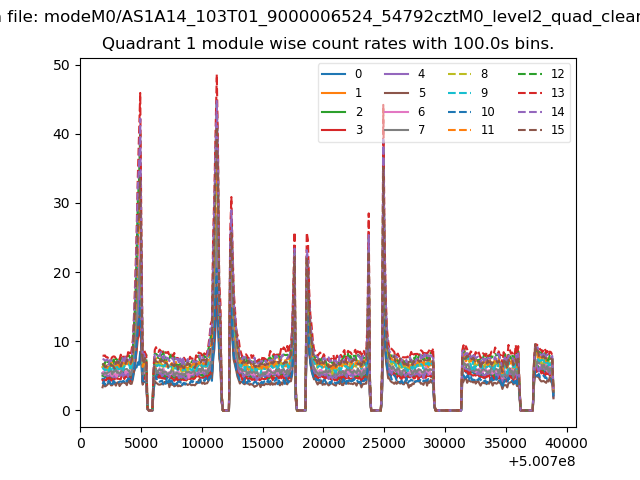
| Module-wise count rates for Quadrant A Data is divided into 100 sec bins |
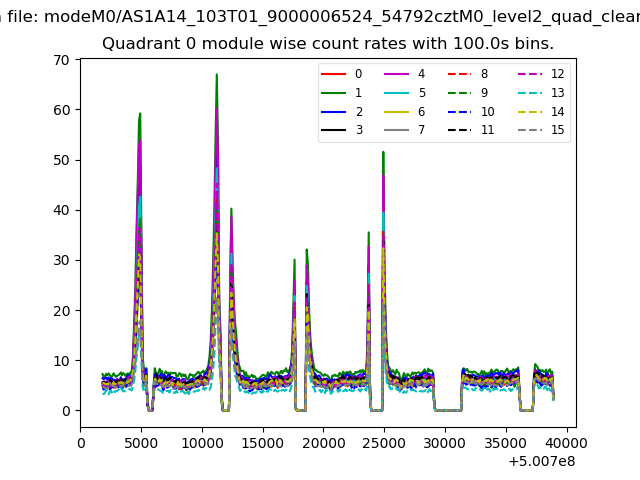 |
 |
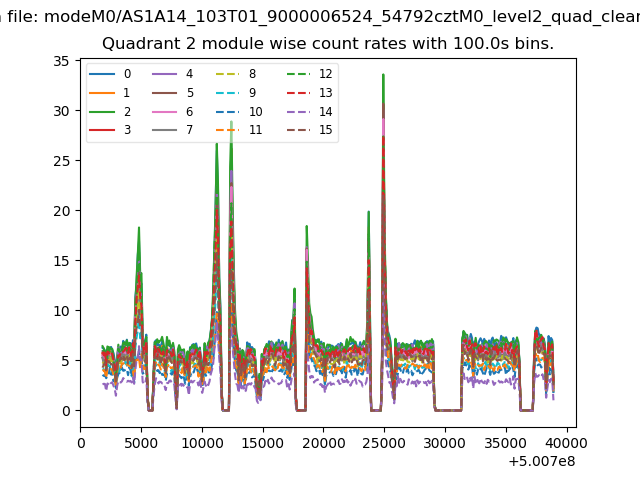
| Module-wise count rates for Quadrant B Data is divided into 100 sec bins |
 |
 |
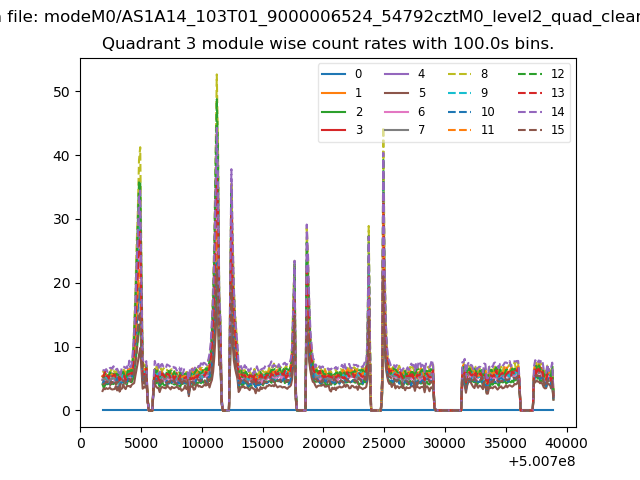
| Module-wise count rates for Quadrant C Data is divided into 100 sec bins |
 |
 |
| Module-wise count rates for Quadrant D Data is divided into 100 sec bins |
 |
 |
| Parameter | Plot |
|---|---|
| CZT HV Monitor | 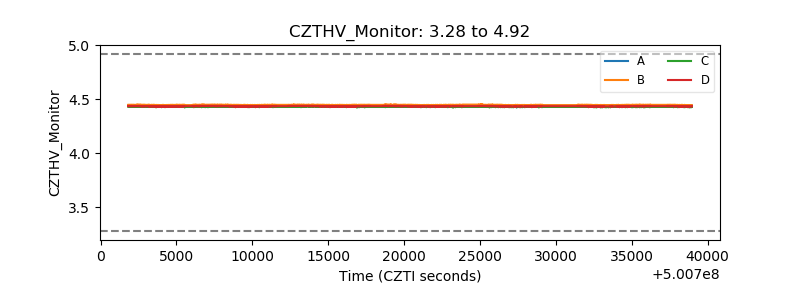 |
| D_VDD | 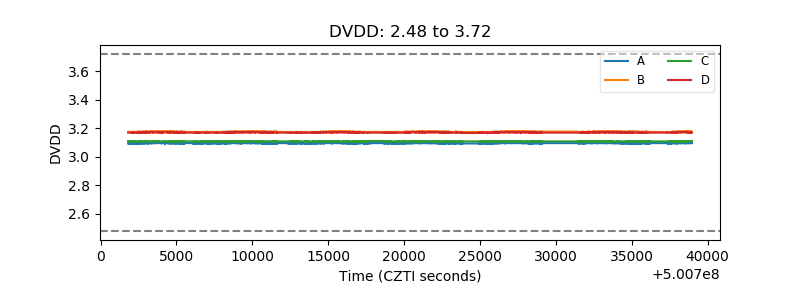 |
| Temperature 1 | 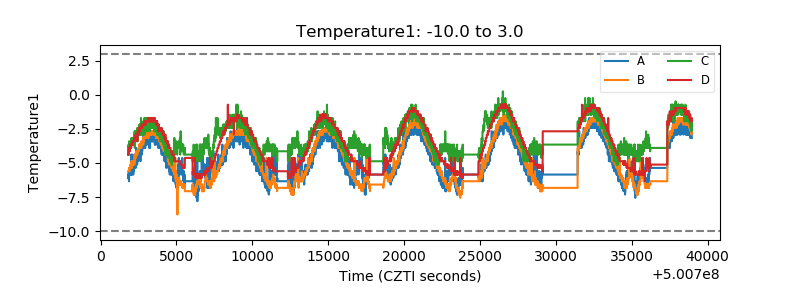 |
| Veto HV Monitor | 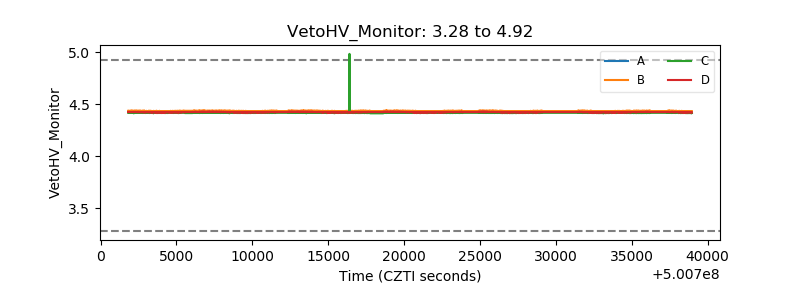 |
| Veto LLD | 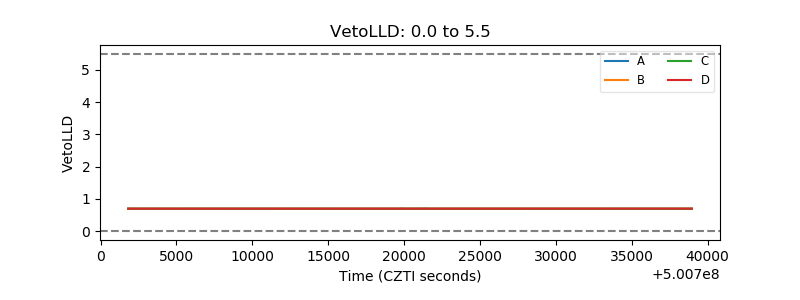 |
| Alpha Counter | 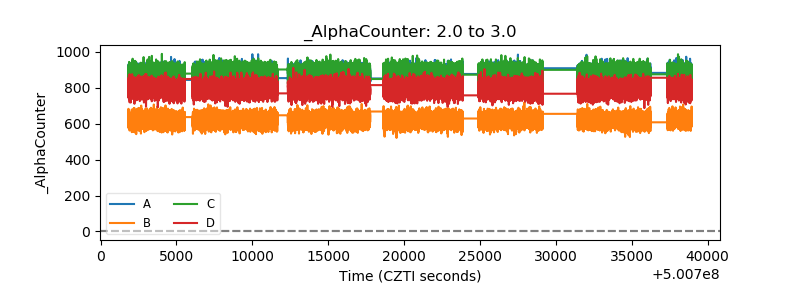 |
| _CPM_Rate | 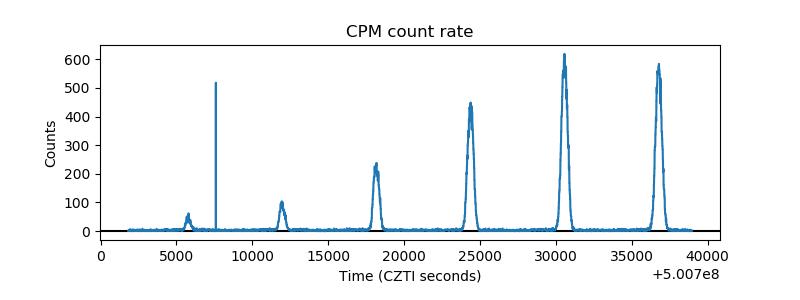 |
| CZT Counter | 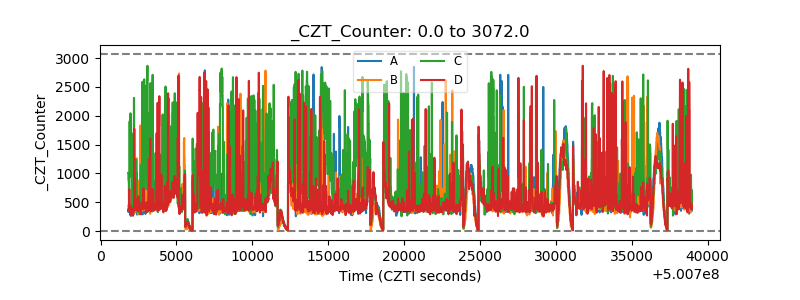 |
| +2.5 Volts monitor | 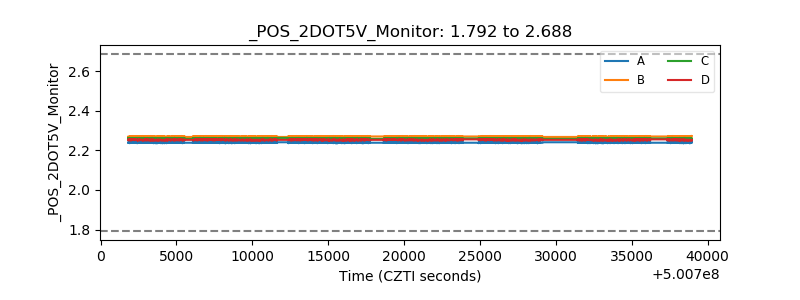 |
| +5 Volts monitor | 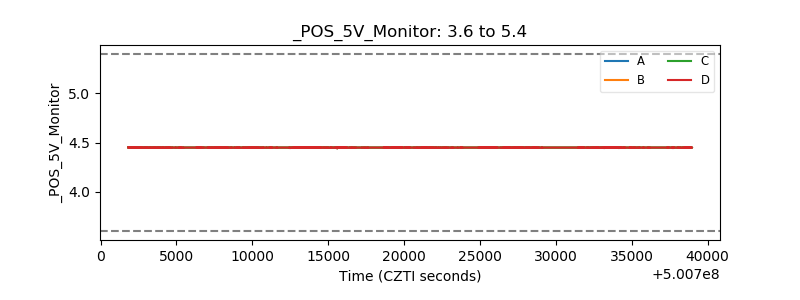 |
| _ROLL_ROT | 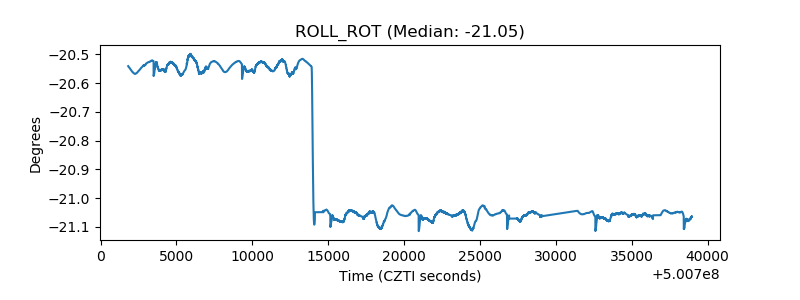 |
| _Roll_DEC | 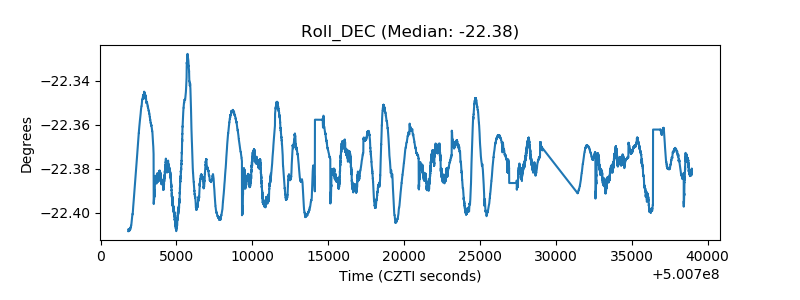 |
| _Roll_RA | 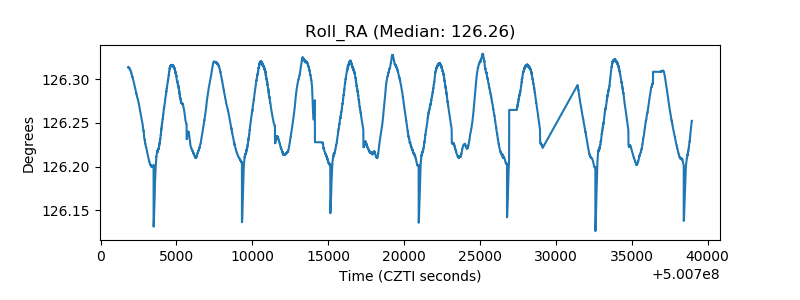 |
| Veto Counter | 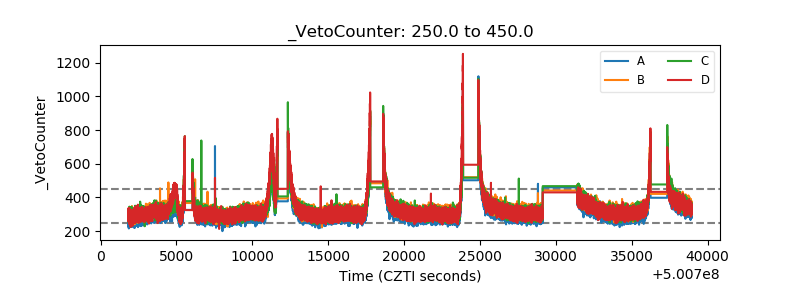 |