| Param | Original file | Final file |
|---|---|---|
| Filename | modeM0/AS1A14_103T01_9000006524_54793cztM0_level2.fits | modeM0/AS1A14_103T01_9000006524_54793cztM0_level2_quad_clean.evt |
| Size (bytes) | 490,299,840 | 95,094,720 |
| Size | 467.6 MB | 90.7 MB |
| Events in quadrant A | 2,864,417 | 633,130 |
| Events in quadrant B | 3,767,882 | 676,887 |
| Events in quadrant C | 7,327,099 | 539,671 |
| Events in quadrant D | 3,673,808 | 566,801 |
| Mode SS | |||
|---|---|---|---|
| Quadrant | BADHDUFLAG | Total packets | Discarded packets |
| A | 0 | 134 | 0 |
| B | 0 | 134 | 0 |
| C | 0 | 134 | 0 |
| D | 0 | 134 | 0 |
| Mode M0 | |||
|---|---|---|---|
| Quadrant | BADHDUFLAG | Total packets | Discarded packets |
| A | 0 | 13762 | 2 |
| B | 0 | 16059 | 2 |
| C | 0 | 26371 | 2 |
| D | 0 | 15761 | 2 |
| Mode M9 | |||
|---|---|---|---|
| Quadrant | BADHDUFLAG | Total packets | Discarded packets |
| A | 0 | 15 | 0 |
| B | 0 | 16 | 0 |
| C | 0 | 16 | 0 |
| D | 0 | 16 | 0 |
| Quadrant | Total seconds | Saturated seconds | Saturation percentage |
|---|---|---|---|
| A | 6646 | 103 | 1.549804% |
| B | 6646 | 190 | 2.858862% |
| C | 6646 | 962 | 14.474872% |
| D | 6646 | 184 | 2.768583% |
Noise dominated data is calculated using 1-second bins in cleaned event files. If a bin has >2000 counts, and if more than 50% of those come from <1% of pixels, then it is considered to be noise-dominated and hence unusable.
| Quadrant | # 1 sec bins | Bins with >0 counts | Bins with >2000 counts | High rate bins dominated by noise | Noise dominated (total time) | Noise dominated (detector-on time) | Marked lightcurve |
|---|---|---|---|---|---|---|---|
| A | 7771 | 6646 | 6 | 6 | 0.08% | 0.09% | 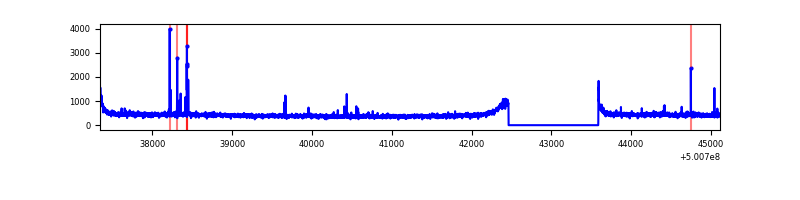 |
| B | 7771 | 6646 | 92 | 92 | 1.18% | 1.38% | 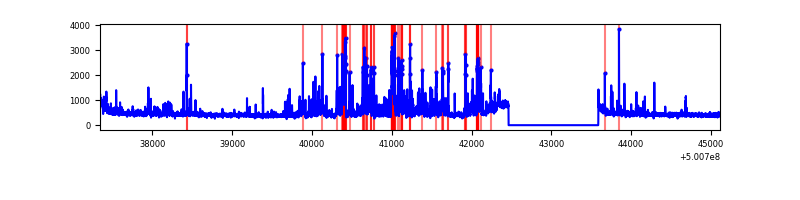 |
| C | 7771 | 6647 | 882 | 882 | 11.35% | 13.27% | 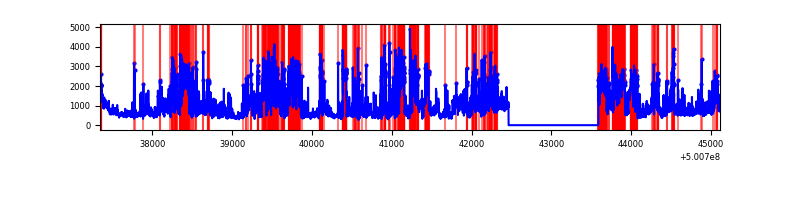 |
| D | 7771 | 6647 | 109 | 109 | 1.40% | 1.64% | 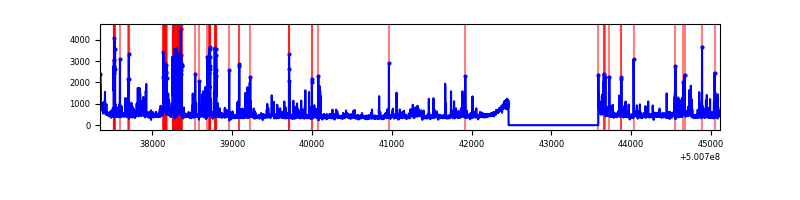 |
Top three noisy pixels from each quadrant. If the there are fewer than three noisy pixels in the level2.evt file, extra rows are filled as -1
| Pixel properties | Quadrant properties | ||||||
|---|---|---|---|---|---|---|---|
| Quadrant | DetID | PixID | Counts | Sigma | Mean | Median | Sigma |
| A | 5 | 240 | 21602 | 119.11 | 713 | 696 | 175.5 |
| A | 13 | 254 | 19097 | 104.84 | 713 | 696 | 175.5 |
| A | 3 | 14 | 17215 | 94.12 | 713 | 696 | 175.5 |
| B | 2 | 249 | 844584 | 5634.69 | 699 | 674 | 149.8 |
| B | 5 | 185 | 60913 | 402.21 | 699 | 674 | 149.8 |
| B | 6 | 255 | 47609 | 313.38 | 699 | 674 | 149.8 |
| C | 9 | 38 | 3813786 | 20990.02 | 657 | 651 | 181.7 |
| C | 13 | 3 | 315254 | 1731.78 | 657 | 651 | 181.7 |
| C | 6 | 223 | 210477 | 1155.02 | 657 | 651 | 181.7 |
| D | 3 | 12 | 428820 | 2209.09 | 685 | 656 | 193.8 |
| D | 14 | 52 | 90466 | 463.37 | 685 | 656 | 193.8 |
| D | 15 | 94 | 59496 | 303.58 | 685 | 656 | 193.8 |
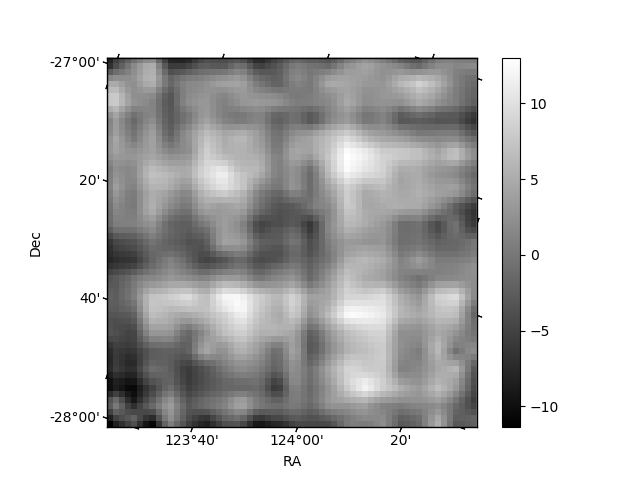
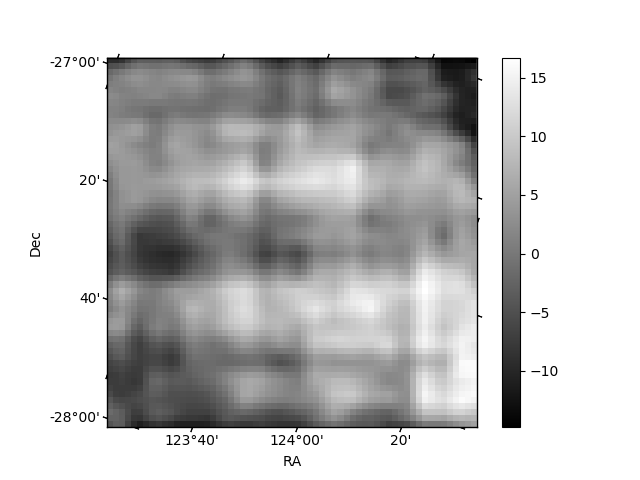
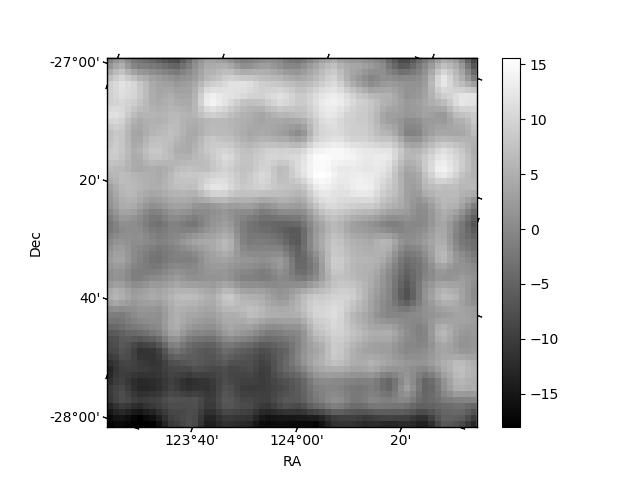
Histogram calculated using DETX and DETY for each event in the final _common_clean file
| Quadrant A | 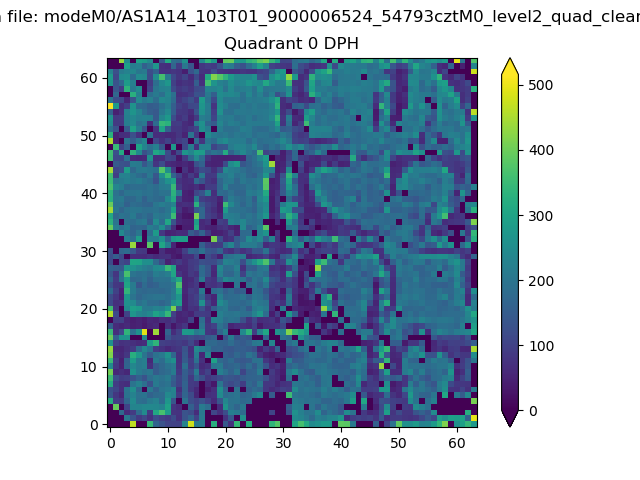 |
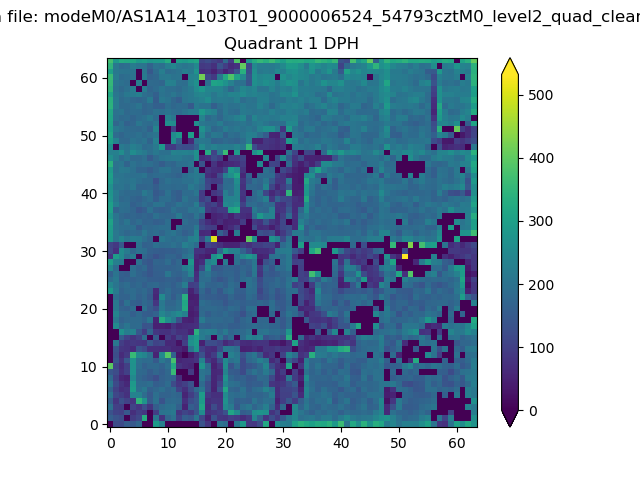 |
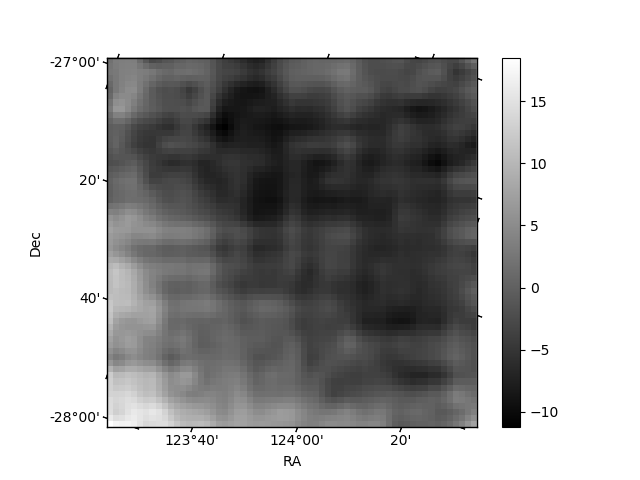
Quadrant B |
|---|---|---|---|
| Quadrant D | 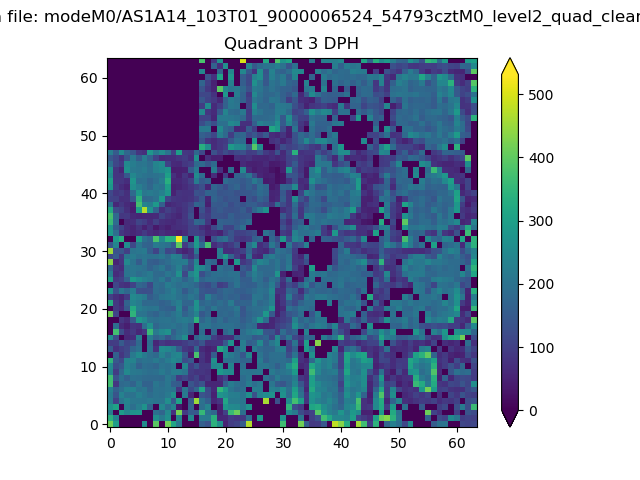 |
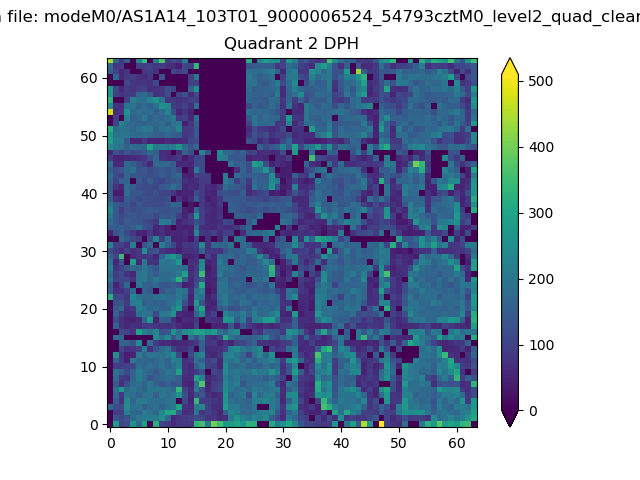 |
Quadrant C |
| Plot type | Count rate plots | Images |
|---|---|---|
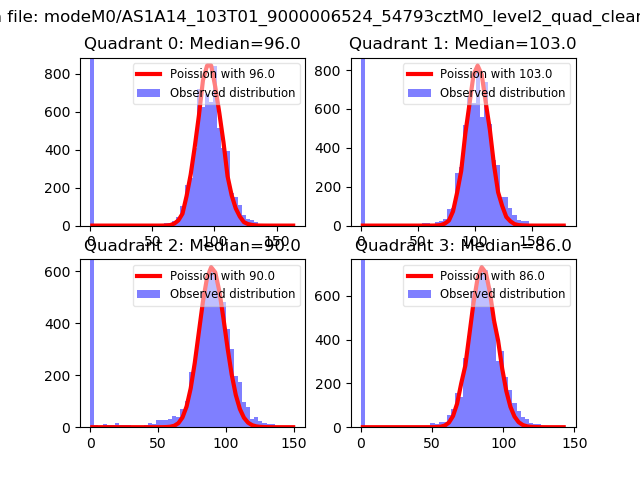
| Comparison with Poisson distribution Blue bars denote a histogram of data divided into 1 sec bins. Red curve is a Poisson curve with rate = median count rate of data. |
 |
 |
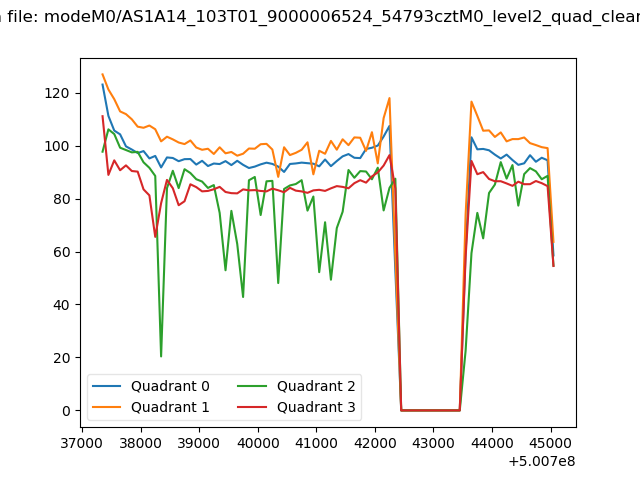
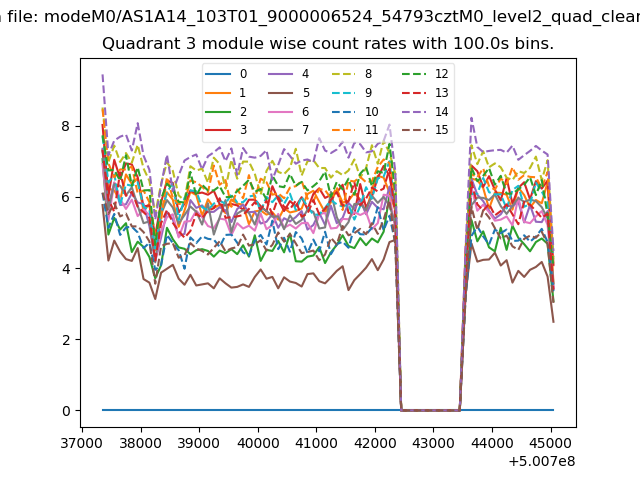
| Quadrant-wise count rates Data is divided into 100 sec bins |
 |
|
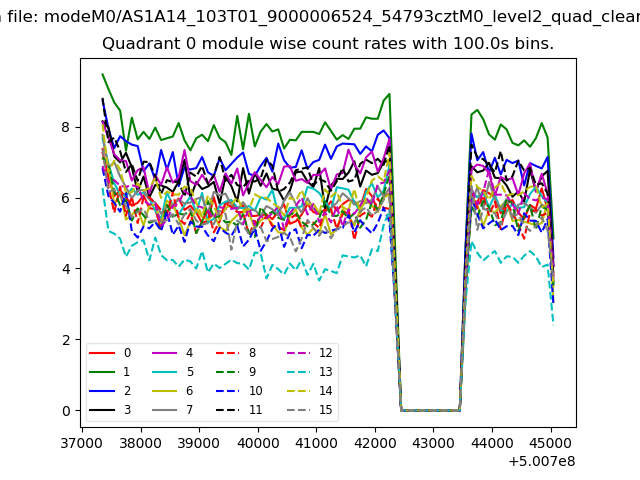
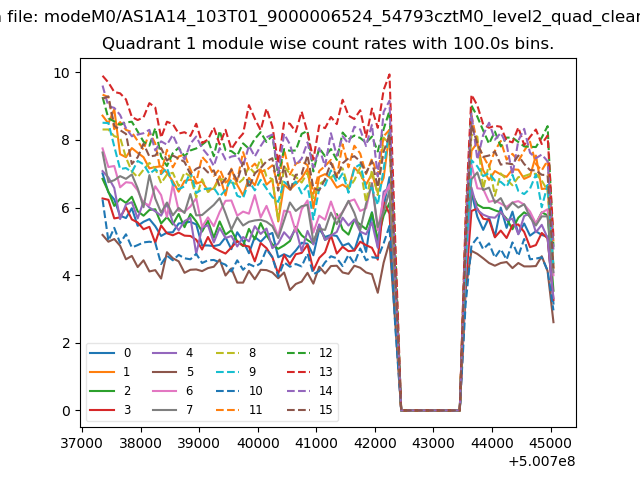
| Module-wise count rates for Quadrant A Data is divided into 100 sec bins |
 |
 |
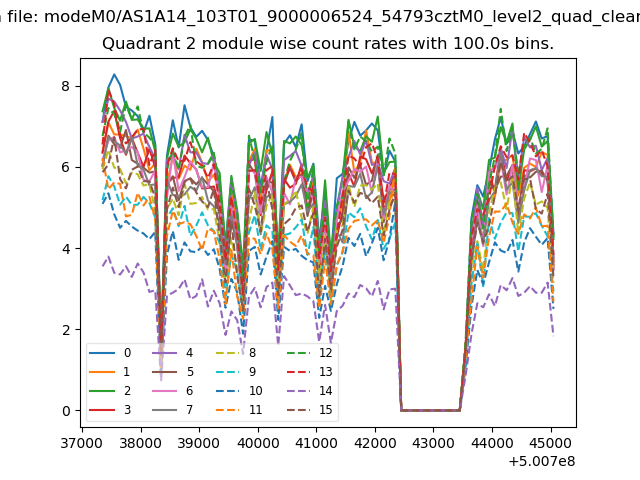
| Module-wise count rates for Quadrant B Data is divided into 100 sec bins |
 |
 |
| Module-wise count rates for Quadrant C Data is divided into 100 sec bins |
 |
 |
| Module-wise count rates for Quadrant D Data is divided into 100 sec bins |
 |
 |
| Parameter | Plot |
|---|---|
| CZT HV Monitor | 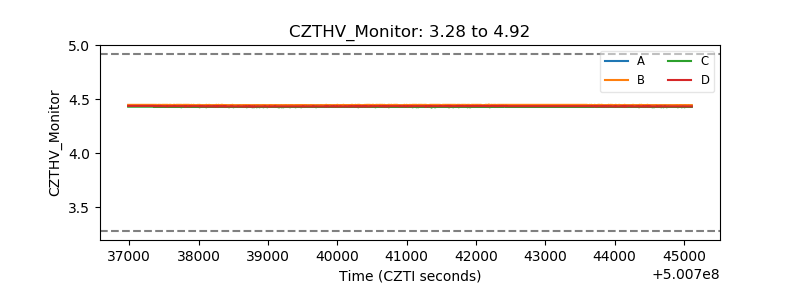 |
| D_VDD | 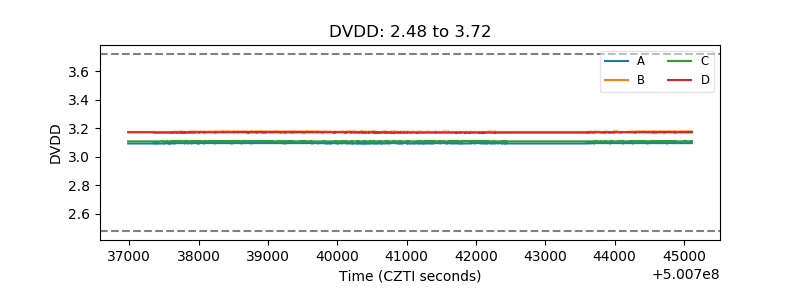 |
| Temperature 1 | 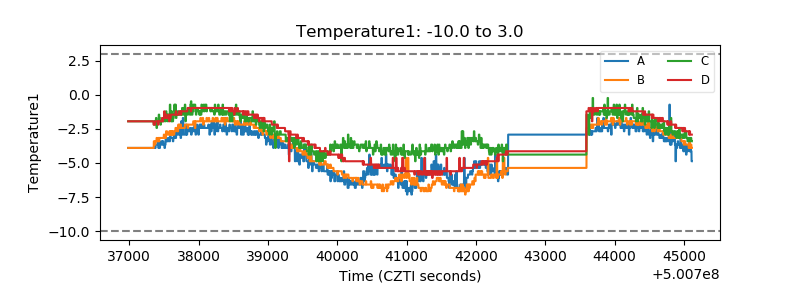 |
| Veto HV Monitor |  |
| Veto LLD | 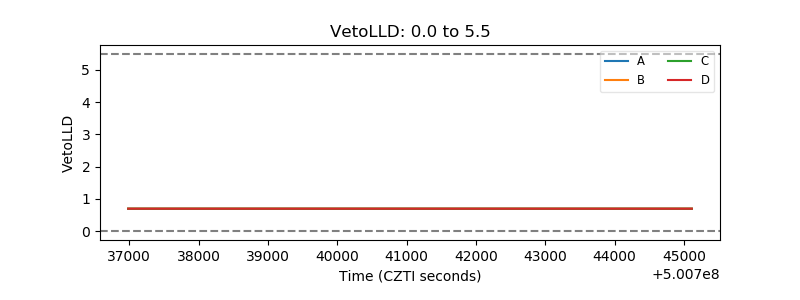 |
| Alpha Counter | 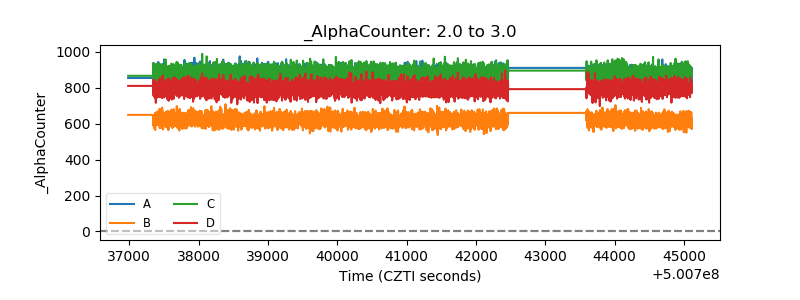 |
| _CPM_Rate | 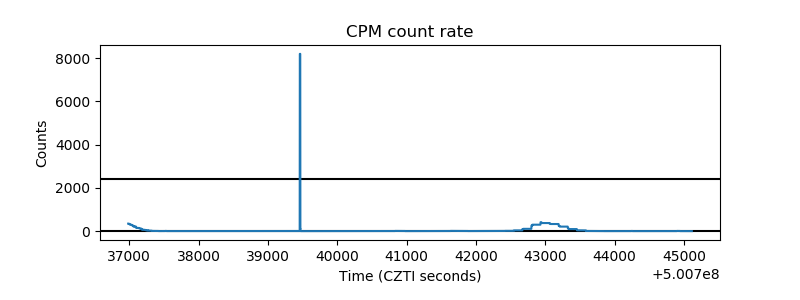 |
| CZT Counter | 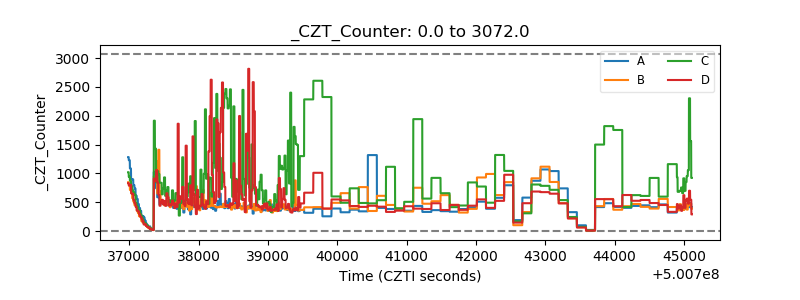 |
| +2.5 Volts monitor |  |
| +5 Volts monitor | 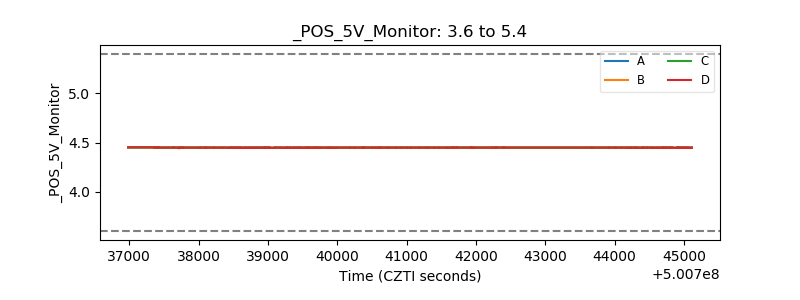 |
| _ROLL_ROT | 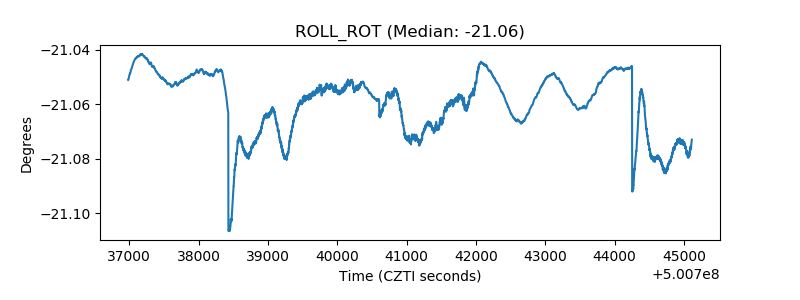 |
| _Roll_DEC | 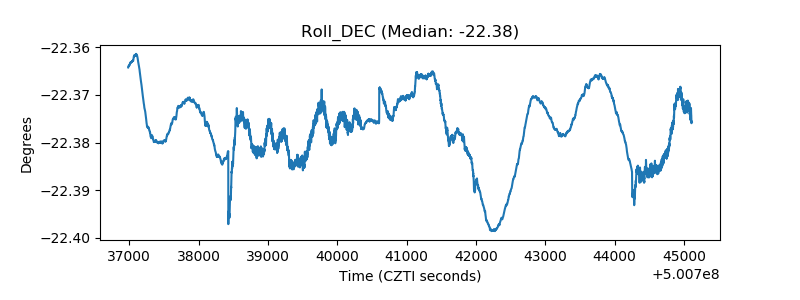 |
| _Roll_RA | 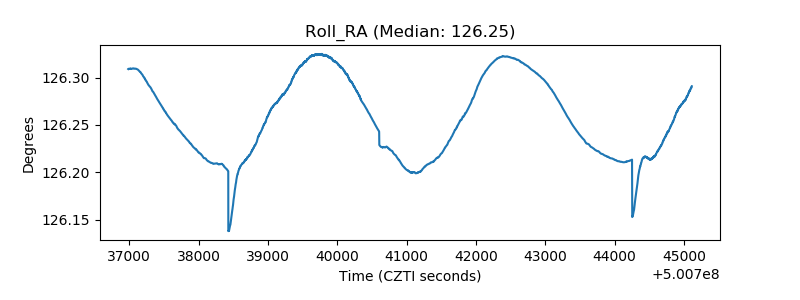 |
| Veto Counter | 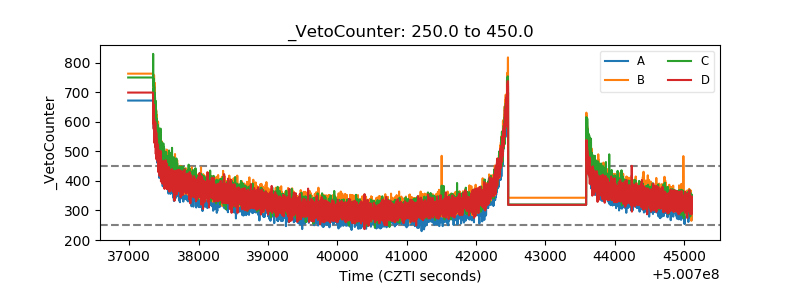 |